Prediction of differentially expressed microRNAs in blood as potential biomarkers for Alzheimer's disease by meta-analysis and adaptive boosting ...
←
→
Page content transcription
If your browser does not render page correctly, please read the page content below
Yuen et al. Alzheimer's Research & Therapy          (2021) 13:126
https://doi.org/10.1186/s13195-021-00862-z

 RESEARCH                                                                                                                                           Open Access

Prediction of differentially expressed
microRNAs in blood as potential
biomarkers for Alzheimer’s disease by
meta-analysis and adaptive boosting
ensemble learning
Sze Chung Yuen1†, Xiaonan Liang1†, Hongmei Zhu1, Yongliang Jia1,2,3 and Siu-wai Leung4,5*

  Abstract
  Background: Blood circulating microRNAs that are specific for Alzheimer’s disease (AD) can be identified from
  differentially expressed microRNAs (DEmiRNAs). However, non-reproducible and inconsistent reports of DEmiRNAs
  hinder biomarker development. The most reliable DEmiRNAs can be identified by meta-analysis. To enrich the pool
  of DEmiRNAs for potential AD biomarkers, we used a machine learning method called adaptive boosting for miRNA
  disease association (ABMDA) to identify eligible candidates that share similar characteristics with the DEmiRNAs
  identified from meta-analysis. This study aimed to identify blood circulating DEmiRNAs as potential AD biomarkers
  by augmenting meta-analysis with the ABMDA ensemble learning method.
  Methods: Studies on DEmiRNAs and their dysregulation states were corroborated with one another by meta-
  analysis based on a random-effects model. DEmiRNAs identified by meta-analysis were collected as positive
  examples of miRNA–AD pairs for ABMDA ensemble learning. ABMDA identified similar DEmiRNAs according to a set
  of predefined criteria. The biological significance of all resulting DEmiRNAs was determined by their target genes
  according to pathway enrichment analyses. The target genes common to both meta-analysis- and ABMDA-
  identified DEmiRNAs were collected to construct a network to investigate their biological functions.

* Correspondence: siuwai.leung@ed.ac.uk
†
 Sze Chung Yuen and Xiaonan Liang are co-first authors
4
 Shenzhen Institute of Artificial Intelligence and Robotics for Society,
Shenzhen, China
5
 Edinburgh Bayes Centre for AI Research in Shenzhen, College of Science
and Engineering, University of Edinburgh, Edinburgh, Scotland, UK
Full list of author information is available at the end of the article

                                        © The Author(s). 2021 Open Access This article is licensed under a Creative Commons Attribution 4.0 International License,
                                        which permits use, sharing, adaptation, distribution and reproduction in any medium or format, as long as you give
                                        appropriate credit to the original author(s) and the source, provide a link to the Creative Commons licence, and indicate if
                                        changes were made. The images or other third party material in this article are included in the article's Creative Commons
                                        licence, unless indicated otherwise in a credit line to the material. If material is not included in the article's Creative Commons
                                        licence and your intended use is not permitted by statutory regulation or exceeds the permitted use, you will need to obtain
                                        permission directly from the copyright holder. To view a copy of this licence, visit http://creativecommons.org/licenses/by/4.0/.
                                        The Creative Commons Public Domain Dedication waiver (http://creativecommons.org/publicdomain/zero/1.0/) applies to the
                                        data made available in this article, unless otherwise stated in a credit line to the data.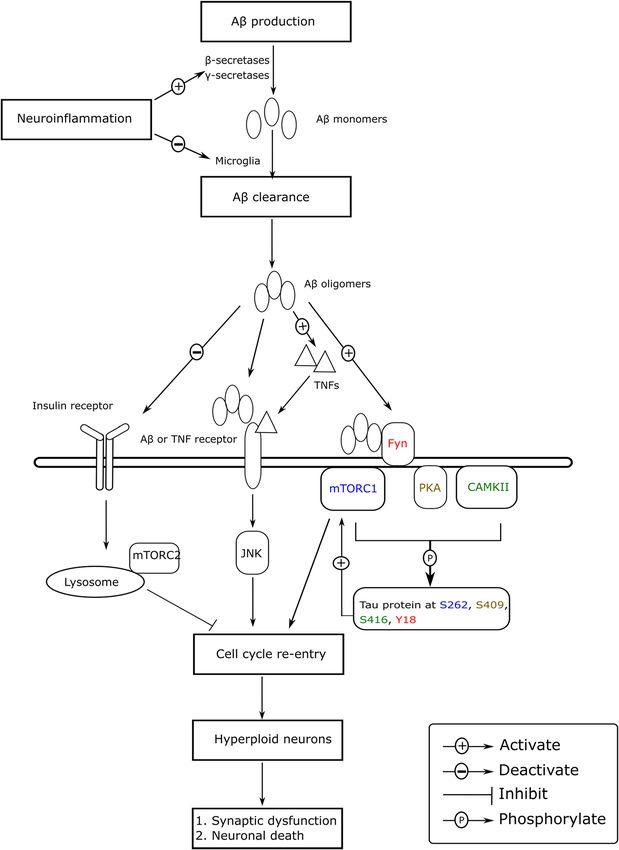
Yuen et al. Alzheimer's Research & Therapy   (2021) 13:126                                                      Page 2 of 30

 Results: A systematic database search found 7841 studies for an extensive meta-analysis, covering 54 independent
 comparisons of 47 differential miRNA expression studies, and identified 18 reliable DEmiRNAs. ABMDA ensemble
 learning was conducted based on the meta-analysis results and the Human MicroRNA Disease Database, which
 identified 10 additional AD-related DEmiRNAs. These 28 DEmiRNAs and their dysregulated pathways were related to
 neuroinflammation. The dysregulated pathway related to neuronal cell cycle re-entry (CCR) was the only statistically
 significant pathway of the ABMDA-identified DEmiRNAs. In the biological network constructed from 1865 common
 target genes of the identified DEmiRNAs, the multiple core ubiquitin-proteasome system, that is involved in
 neuroinflammation and CCR, was highly connected.
 Conclusion: This study identified 28 DEmiRNAs as potential AD biomarkers in blood, by meta-analysis and ABMDA
 ensemble learning in tandem. The DEmiRNAs identified by meta-analysis and ABMDA were significantly related to
 neuroinflammation, and the ABMDA-identified DEmiRNAs were related to neuronal CCR.
 Keywords: Alzheimer’s disease, Meta-analysis, MicroRNAs, ABMDA, Biomarkers, Neuroinflammation, Neuronal cell
 cycle re-entry

Background                                                       effects of invasive CSF sampling, such as positional
Alzheimer’s disease (AD) is subcellularly characterized          headache, Fei et al. [11] have proposed the use of per-
by the presence of extracellular amyloid-beta (Aβ)               ipheral blood Aβ detection, such as the ratio of Aβ42/
plaque deposition and intracellular neurofibrillary tan-         Aβ40. However, another review has reported that lower
gles of hyperphosphorylated tau proteins [1]. The aber-          plasma Aβ42/Aβ40 ratios might not be associated with
rant protein aggregates are accompanied by activation of         increased AD risk [12]. The plasma phosphorylated tau
neuroinflammation, and loss of synaptic functions [2]. In        217 is proposed to distinguish AD from non-AD neuro-
the progression of AD, irreversible loss of neurons and          degenerative individuals, since its level increases more
synaptic functions gradually develops over decades be-           steeply in non-demented individuals with amyloid posi-
fore the manifestation of cognitive symptoms [3]. Be-            tivity than those without amyloid positivity [13]. The
cause the root causes of pathological Aβ accumulation            limitations to use Aβ or tau proteins as biomarkers in
and hyperphosphorylated tau proteins are not clear, drug         blood might be due to several reasons. First, Aβ in both
development for AD often fails and current AD treat-             CSF and blood tends to self-aggregate [14], masking epi-
ments alleviate symptoms only. The failure of most clin-         topes for detection and reducing the correlation with
ical trials in AD has been partially attributed to the lack      AD. Second, the entrance of Aβ and tau proteins into
of sensitive biomarkers to identify potential AD [4],            body fluid is hindered by the extent of blood–brain bar-
which can identify and enroll patients at the early stage        rier (BBB) leakage [15]. Thus, there is a need to identify
of AD, as it may be too late to rescue the dysfunction           other potential non-invasive biomarkers to aid the diag-
present in advanced stages of the disease.                       nosis of AD. An ideal AD biomarker would allow for
  The National Institute of Neurological and Communi-            mass screening to identify patients at high risk of devel-
cative Disorders and Stroke and the Alzheimer’s Disease          oping AD in the presymptomatic stage with adequate
and Related Disorders Association (NINCDS-ADRDA)                 reliability.
and the National Institute on Aging and Alzheimer’s As-             MicroRNAs (miRNAs) are a class of single-stranded
sociation (NIA-AA) proposed that the diagnosis of AD             non-coding RNAs that are 18–25 nucleotides in length
should be dependent on biomarkers rather than solely             and bind to the 3′ untranslated region of target mRNAs
dependent on clinical symptoms [5, 6]. Aberrant levels           to modify the target mRNAs’ expression in a post-
of Aβ and tau proteins in cerebrospinal fluid (CSF) and          transcriptional manner [16]. Each miRNA simultan-
blood have been evaluated as biomarkers for AD diagno-           eously targets hundreds of mRNAs, and over 2500 ma-
sis [7, 8], specifically, increased levels of total and hyper-   ture miRNAs have been recorded in the latest version of
phosphorylated tau proteins, and decreased levels of Aβ          the miRBase database [17]. Out of all recorded miRNAs,
in CSF. CSF levels of total and hyperphosphorylated tau          300 have been associated with neurodegenerative dis-
proteins are correlated with neurofibrillary tangle load,        eases and 131 miRNAs are specific for AD [18]. Down-
and CSF levels of Aβ are inversely correlated with amyl-         regulated expressions of miR-29a/b-1, miR-29c, and
oid load [9]. However, a review concluded that these             miR-339-5p have been reported to upregulate the ex-
CSF biomarkers are more useful for ruling out AD, than           pression of BACE1 in AD brain, thereby increasing Aβ
for indicating a definite diagnosis [10]. To avoid the side      production [19–21]. The expression of miR-15/107 in
Yuen et al. Alzheimer's Research & Therapy   (2021) 13:126                                                       Page 3 of 30

cerebral cortical gray matter is correlated with amyloid        tomography (FDG-PET; sensitivity: 91%, specificity: 86%)
plaque density [22]. The AD-dysregulated miRNAs in              [37] for AD diagnosis. The results of these meta-
brain have been associated with neuroinflammation and           analyses demonstrate that some blood circulating
cell cycle regulation [23, 24] and may be released into         DEmiRNAs may be useful for AD diagnosis, but there
peripheral blood through the BBB [25] and transported           has not been extensive identification of DEmiRNAs that
by lipoproteins in circulation for stability [26]. These        may serve as AD biomarkers.
stable AD-dysregulated miRNAs in blood may reflect                Structural and functional patterns of similar DEmiR-
the composition of dysregulated miRNAs in brain, sug-           NAs can be identified by machine learning, which has
gesting that they may be potential biomarkers of AD.            been applied to the identification of AD biomarkers.
The dysregulated miRNAs were found in plasma and                Studies using different machine learning techniques have
serum of AD patients [27, 28], e.g., the expression of          identified different DEmiRNAs for AD diagnosis with up
miR-125b in serum of AD patients is correlated with             to 89% accuracy [38–40]. Until recently, machine learn-
Mini-Mental State Examination (MMSE) scores [29].               ing mainly focused on fine tuning the set of DEmiRNAs
Compared with biomarkers in brain or CSF, blood circu-          identified from differential miRNA expression profiling
lating biomarkers are preferable for their higher accessi-      studies to obtain a smaller panel of miRNAs for AD
bility. However, before establishing any miRNAs as AD           diagnosis. As an emerging trend, machine learning is be-
biomarkers, it is necessary to first evaluate their reliabil-   ing used to predict potential DEmiRNAs as AD bio-
ity and consistency among different studies of differen-        markers based on DEmiRNAs identified from
tially expressed miRNAs (DEmiRNAs) in AD patients,              differential expression profiling studies. For example,
and their biological significance to understand their roles     Zhao et al. [41] used the adaptive boosting for miRNA
in the pathogenesis of AD.                                      disease association (ABMDA) ensemble learning method
   Thus far, the development of blood circulating               to identify miRNAs that are associated with a disease.
DEmiRNAs as AD biomarkers has been hindered by in-              ABMDA is a supervised learning approach with valid-
consistent and unreliable studies. For example, Denk            ation against the Human MicroRNA Disease Database
et al. [30] and Wu et al. [31] conducted similar studies        (HMDD) [42]. Its clustering algorithm is based on k-
using quantitative real-time polymerase chain reaction          means distance, and its boosting technique combines
(qRT-PCR) to quantify the expression of miRNAs in               classifiers by their corresponding weights to form a
serum, and found 22 and 9 DEmiRNAs, respectively.               stronger classifier. The ABMDA ensemble learning
Only one DEmiRNA, miR-146a-5p, was common be-                   method relies upon the initial set of DEmiRNAs to pre-
tween the two studies. Further, the studies reported the        dict additional DEmiRNAs. In the present study, we
same miR-146a-5p to have opposite directions of dysreg-         used meta-analysis to enhance the reliability of the initial
ulation in AD. This inconsistency can be attributed to          DEmiRNAs and augment the prediction performance of
differences in the AD patients recruited for the trials, in-    the ABMDA ensemble learning method.
cluding the presence of other disease conditions that             This study aimed to identify blood circulating DEmiR-
might influence the levels of biological molecules in           NAs as potential AD biomarkers by augmenting the
blood, and the stages of disease progression [32, 33]. A        DEmiRNAs identified by meta-analysis with the
meta-analysis of these inconsistent DEmiRNA results             ABMDA ensemble learning method. The meta-analysis
may resolve discrepancies and enhance generalizability          was conducted under the guidance of the PRISMA state-
of the results. Takousis et al. [34] conducted a meta-          ment [43], with the adjustment in the risk of bias
analysis to identify DEmiRNAs in brain, blood, and CSF          assessment.
from expression profiling studies of AD. They applied
Stouffer’s method to integrate the P values of every            Methods
DEmiRNA from each independent study and found 32                The present meta-analysis was mainly conducted using
statistically significant DEmiRNAs in blood. However,           R and Python packages and is illustrated in Fig. 1. If an
Stouffer’s method does not include information about            included study contained several comparisons, the
dysregulation states of DEmiRNAs and its use of P               DEmiRNAs from each comparison were collected inde-
values is outdated in terms of the methodology of meta-         pendently. The sample sizes of control and AD groups,
analysis; thus, the results were probably biased by the         and DEmiRNAs and their dysregulated states from each
number of studies reporting the same DEmiRNAs. Hu               independent comparison were extracted. The names of
et al. and Zhang et al. [35, 36] also conducted meta-           all reported DEmiRNAs were standardized based on the
analyses independently and reported that the sensitivity        miRBase database [17] before the meta-analysis. A meta-
(86% and 80%, respectively) and specificity (87% and            analysis for the DEmiRNAs was performed when more
83%, respectively) of blood-based miRNAs are compar-            than one comparison reported the same DEmiRNA. Sta-
able with those of fluorodeoxyglucose-positron emission         tistically significant DEmiRNAs from the meta-analysis
Yuen et al. Alzheimer's Research & Therapy     (2021) 13:126                                                                         Page 4 of 30

 Fig. 1 Overall study design. The italic font and normal font on the right-hand side of the arrows represent the R package and python-based
 algorithm, respectively. The name of each database is shown on the left-hand side of the arrow

were collected as positive miRNA–AD associations                          Differential miRNA expression studies selection
for the ABMDA ensemble learning method to further                         Differential miRNA expression studies were collected
increase the number of positive miRNA–AD associa-                         from PubMed from inception until January 10, 2020,
tions. The ABMDA-identified miRNAs with scores                            from ScienceDirect and Web of Science between 1993
higher than the predefined criteria, together with the                    and 2019. The search strategy is shown below:
DEmiRNAs identified by the meta-analysis, were                              For PubMed, (“Alzheimer’s disease” [MESH Terms] OR
treated as potential AD biomarkers in blood. The bio-                     “Alzheimer’s disease” [All Fields] OR “alzheimer*” [MESH
logical significance of the identified DEmiRNAs was                       Terms] OR “alzheimer*” [All Fields]) AND (“microRNA*”
studied by a biological pathway enrichment analysis                       [MESH Terms] OR “microRNA*” [All Fields] OR
and network analysis of their corresponding target                        “miRNA*” [MESH Terms] OR “miRNA*” [All Fields])
genes. The combination of meta-analysis and ABMDA                           For ScienceDirect and Web of Science, (microRNA
ensemble learning might be beneficial to resolve the                      OR miRNA) AND Alzheimer
existing inconsistencies and perform systematical pre-                      After the search, two authors (SCY and XNL) screened
dictions based on reliable results.                                       all titles, abstracts, and full texts independently
Yuen et al. Alzheimer's Research & Therapy   (2021) 13:126                                                       Page 5 of 30

according to the eligibility criteria. Disagreements be-         upregulated and downregulated cases in the disease
tween the authors were resolved by discussion with the           (control) group, respectively. Then
                                                                                                   Pthe overall effect was
other authors.                                                                                   W i θi
                                                                 computed according to formula, P W , where Wi is the
   The case-control studies reporting differential miRNA                                                i

expression in blood from AD and healthy participants             weight and is equal to 1/(vi + τ2), where vi is the sample
were included. The included studies had to report the            variance. A larger sample size has more weight on the
differential expression profiling methods, sample sizes of       overall effect size. The P values were adjusted by false
the disease and control groups, and statistical signifi-         discovery rate (FDR), and DEmiRNAs with FDR-
cance for each DEmiRNA. Studies were excluded if they            adjusted P values less than 0.05 were regarded as statisti-
(1) were not AD research (i.e., focused on other demen-          cally significant. Statistically significant DEmiRNAs with
tia disease conditions); (2) reported irrelevant effects on      logORs above or below 0 were considered upregulated
differential miRNA expression profiles (i.e., demon-             or downregulated, respectively, in AD compared with
strated treatment effects on the differential miRNA ex-          healthy controls.
pression); (3) did not report the blood DEmiRNAs for               Subgroup analysis was conducted based on the
AD and healthy participants (i.e., were not controlled           DEmiRNAs collected from the included differential
studies, or recruited AD participants suffering from             miRNA expression studies. The DEmiRNAs were split
other diseases); (4) did not report DEmiRNAs and their           into four different subgroups based on the blood sample
corresponding dysregulation states (i.e., up or down) as         sources, i.e., whole blood, plasma, serum, and peripheral
outcomes; or (5) did not obtain DEmiRNAs by a valid-             blood mononuclear cell (PBMC).
ation method (i.e., qRT-PCR).
                                                                 ABMDA identification of DEmiRNAs
                                                                 ABMDA ensemble learning was used to identify poten-
Meta-analysis                                                    tial miRNA–disease associations. The original miRNA–
For each study, the following data were extracted for the        disease associations with significant dysregulation in the
meta-analysis: (1) comparison ID (PubMed ID with                 “circulation_biomarker_diagnosis” category were ex-
blood elements or disease stages); (2) blood elements;           tracted from HMDD, in which the associations are ex-
(3) differential miRNA expression profiling method; (4)          perimentally verified. DEmiRNAs identified in the meta-
number of AD cases; (5) number of control cases; and             analysis with adjusted P values less than 0.05 were input
(6) DEmiRNAs and their dysregulated states. For studies          into the ABMDA ensemble learning method as positive
that reported both screening and validation results of           miRNA–AD associations to further increase the number
differential miRNA expression, only the results from val-        of positive miRNA–AD associations. In addition to ini-
idation methods were collected. The names of extracted           tial miRNA–disease associations, ABMDA ensemble
DEmiRNAs were standardized using the miRNAmeCon-                 learning also requires disease–disease similarity and
verter [44] package for R software with the miRBase              miRNA–miRNA functional similarity. The disease–dis-
database [17]. For each DEmiRNA that was reported by             ease similarity was determined using the DOSE [46]
more than one comparison, a meta-analysis was per-               package for R software. The miRNA–miRNA functional
formed using the metafor [45] package for R software.            similarity was retrieved from the database MISIM [47].
The meta-analysis was conducted for each qualified               The ABMDA-identified DEmiRNAs were sorted by their
DEmiRNA, independently, under a random-effects                   prediction scores, and the DEmiRNAs with top predic-
model. For each qualified DEmiRNA from independent               tion scores were collected until the first predicted
comparisons, that was reported as binary dysregulation           DEmiRNA that was reported statistically insignificant in
(i.e., upregulation or downregulation) in AD group com-          the meta-analysis. The names of predicted DEmiRNAs
pared with healthy control group. The effect sizes of bin-       were standardized using the miRNAmeConverter pack-
ary data were calculated as loge odds ratios (logORs)            age for R software with the miRBase database [17]. The
based on the number of dysregulation events in both              ABMDA-identified DEmiRNAs with the top prediction
disease and control samples. The heterogeneity of each           scores, together with the meta-analysis DEmiRNAs were
DEmiRNA was reported as tau square (τ2) based on the             considered potential AD biomarkers.
restricted maximum-likelihood estimator and I2 statis-
tics. The outcomes were logORs with a 95% confidence             Biological significance of DEmiRNAs from meta-analysis
interval (CI), P values, τ2, and I2. For each DEmiRNA in         and ABMDA by independent and synergic biological
the ith study, the effect size (θi ) based on the numbers        enrichment analysis
of dysregulation events in both AD and control samples           Each miRNA regulates a large number of genes to exert
was calculated according to the formula, log(ABiiC
                                                 Di
                                                    i
                                                      ), where   a profound influence on genetic expression in specific
Ai and Bi (Ci and Di) represent the number of                    cellular functions, and the primary function of each
Yuen et al. Alzheimer's Research & Therapy (2021) 13:126 Page 6 of 30
miRNA can be understood by identifying its target Results
genes. The target genes of the DEmiRNAs from the Differential miRNA expression studies included in the
meta-analysis and ABMDA identification were ob- analysis
tained using the multiMiR [48] package for R soft- The selection process of the differential miRNA expres-
ware based on the database miRTarBase [49]. The sion studies is shown in Fig. 2. A total of 7841 studies
target genes of two DEmiRNA categories were col- were initially identified from PubMed, ScienceDirect,
lected separately to conduct two independent enrich- and Web of Science. After a systematic search, 47 stud-
ment analyses and were also combined to conduct a ies met the eligibility criteria and were included in the
synergic enrichment analysis. The biological enrich- present study [23, 27–31, 39, 40, 54–92]. The character-
ment analysis was conducted using the clusterProfiler istics of the included studies are shown in Table 1. The
[50] package for R software based on the Kyoto studies mainly focused on four blood elements: serum,
Encyclopedia of Genes and Genomes (KEGG) [51]. plasma, whole blood, and peripheral blood mononuclear
The pathways with FDR-adjusted P values less than cells. Serum (n = 19) was the most extensively studied,
0.05 were considered statistically significant. followed by plasma (n = 16).
Identification of DEmiRNAs from meta-analysis
Collaborative biological function of DEmiRNAs from After DEmiRNA name standardization, there were 115
meta-analysis and ABMDA by network analysis DEmiRNAs reported in 54 independent comparisons of
The target gene semantic similarity measurements of 47 differential expression studies that compared AD
the DEmiRNAs identified from the meta-analysis and blood samples with healthy blood samples. Eight-eight
ABMDA were computed using the DOSE package for DEmiRNAs were found in one blood element, 25
R. The target genes with semantic similarity over 0.95 DEmiRNAs were found in two blood elements, two
were treated as common target genes in the two DEmiRNAs were found in three blood elements, and no
DEmiRNA categories. The DEmiRNAs and common DEmiRNAs were found in all four blood elements. The
target genes of the two DEmiRNA categories were most frequently reported DEmiRNAs in AD blood were
used to construct a DEmiRNA–gene network based miR-146a-5p and miR-26a-5p, which were dysregulated
on the data from STRING (version 11) [52] to inves- in five independent comparisons (Table 2). Of the 115
tigate the collaborative function of the DEmiRNAs DEmiRNAs, 43 (37.4%) were reported in at least two in-
identified from the meta-analysis and ABMDA. Only dependent comparisons; dysregulation of 18 of them was
interactions with the highest confidence (0.9) were reported consistently in the same direction, whereas dys-
kept from the STRING. regulation of 25 of them was reported in different direc-
tions. Based on the currently available data, none of the
inconsistent DEmiRNA results were resolved in this
Risk of bias meta-analysis. In the meta-analysis of 43 dysregulated
The risk of bias for each included study was evalu- miRNAs, 18 DEmiRNAs were found to be statistically
ated according to the Minimum Information for Pub- significant (Table 3; Additional file 1); 7 and 11 DEmiR-
lication of Quantitative Real-time PCR Experiments NAs were upregulated and downregulated, respectively.
(MIQE) [53]. This guideline is designed to assess the Among the 18 DEmiRNAs identified in this study, 6 of
quality of qRT-PCR data and describes the minimum them (let-7d-5p, miR-107, miR-128-3p, miR-191-5p,
information required to ensure that experimental re- miR-29c-3p, and miR-93-5p) were also found statistically
sults can be comprehensively interpreted and inde- significant in a previous meta-analysis [34]. The discrep-
pendently verified. In the present study, the guideline ancy could be due to that we only included the literature
was used to assess the quality of the expression pro- with qRT-PCR as validation results, and we treated com-
filing analysis of the included studies, including ex- parisons independently even that those comparisons
perimental design, sample annotation, experimental were from the same literature. Meanwhile, 13 DEmiR-
procedure, data processing pipeline, and result pres- NAs of our meta-analytical results (let-7d-5p, miR-106b-
entation. The evaluation was performed by two au- 3p, miR-107, miR-126-5p, miR-148b-5p, miR-181c-3p,
thors (SCY and XNL), independently. Disagreements miR-191-5p, miR-200a-3p, miR-22-3p, miR-483-5p,
between the authors were resolved by discussion with miR-486-5p, miR-502-3p, and miR-93-5p), were re-
the other authors. Items with low risk were counted ported contributing the AD diagnostic values in sensitiv-
+ 1, suggesting high reproducibility; items with un- ity and specificity in Hu et al. and Zhang et al. [35, 36].
clear risk were counted 0, suggesting ambiguous re- The most significantly downregulated DEmiRNA was
producibility; and items with high risk were counted miR-107, which was identified in four independent com-
− 1, suggesting low reproducibility. parisons. MiR-106b-39 was the most significantlyYuen et al. Alzheimer's Research & Therapy (2021) 13:126 Page 7 of 30
Fig. 2 Flow diagram of the differential miRNA expression study selection, including the identification, screening, eligibility, and inclusion stages
upregulated DEmiRNA among four independent com- the “circulation_biomarker_diagnosis” category in
parisons. Downregulation of miR-107 has been reported HMDD, including 17 known miRNA–AD associations.
to increase BACE1 expression [93] and influence cell Identification of miRNA–disease associations by meta-
cycle protein expression [94]. The dysregulation of miR- analysis increased the number of positive miRNA–AD
106b-3p is negatively correlated with MMSE score [66] associations by 15 for the ABMDA identification after
and modulates Aβ metabolism [95]. Most DEmiRNAs removing duplicates. The eleventh miRNA from the
identified in the meta-analysis were associated with me- ABMDA results was determined to be statistically insig-
diating Aβ generation, tau protein phosphorylation, and nificant in the meta-analysis. Therefore, the first 10 miR-
neuronal functions maintenance. NAs with prediction scores ranging from 9.45 to 7.88
For subgroup analysis, among 54 comparisons, 7, 17, were collected (Table 5; Additional file 2). Most of these
23, and 7 comparisons investigated the DEmiRNAs in 10 miRNAs have been associated with multiple types of
whole blood, plasma, serum, and PBMC, respectively. cancer as diagnostic or prognostic biomarkers [98–104].
The statistically significant DEmiRNAs from the sub- Only one miRNA, miR-155, has been reported as a bio-
group meta-analysis are shown in Table 4. MiR-107 was marker in AD for mediating neuroinflammation [105].
consistently found in two subgroups, whole blood and MiR-339-5p is upregulated to alleviate neuroinflam-
plasma. Two miRNAs, miR-103a-3p in plasma and miR- mation by inhibiting HMGB1 [106]. HMGB1 encodes
181c-5p in serum, were found statistically significant in high mobility group box 1 to produce proinflammatory
the subgroup analysis, but not in the meta-analysis. cytokines by binding to receptors for advanced glycation
MiR-103a-3p is recently reported to be related to AD end products (RAGE) [107] and inhibiting IKK-β and
progression via regulating NPAS3 expression [96], while IKK-γ, which are key elements of NF-κB signaling [108].
low level of miR-181c-5p in serum is suggested to be an NF-κB signaling can also be modulated by the identified
indicator for cerebral vulnerability in AD [97]. DEmiRNAs through multiple mechanisms. Both miR-
203a-3p and let-7b-5p target IGF1R, which encodes
Identification of potential biomarkers by the ABMDA insulin-like growth factor 1 receptor, to alleviate tumor
ensemble learning method necrosis factor (TNF)-induced activation of NF-κB [109,
A total of 1751 known miRNA–disease associations be- 110]. MiR-155 and miR-625-5p decrease the expression
tween 413 miRNAs and 227 diseases were obtained from of SHIP and AKT2, which encode Src homology 2-Yuen et al. Alzheimer's Research & Therapy (2021) 13:126 Page 8 of 30
Table 1 Characteristics of the included differential miRNA expression studies
PubMed Comparison ID Blood elements Differential miRNA expression Number of Number of Number of Number of
ID profiling methods (screening control case AD case upregulated downregulated
method/validation method) miRNA miRNA
31857133 31857133_Ser Serum qRT-PCR 93 108 1
31811079 31811079_Ser Serum qRT-PCR 51 32 9 3
31849573 31849573_Pla Plasma microRNA microarray/qRT-PCR 31 16 2
31809862 31809862_WB Whole blood qRT-PCR 214 145 1 1
31766231 31766231_Pla Plasma microRNA microarray/qRT-PCR 29 23 1
31691877 31691877_Ser Serum qRT-PCR 30 30 4
31592314 31592314_Pla Plasma RNA deep-sequencing/qRT-PCR 11 10 6
31572518 31572518_Ser Serum qRT-PCR 98 105 1
31420923 31420923_Pla Plasma qRT-PCR 120 120 2
31092279 31092279_Pla Plasma qRT-PCR 14 56 3
30914454 30914454_Pla Plasma qRT-PCR 385 385 5
30328325 30328325_Pla Plasma qRT-PCR 20 20 1
29966198 29966198_Pla Plasma qRT-PCR 10 10 2
29746584 29746584_Ser Serum qRT-PCR 38 47 14 8
29635818 29635818_Pla Plasma qRT-PCR 20 20 1
29606187 29606187_Ser Serum qRT-PCR 107 228 2 1
29036829 29036829_WB Whole blood microRNA microarray/qRT-PCR 17 21 3
29036818 29036818_Ser_ Serum RNA deep-sequencing/qRT-PCR 86 31 1 5
Mild
29036818_Ser_ Serum RNA deep-sequencing/qRT-PCR 86 52 3 5
Mod
29036818_Ser_ Serum RNA deep-sequencing/qRT-PCR 86 38 4 5
Sev
28934394 28934394_Ser Serum microRNA microarray/qRT-PCR 18 11 1
28849039 28849039_Ser_ Serum microRNA microarray/qRT-PCR 30 30 1
Mil
28849039_Ser_ Serum microRNA microarray/qRT-PCR 30 30 1
Mod
28626163 28626163_Ser Serum RNA deep-sequencing/qRT-PCR 40 45 5 4
28179587 28179587_Pla_ Plasma qRT-PCR 9 13 4 3
AD2
28179587_Pla_ Plasma qRT-PCR 9 8 4
MCI-AD2
28137310 28137310_Ser Serum RNA deep-sequencing/qRT-PCR 22 36 1
27545218 27545218_Ser Serum qRT-PCR 40 48 1
27501295 27501295_WB Whole blood qRT-PCR 109 172 4
27446280 27446280_WB Whole blood qRT-PCR 25 25 1
27277332 27277332_WB Whole blood qRT-PCR 30 30 1
27239545 27239545_PBMC Peripheral blood qRT-PCR 36 36 3
mononuclear cells
27027823 27027823_Ser Serum qRT-PCR 62 84 1 3
26973465 26973465_Pla Plasma microRNA microarray/qRT-PCR 40 40 3
26497032 26497032_PBMC Peripheral blood microRNA microarray/qRT-PCR 41 45 2 1
mononuclear cells
26078483 26078483_Ser Serum RNA deep-sequencing/qRT-PCR 75 79 4
25955795 25955795_WB Whole blood qRT-PCR 30 30 1Yuen et al. Alzheimer's Research & Therapy (2021) 13:126 Page 9 of 30
Table 1 Characteristics of the included differential miRNA expression studies (Continued)
PubMed Comparison ID Blood elements Differential miRNA expression Number of Number of Number of Number of
ID profiling methods (screening control case AD case upregulated downregulated
method/validation method) miRNA miRNA
25742200 25742200_Pla Plasma qRT-PCR 81 97 1
25667669 25667669_Ser Serum qRT-PCR 42 26 1
25152461 25152461_Ser Serum microRNA microarray/qRT-PCR 30 38 2
24827165 24827165_Pla Plasma qRT-PCR 7 7 1
24827165_Ser Serum qRT-PCR 7 7 1
24577456 24577456_Ser Serum RNA deep-sequencing/qRT-PCR 155 158 6
24550773 24550773_Pla Plasma qRT-PCR 27 25 1
24550773_PBMC Peripheral blood qRT-PCR 27 25 1
mononuclear cells
24157723 24157723_Pla Plasma qRT-PCR 10 10 2
24139697 24139697_Ser Serum qRT-PCR 155 105 1 2
24064186 24064186_ Monocytes qRT-PCR 37 34 1
PBMC_Mon
24064186_ Lymphocytes qRT-PCR 37 34 1
PBMC_Lym
23922807 23922807_Pla_ Plasma microRNA microarray/qRT-PCR 17 20 6
C2
23895045 23895045_WB Whole blood RNA deep-sequencing/qRT-PCR 21 94 5 7
23435408 23435408_PBMC Peripheral blood qRT-PCR 25 28 1
mononuclear cells
22155483 22155483_Ser Serum qRT-PCR 7 7 5
19936094 19936094_PBMC Peripheral blood microRNA microarray/qRT-PCR 5 5 2
mononuclear cells
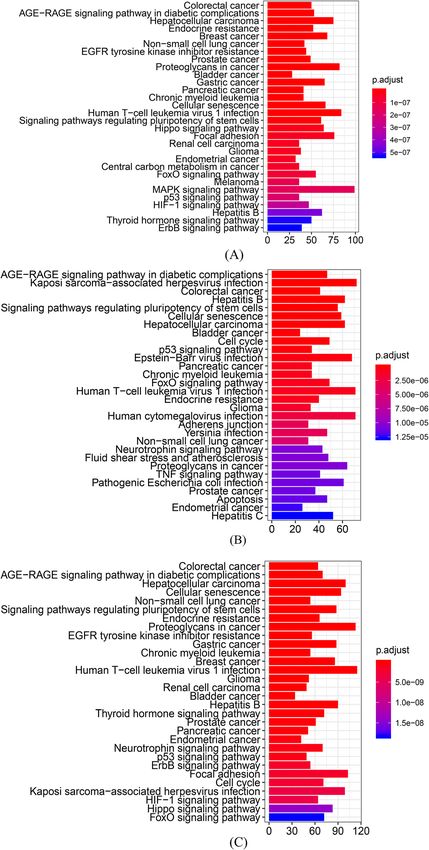
containing inositol phosphatase and RAC-beta serine/ results, respectively (Additional file 3). These target
threonine-protein kinase, respectively, to attenuate NF- genes were subjected to two independent enrichment
κB-dependent inflammation [111, 112]. Additionally, analyses based on KEGG to obtain the functional anno-
miR-495 targets NOD1, which encodes nucleotide- tations of the DEmiRNAs (Fig. 3A, B). Most pathways
binding oligomerization domain-containing protein 1, to targeted by the meta-analysis and ABMDA DEmiRNAs
reduce high glucose-induced inflammation in diabetic were commonly found in the two independent enrich-
complications [113], whereas its mature form, miR-495- ment analyses, even though the DEmiRNAs in the two
3p, has recently been reported to regulate inflammatory categories were not identical. This indicated that mul-
molecules by targeting IL5RA [114]. The mature forms tiple DEmiRNAs target either common or different
of miR-128-2, let-7a-2, miR-103a-2, and miR-16-2 have mRNA transcripts that functionally converge on the
not been reported in the miRBase database at the time same pathways. Most dysregulated pathways in the en-
of this study; however, their family members exhibit in- richment analysis were involved in AD development via
flammatory properties. MiR-128 and let-7a regulate gene modulation of neuroinflammation, including the AGE-
expression in response to oxidative stress [115, 116]. RAGE signaling pathway in diabetic complications, cell
MiR-16 and miR-103-3p target ADORA2A and SNRK, cycle, cellular senescence, Hippo signaling pathway, and
which encode the adenosine A2a receptor and sucrose FoxO signaling pathways. In addition, multiple cancer-
non-fermentable-related serine/threonine-protein kinase, ous pathways were also implicated. Compared with the
respectively, to attenuate NF-κB-dependent inflamma- two independent enrichment analyses, the synergic en-
tion [117, 118]. Current literature suggests that NF-κB richment analysis unifying the two categories of DEmiR-
might be the main downstream effector for the DEmiR- NAs might provide better insight for AD development.
NAs identified by ABMDA in the present study. In the synergic enrichment analysis, the dysregulated
pathways were more statistically significant (Fig. 3C).
Enrichment analysis Also, the pathways that were found in only one inde-
There were 3496 and 2938 target genes in total for 18 pendent enrichment analysis (such as the Hippo signal-
and 10 DEmiRNAs from the meta-analysis and ABMDA ing pathway from the meta-analysis and cell cycle fromYuen et al. Alzheimer's Research & Therapy (2021) 13:126 Page 10 of 30
Table 2 DEmiRNAs reported by the included differential miRNA expression studies. The bold DEmiRNAs were reported by at least
two independent comparisons and were qualified for the subsequent meta-analysis
Comparison ID MiRNAs Dysregulated direction P value
31857133_Ser miR-193a-3p Down < 0.001
31811079_Ser miR-346 Up 0.0013
miR-345-5p Up 0.0239
miR-122-3p Up 0.0001
miR-1291 Up 0.0052
miR-640 Up 0.0004
miR-650 Up 0.0035
miR-1285-3p Up 0.0032
miR-1299 Up 0.0003
miR-1267 Up 0.0055
miR-208b-3p Down 0.0006
miR-206 Down 0.0004
31849573_Pla miR-132-3p Down 0.0333
miR-212-3p Down 0.001
31809862_WB miR-532-5p Up 4.8 × 10E−30
miR-1468-5p Down 6.2 × 10E−12
31766231_Pla miR-206 Up < 0.025
31691877_Ser miR-22-5p Up ≤ 0.005
miR-23a-3p Up ≤ 0.05
miR-29a-3p Up ≤ 0.05
miR-125b-5p Up ≤ 0.005
31592314_Pla miR-451a Down < 0.0005
miR-21-5p Down < 0.005
miR-23a-3p Down < 0.005
let-7i-5p Down < 0.05
miR-126-3p Down < 0.005
miR-151a-3p Down < 0.05
31572518_Ser miR-133b Down < 0.001
31420923_Pla miR-103a-3p Down < 0.001
miR-107 Down < 0.001
31092279_Pla miR-92a-3p Up 0.0442
miR-181c-5p Up 0.0024
miR-210-3p Up 0.0006
30914454_Pla miR-101-3p Down < 0.001
miR-153-3p Down < 0.001
miR-144-3p Down < 0.001
miR-381-3p Down < 0.001
miR-383-5p Down < 0.001
30328325_Pla miR-128-3p Up < 0.05
29966198_Pla miR-146a-5p Up < 0.05
miR-933 Up < 0.05
29746584_Ser miR-103a-3p Up < 0.05
miR-142-3p Up < 0.05Yuen et al. Alzheimer's Research & Therapy (2021) 13:126 Page 11 of 30
Table 2 DEmiRNAs reported by the included differential miRNA expression studies. The bold DEmiRNAs were reported by at least
two independent comparisons and were qualified for the subsequent meta-analysis (Continued)
Comparison ID MiRNAs Dysregulated direction P value
miR-20a-5p Up < 0.05
miR-29b-3p Up < 0.05
let-7b-5p Up < 0.05
let-7 g-5p Up < 0.05
miR-106a-5p Up < 0.05
miR-106b-5p Up < 0.05
miR-18b-5p Up < 0.05
miR-223-3p Up < 0.05
miR-26a-5p Up < 0.05
miR-26b-5p Up < 0.05
miR-301a-3p Up < 0.05
miR-30b-5p Up < 0.05
miR-132-3p Down < 0.05
miR-146a-5p Down < 0.05
miR-15a-5p Down < 0.05
miR-22-3p Down < 0.05
miR-320a-3p Down < 0.05
miR-320b Down < 0.05
miR-92a-3p Down < 0.05
miR-1246 Down < 0.05
29635818_Pla miR-1908-5p Up < 0.05
29606187_Ser miR-135a-5p Up < 0.05
miR-193b-3p Down < 0.01
miR-384 Up < 0.05
29036829_WB miR-144-5p Down 0.03
miR-374a-5p Down 0.034
miR-221-3p Down 0.042
29036818_Ser_Mild miR-106b-3p Up < 0.001
miR-26a-5p Down < 0.001
miR-181c-3p Down < 0.001
miR-126-5p Down < 0.001
miR-22-3p Down < 0.001
miR-148b-5p Down < 0.001
29036818_Ser_Mod miR-106b-3p Up < 0.001
miR-1246 Up < 0.001
miR-26a-5p Down < 0.001
miR-181c-3p Down < 0.001
miR-126-5p Down < 0.001
miR-22-3p Down < 0.001
miR-148b-5p Down < 0.001
29036818_Ser_Sev miR-106b-3p Up < 0.001
miR-1246 Up < 0.001
miR-660-5p Up < 0.001Yuen et al. Alzheimer's Research & Therapy (2021) 13:126 Page 12 of 30
Table 2 DEmiRNAs reported by the included differential miRNA expression studies. The bold DEmiRNAs were reported by at least
two independent comparisons and were qualified for the subsequent meta-analysis (Continued)
Comparison ID MiRNAs Dysregulated direction P value
miR-26a-5p Down 0.007
miR-181c-3p Down < 0.001
miR-126-5p Down < 0.001
miR-22-3p Down < 0.001
miR-148b-5p Down < 0.001
28934394_Ser miR-455-3p Up 0.007
28849039_Ser_Mil miR-222-3p Down < 0.05
28849039_Ser_Mod miR-222-3p Down < 0.05
28626163_Ser miR-146a-5p Up < 0.05
miR-106b-3p Up < 0.05
miR-195-5p Up < 0.05
miR-20b-5p Up < 0.05
miR-497-5p Up < 0.05
miR-29c-3p Down < 0.05
miR-93-5p Down < 0.05
miR-19b-3p Down < 0.05
miR-125b-3p Down < 0.05
28179587_Pla_AD2 miR-486-5p Up < 0.001
miR-483-5p Up < 0.0001
miR-502-3p Up < 0.0001
miR-200a-3p Up < 0.01
miR-151a-5p Down < 0.001
miR-30b-5p Down < 0.01
miR-103a-3p Down < 0.01
28179587_Pla_MCI-AD2 miR-486-5p Up < 0.001
miR-483-5p Up < 0.001
miR-502-3p Up < 0.01
miR-200a-3p Up < 0.05
28137310_Ser miR-501-3p Down 0.002
27545218_Ser miR-613 Up < 0.01
27501295_WB miR-9-5p Down 0.001
miR-106a-5p Down 0.001
miR-106b-5p Down 0.008
miR-107 Down 0.001
27446280_WB miR-135b-5p Down < 0.01
27277332_WB miR-206 Up < 0.001
27239545_PBMC miR-27b-3p Up < 0.05
miR-128-3p Up < 0.05
miR-155-5p Up < 0.05
27027823_Ser miR-125b-5p Down < 0.001
miR-223-3p Down < 0.001
miR-29 Down < 0.01
miR-519 Up < 0.001Yuen et al. Alzheimer's Research & Therapy (2021) 13:126 Page 13 of 30
Table 2 DEmiRNAs reported by the included differential miRNA expression studies. The bold DEmiRNAs were reported by at least
two independent comparisons and were qualified for the subsequent meta-analysis (Continued)
Comparison ID MiRNAs Dysregulated direction P value
26973465_Pla miR-10b-5p Down 0.022
miR-29a-3p Down 0.041
miR-130b-3p Down 0.002
26497032_PBMC miR-425-5p Up < 0.001
miR-339-5p Up 0.003
miR-639 Down 0.04
26078483_Ser miR-31-5p Down < 0.0001
miR-93-5p Down < 0.0001
miR-143-3p Down < 0.0001
miR-146a-5p Down < 0.0001
25955795_WB miR-29c-3p Down 0.0001
25742200_Pla miR-107 Down < 0.001
25667669_Ser miR-210-3p Down < 0.01
25152461_Ser miR-135a-5p Down < 0.05
miR-200b-3p Down < 0.05
24827165_Pla miR-384 Down < 0.05
24827165_Ser miR-384 Down < 0.05
24577456_Ser miR-98-5p Down 2.67 × 10E−4
miR-885-5p Down 2.8 × 10E−4
miR-483-3p Down 1.0 × 10E−4
miR-342-3p Down 9.19 × 10E−16
miR-191-5p Down 1.54 × 10E−9
let-7d-5p Down 1.2 × 10E−6
24550773_Pla miR-34c-5p Up < 0.01
24550773_PBMC miR-34c-5p Up < 0.01
24157723_Pla miR-34a-5p Down < 0.05
miR-146a-5p Down < 0.05
24139697_Ser miR-125b-5p Down < 0.0001
miR-181c-5p Down < 0.0001
miR-9-5p Up 0.0045
24064186_PBMC_Mon miR-128-3p Up < 0.05
24064186_PBMC_Lym miR-128-3p Up < 0.05
23922807_Pla_C2 let-7d-5p Down 0.0001
let-7 g-5p Down 0.001
miR-15b-5p Down 0.001
miR-142-3p Down 0.0001
miR-191-5p Down 0.002
miR-545-3p Down 0.03
23895045_WB miR-151a-3p Up < 0.05
let-7d-3p Up < 0.05
miR-5010-3p Up < 0.05
let-7f-5p Down < 0.05
miR-1285-5p Down < 0.05Yuen et al. Alzheimer's Research & Therapy (2021) 13:126 Page 14 of 30
Table 2 DEmiRNAs reported by the included differential miRNA expression studies. The bold DEmiRNAs were reported by at least
two independent comparisons and were qualified for the subsequent meta-analysis (Continued)
Comparison ID MiRNAs Dysregulated direction P value
miR-107 Down < 0.05
miR-103a-3p Down < 0.05
miR-26b-5p Down < 0.05
miR-26a-5p Down < 0.05
miR-532-5p Down < 0.05
23435408_PBMC miR-29b-3p Down 0.002
22155483_Ser miR-137-3p Down < 0.05
miR-181c-5p Down < 0.05
miR-9-5p Down < 0.05
miR-29a-3p Down < 0.05
miR-29b-3p Down < 0.05
19936094_PBMC miR-34a-5p Up < 0.05
miR-181b-5p Up < 0.05
ABMDA) were both statistically significant in the syner- and dysregulating the Hippo and FoxO signaling path-
gic enrichment analysis. The synergic enrichment ana- ways. Cellular senescence is a permanent state of cellular
lysis suggested that the two DEmiRNA categories rest that is involved in the onset of AD [132], and neuro-
interact functionally and complement each other. inflammation and Aβ-mediated toxicity have been
In the synergic enrichment analysis, the AGE-RAGE reported to upregulate senescence-regulated genes [133–
signaling pathway in diabetic complications was identi- 135]. The Hippo signaling pathway is a kinase cascade
fied as the second most statistically significant. The relevant for cellular homeostasis, and is upregulated by
AGE-RAGE pathway is involved in diabetic microvascu- Aβ-mediated neurotoxicity to enhance neurodegenera-
lar complications. Elevated levels of AGE and RAGE tion with JNK in AD [136, 137]. The FoxO signaling
have also been reported in AD patients, and increased pathway is involved in the relationship between ROS, in-
RAGE activity has been detected in patients with early sulin resistance, and AD pathology [138, 139]. Under
AD symptoms [119, 120]. RAGE also interacts with Aβ persistent oxidative stress, the FoxO signaling pathway
oligomers to induce BBB leakage [121] and upregulates increases the transcription of apoptotic proteins [140].
NF-κB, which induces neuroinflammation [122]. Ele-
vated neuroinflammation increases the expression of Network
secretases for Aβ production [123], reduces Aβ degrad- In total, 5222 target genes were identified for the
ation in microglia [124], and induces the aberrant hyper- DEmiRNAs from the meta-analysis and ABMDA, and
phosphorylation of tau proteins [125]. Elevated levels of 1865 target genes with semantic similarity over 0.95
proinflammatory cytokines and Aβ increase cell cycle- were identified as common target genes in the two
related kinases, such as PKA, CAMKII, Fyn, and DEmiRNA categories, suggesting an overlap of the two
mTORC1, inducing neuronal cell cycle re-entry (CCR) categories in biological functions. The common target
[126, 127]. Aberrant CCR results in neuronal hyper- genes were used to retrieve the corresponding protein–
ploidy, which alters neuronal circuit function and re- protein interactions according to STRING and construct
duces synaptic activity [128, 129], ultimately inducing a network. The network comprised 1865 common target
neuronal death [130]. Aberrant CCR is also induced by genes as nodes, and 18750 edges among the common
malfunction of PI3K/AKT/mTOR, a cell survival path- target genes. The DEmiRNAs let-7b-5p and miR-155
way disrupted in both AD and cancer, though in oppos- identified by ABMDA shared the most common target
ite directions [131]. Further, aberrant CCR is a causative genes with the DEmiRNAs miR-93-5p and miR-128-3p
factor for the majority of neuronal death in early AD de- identified by the meta-analysis. The common target
velopment and might be a potential biological mechan- genes UBC, UBB, and RPS27A, which are core members
ism to link AD and multiple cancerous diseases. in the ubiquitin-proteasome system (UPS), exhibited the
Aberrant Aβ accumulation and proinflammatory cyto- highest connection degree in the network.
kines from dying neurons further enhance neuroinflam- The UPS is imperative not just in Aβ clearance [141],
mation and oxidative stress, inducing cellular senescence but also in neuroinflammation and neuronal CCR. TheYuen et al. Alzheimer's Research & Therapy (2021) 13:126 Page 15 of 30
Table 3 Statistically significant DEmiRNAs identified by the meta-analysis
MiRNAs Comparison ID Number of Number of Number of Weight P value FDR LogOR 95% CI τ^2 I^2
upregulated downregulated control case
case in AD case in AD
miR-107 27501295_WB 172 109 25.08% 3.74E−25 1.61E−23 − 10.40 [− 12.36 , − 8.43] 0.00 0.00%
25742200_Pla 97 81 25.03%
23895045_WB 94 21 24.82%
31420923_Pla 120 120 25.07%
miR-106b-3p 29036818_Ser_Mild 31 86 24.98% 1.05E−20 1.53E−19 9.38 [7.41 , 11.35] 0.00 0.00%
29036818_Ser_Mod 52 86 25.06%
29036818_Ser_Sev 38 86 25.01%
28626163_Ser 45 40 24.96%
miR-22-3p 29036818_Ser_Mild 31 86 24.98% 1.07E−20 1.53E−19 − 9.38 [− 11.34 , − 7.41] 0.00 0.00%
29036818_Ser_Mod 52 86 25.06%
29036818_Ser_Sev 38 86 25.01%
29746584_Ser 47 38 24.95%
miR-126-5p 29036818_Ser_Mild 31 86 33.28% 2.06E−16 1.48E−15 − 9.53 [− 11.81 , − 7.26] 0.00 0.00%
29036818_Ser_Mod 52 86 33.39%
29036818_Ser_Sev 38 86 33.33%
miR-148b-5p 29036818_Ser_Mild 31 86 33.28% 2.06E−16 1.48E−15 − 9.53 [− 11.81 , − 7.26] 0.00 0.00%
29036818_Ser_Mod 52 86 33.39%
29036818_Ser_Sev 38 86 33.33%
miR-181c-3p 29036818_Ser_Mild 31 86 33.28% 2.06E−16 1.48E−15 − 9.53 [− 11.81 , − 7.26] 0.00 0.00%
29036818_Ser_Mod 52 86 33.39%
29036818_Ser_Sev 38 86 33.33%
miR-128-3p 27239545_PBMC 30 30 25.02% 4.64E−16 2.85E−15 8.19 [6.21 , 10.17] 0.00 0.00%
24064186_PBMC_Mon 34 37 25.08%
24064186_PBMC_Lym 34 37 25.08%
30328325_Pla 20 20 24.82%
miR-93-5p 26078483_Ser 79 75 50.13% 2.3E−11 1.24E−10 − 9.50 [− 12.28 , − 6.71] 0.00 0.00%
28626163_Ser 45 40 49.87%
miR-29c-3p 25955795_WB 30 30 49.88% 1.81E−09 8.65E−09 − 8.56 [− 11.36 , − 5.77] 0.00 0.00%
28626163_Ser 45 40 50.12%
miR-132-3p 29746584_Ser 47 38 50.28% 6.67E−09 2.87E−08 − 8.27 [− 11.07 , − 5.48] 0.00 0.00%
31849573_Pla 16 31 49.72%
miR-222-3p 28849039_Ser_Mil 30 30 50.00% 8.09E−09 3.16E−08 − 8.22 [− 11.02 , − 5.43] 0.00 0.00%
28849039_Ser_Mod 30 30 50.00%
miR-34c-5p 24550773_Pla 25 27 50.00% 2.67E−08 9.58E−08 7.94 [5.14 , 10.74] 0.00 0.00%
24550773_PBMC 25 27 50.00%
let-7d-5p 23922807_Pla_C2 20 17 49.74% 8.9E−06 2.73E−05 − 9.39 [− 13.54 , − 5.25] 4.89 54.62%
24577456_Ser 158 155 50.26%
miR-191-5p 23922807_Pla_C2 20 17 49.74% 8.9E−06 2.73E−05 − 9.39 [− 13.54 , − 5.25] 4.89 54.62%
24577456_Ser 158 155 50.26%
miR-200a-3p 28179587_Pla_AD2 13 9 50.26% 3.37E−05 8.05E−05 6.01 [3.17 , 8.85] 0.00 0.00%
28179587_Pla_MCI-AD2 8 9 49.74%
miR-483-5p 28179587_Pla_AD2 13 9 50.26% 3.37E−05 8.05E−05 6.01 [3.17 , 8.85] 0.00 0.00%
28179587_Pla_MCI-AD2 8 9 49.74%
miR-486-5p 28179587_Pla_AD2 13 9 50.26% 3.37E−05 8.05E−05 6.01 [3.17 , 8.85] 0.00 0.00%
28179587_Pla_MCI-AD2 8 9 49.74%
miR-502-3p 28179587_Pla_AD2 13 9 50.26% 3.37E−05 8.05E−05 6.01 [3.17 , 8.85] 0.00 0.00%
28179587_Pla_MCI-AD2 8 9 49.74%Table 4 Statistically significant DEmiRNAs identified by the meta-analysis in subgroup analysis
Blood elements miRNA Comparison ID Number of Number of Number of Weight P value FDR LogOR 95% CI τ^2 I^2
upregulated downregulated control case
case in AD case in AD
Whole blood miR-107 27501295_WB 172 109 50.26% 1.03E−12 2.06E−12 − 10.12 [− 12.91, − 7.34] 0.00 0.00%
23895045_WB 94 21 49.74%
Plasma miR-103a-3p 28179587_Pla_AD2 13 9 49.64% 0.000266 0.00031 − 8.62 [− 13.26, − 3.99] 7.09 63.36%
31420923_Pla 120 120 50.36%
miR-107 25742200_Pla 97 81 49.96% 5.26E−14 3.68E−13 − 10.67 [− 13.45, − 7.89] 0.00 0.00%
31420923_Pla 120 120 50.04%
miR-200a-3p 28179587_Pla_AD2 13 9 50.26% 3.37E−05 4.72E−05 6.01 [3.17, 8.85] 0.00 0.00%
Yuen et al. Alzheimer's Research & Therapy
28179587_Pla_MCI-AD2 8 9 49.74%
miR-483-5p 28179587_Pla_AD2 13 9 50.26% 3.37E−05 4.72E−05 6.01 [3.17, 8.85] 0.00 0.00%
28179587_Pla_MCI-AD2 8 9 49.74%
miR-486-5p 28179587_Pla_AD2 13 9 50.26% 3.37E−05 4.72E−05 6.01 [3.17, 8.85] 0.00 0.00%
(2021) 13:126
28179587_Pla_MCI-AD2 8 9 49.74%
miR-502-3p 28179587_Pla_AD2 13 9 50.26% 3.37E−05 4.72E−05 6.01 [3.17, 8.85] 0.00 0.00%
28179587_Pla_MCI-AD2 8 9 49.74%
Serum miR-106b-3p 29036818_Ser_Mild 31 86 24.98% 1.05E−20 9.08E−20 9.38 [7.41, 11.35] 0.00 0.00%
29036818_Ser_Mod 52 86 25.06%
29036818_Ser_Sev 38 86 25.01%
28626163_Ser 45 40 24.96%
miR-126-5p 29036818_Ser_Mild 31 86 33.28% 2.06E−16 7.01E−16 − 9.53 [− 11.81, − 7.26] 0.00 0.00%
29036818_Ser_Mod 52 86 33.39%
29036818_Ser_Sev 38 86 33.33%
miR-148b-5p 29036818_Ser_Mild 31 86 33.28% 2.06E−16 7.01E−16 − 9.53 [− 11.81, − 7.26] 0.00 0.00%
29036818_Ser_Mod 52 86 33.39%
29036818_Ser_Sev 38 86 33.33%
miR-181c-3p 29036818_Ser_Mild 31 86 33.28% 2.06E−16 7.01E−16 − 9.53 [− 11.81, − 7.26] 0.00 0.00%
29036818_Ser_Mod 52 86 33.39%
29036818_Ser_Sev 38 86 33.33%
miR-181c-5p 24139697_Ser 105 155 50.39% 0.00354 0.008598 − 8.28 [− 13.84, − 2.71] 11.96 74.29%
22155483_Ser 7 7 49.61%
miR-22-3p 29036818_Ser_Mild 31 86 24.98% 1.07E−20 9.08E−20 − 9.38 [− 11.34, − 7.41] 0.00 0.00%
29036818_Ser_Mod 52 86 25.06%
Page 16 of 30Table 4 Statistically significant DEmiRNAs identified by the meta-analysis in subgroup analysis (Continued)
Blood elements miRNA Comparison ID Number of Number of Number of Weight P value FDR LogOR 95% CI τ^2 I^2
upregulated downregulated control case
case in AD case in AD
29036818_Ser_Sev 38 86 25.01%
29746584_Ser 47 38 24.95%
miR-93-5p 26078483_Ser 79 75 50.13% 2.30E−11 6.53E−11 − 9.50 [− 12.28, − 6.71] 0.00 0.00%
28626163_Ser 45 40 49.87%
miR-222-3p 28849039_Ser_Mil 30 30 50.00% 8.09E−09 2.08E−08 − 8.22 [− 11.02, − 5.43] 0.00 0.00%
28849039_Ser_Mod 30 30 50.00%
PBMC miR-128-3p 27239545_PBMC 30 30 33.28% 3.94E−13 3.94E−13 8.44 [6.16, 10.72] 0.00 0.00%
Yuen et al. Alzheimer's Research & Therapy
24064186_PBMC_Mon 34 37 33.36%
24064186_PBMC_Lym 34 37 33.36%
(2021) 13:126
Page 17 of 30Yuen et al. Alzheimer's Research & Therapy (2021) 13:126 Page 18 of 30
Table 5 AD-related DEmiRNAs identified by ABMDA
Disease miRNAs Mature miRNAs Score Used as biomarkers in diseases
Alzheimer disease miR-339 miR-339-5p 9.45 Lung cancer
miR-128-2 8.92 Hepatocellular carcinoma
miR-203 miR-203a-3p 8.76
miR-495 miR-495-3p 8.75 Non-small cell lung cancer
miR-155 miR-155-5p 8.70 AD
let-7a-2 8.67 Lung cancer
miR-103a-2 8.10
miR-16-2 8.02 Breast cancer
let-7b let-7b-5p 7.93 Non-small cell lung cancer
miR-625 miR-625-5p 7.88 Malignant pleural mesothelioma
physiological function of the UPS can be adversely influ- Discussion
enced by neuroinflammation. Under neuroinflammation, There is a need for blood circulating biomarkers that can be
J2 prostaglandins are generated from prostaglandin D2, mass screened accurately and conveniently to identify high
which is the most abundant prostaglandin in the brain risk individuals of AD. The identification of DEmiRNAs as
[142]. J2 prostaglandins enhance the expression levels of biomarkers from differential miRNA expression studies has
COX2 to transition acute neuroinflammation to chronic been successful in cancers [146] and is thought to have po-
neuroinflammation and oxidize the UPS units to promote tential for AD. DEmiRNAs associated with AD pathology,
disassembly [143]. The impaired UPS induces ectopic ex- such as Aβ production and neuroinflammation, are poten-
pression of cell cycle-related genes and causes neuronal tially important biomarkers because the presence of Aβ and
CCR, as the metabolisms of cyclin and cyclin-dependent proinflammatory cytokines are considered to be key factors
kinases are dependent on the UPS. A recent study [144] for predicting whether patients with mild cognitive impair-
has reported that the dysregulation of an E3 ubiquitin lig- ment are progressing to AD [147–149]. In this study, we
ase, Itch, induces neuronal CCR in response to Aβ. Aβ- used a meta-analysis approach based on differential miRNA
induced JNK activation phosphorylates Itch to promote expression studies from blood to identify reliable miRNA–
the degradation of TAp73, which is important for protein AD associations. The associations were subsequently used
synthesis under oxidative stress, in neurons [145]. for the prediction of potential AD biomarkers using the
ABMDA ensemble learning method. We identified 28
DEmiRNAs (18 and 10 from meta-analysis and ABMDA,
Quality assessment of studies respectively) as potential AD biomarkers in blood.
The MIQE guideline was used to access the expression The DEmiRNAs identified with the meta-analysis in-
profiling analysis of the included studies. The results of volved in Aβ metabolism, including APP expression, Aβ-
the quality assessments were shown in Fig. 4. Among production enzyme regulation, and Aβ clearance, tau
the 47 expression profiling studies, miR-39 and U6 protein phosphorylation, and also contribute to neuronal
RNAs were frequently used as internal normalization function during AD progression, including pathogenic
controls for qRT-PCR. Around 85% of the included neuroinflammation, apoptosis, mitochondrial oxygen
studies provided sufficient information about data pro- chain activity, and neuronal microtubule maintenance.
cessing, including statistical analysis and quantification The meta-analytical results of DEmiRNAs mediate Aβ
methods. About 70% of the included studies provided synthesis via several targets, and some of them are also
sufficient information about sample annotation, but 16 involved in tau protein phosphorylation and neuronal
studies did not provide details of the storage or extrac- functions. MiR-107 is negatively correlated with BACE1
tion methods of serum or plasma. Approximately 60% of and ADAM10 expression and is downregulated in the
the included studies did not provide the number of rep- early stage of AD [150, 151]. The downregulation of
licates in the experimental design, and 77% did not pro- miR-107 also dysregulates the expression of CDK5R1,
vide the quantification cycle value in the actual data which is involved in neuronal survival [94]. Downregula-
processing. The parameters of qRT-PCR methods were tion of miR-181c dysregulates the expression of SPTLC1
missing in 14 studies. For the annotation of PCR, most [152], to increase Aβ deposition, and increases pro-
studies provided the full details of reference miRNAs for inflammatory cytokines [153]. MiR-22-3p and miR-29c
quantification, but primer information was missing in 19 also regulate Aβ deposition via targeting MAPK14 and
studies. BACE1, respectively [154, 155]. Besides Aβ synthesis, AβYou can also read


