Predicting Ethereum Prices Based on Blockchain Data
←
→
Page content transcription
If your browser does not render page correctly, please read the page content below
Predicting Ethereum Prices Based on Blockchain Data

                                           Neil Khemani
                                  Department of Computer Science
                                        Stanford University
                                    nkhemani@stanford.edu

                                              Abstract
         This project seeks to predict the price of ETH based on historical ETH prices and
         Ethereum blockchain data such as gas usage. What makes this project novel is that
         it attempts to identify phases in ETH price akin to EEG bands. Would detecting
         such phases improve ETH price prediction?

1   Introduction
Ethereum is a decentralized, open-source blockchain platform that features smart contract functional-
ity. It allows developers to create and deploy decentralized applications (DApps) on the Ethereum
blockchain, leveraging the platform’s advanced scripting capabilities and the security of its underlying
distributed ledger technology. Ethereum is often referred to as a “world computer” because it allows
anyone to run arbitrary code on its network, enabling the creation of a wide range of applications
from financial contracts and prediction markets to supply chain management and voting systems. The
platform also has its own built-in programming language, called Solidity, which allows developers to
easily write and deploy smart contracts. Ethereum is a critical component of the broader blockchain
ecosystem, and has helped to drive the development of a new generation of decentralized technologies.
Ether (ETH) is the native cryptocurrency of the Ethereum blockchain. It is the second-largest
cryptocurrency by market capitalization after Bitcoin. The price of ETH is considerably volatile. It is
imperative to understand what causes ETH price to fluctuate, as it has an impact on the financial lives
of countless people across the globe. A better understanding of ETH price movements could also
bolster public trust in cryptocurrencies, a significant goal especially after the recent collapse of the
FTX cryptocurrency exchange.
This project seeks to predict the minimum, average (mean), and maximum percent change in the
price of ETH over the next week based on historical ETH prices and market capitalization as well as
on Ethereum blockchain data about the daily average gas limit, daily average gas price, daily gas
used, and daily transaction fee. What makes this project novel is that it attempts to identify phases in
ETH price akin to EEG bands.

2   Related Work
Oyedele, et al., looks at the performance of a genetic algorithm-tuned Deep Learning (DL) model
and boosted tree-based techniques for predicting the closing prices of multiple cryptocurrencies. The
DL models used include Convolutional Neural Networks (CNN), Deep Forward Neural Networks,
and Gated Recurrent Units (GRU). The study compares the performance of these DL models with
boosted tree-based models on six cryptocurrency datasets from different sources. Their results show
that the CNN model has the lowest mean average percentage error (0.08) and produces the highest
and most consistent explained variance score (0.96 on average) compared to the other models.

CS230: Deep Learning, Winter 2018, Stanford University, CA. (LateX template borrowed from NIPS 2017.)
Alonso-Monsalve, et al., compared four neural network types–convolutional, hybrid CNN-LSTM,
multilayer perceptron, and radial basis function–to predict whether six cryptocurrencies (Bitcoin,
Dash, Ether, Litecoin, Monero, and Ripple) would increase in value over the next minute. All the
cryptocurrencies were somewhat predictable using 18 technical indicators. The convolutional LSTM
models performed the best, while the CNN models also provided good results. Unfortunately, the
study relied on a limited number of technical indicators, so the authors considered their results a
lower bound.
Patel, et al., looks at an LSTM and GRU-based hybrid cryptocurrency prediction scheme focusing on
Litecoin and Monero. Their proposed scheme predicted the prices with high accuracy.
In my literature review, it appears that none of the studies considered using phase detection of ETH
price as an input to a deep learning model. Additionally, none of the studies considered using data
points specific to Ethereum, such as gas usage, gas limits, transaction fees, and gas prices, as inputs to
the model. This is a potential area for further research, as incorporating these factors into the model
could potentially improve its performance in predicting the price of ETH.

3     Dataset

The dataset for this project includes the last 7 years (from Friday, August 7, 2015 12:00:00 AM (GMT)
to Sunday, November 13, 2022 12:00:00 AM (GMT)) of the following: the Ethereum blockchain’s
average gas limit, average gas price, network transaction fee, and total gas used; and ETH’s market
capitalization and price.
90% of the data will be used for the training set, and 10% will be used for the validation set. The
most recent data will be used in the validation set, as predicting prices in the present is the goal. This
dataset was obtained from etherscan.io.

4     Methods

The code can be found at https://github.com/nkmni/EthereumPriceNet.

4.1   Data Preprocessing

The 6 datasets (average gas limit, average gas price, network transaction fee, total gas used, market
capitalization, and price) were obtained from etherscan.io’s API in JSON format. To characterize
the phases in ETH price, the discrete Fourier transform (DFT) of 14-day windows of ETH price
was computed to use as an additional input to the model. The DFT of a 14-day sequence is 14-
dimensional, so with the 6 datasets, we have 20-dimensional feature vectors. 14-day sequences of
these 20-dimensional feature vectors were used as inputs to a deep LSTM model.
The goal is to predict percent change in ETH price over the 7 days following each 14-day sequence.
The minimum, mean, and maximum price over the 7 days following each 14-day sequence were used
to calculate 3 percent-changes that are used as the ground truth labels.

4.2   Hyperparameters

The metric used to evaluate the model is the mean absolute error (MAE). The loss function used is
the mean squared error (MSE).
The batch size settled on is 256, which allows training to run much faster than it would with smaller
batch sizes such as 32 or 64 on my Apple M1 GPU. The number of LSTM and Dense units was
varied between 128, 256, 512, and 1024. L2 regularization was used instead of Dropout because I
didn’t think it made sense to eliminate random subsets of a DFT; this isn’t computer vision. Models
were trained in spurts of 500 epochs; the learning rate was decreased from 0.0001 to 0.00001 after a
spurt in which the loss didn’t seem to decrease significantly.

                                                    2
4.3 Models
The baseline model had an input layer, batch normalization layer, LSTM layer, and Dense output
layer, as shown in figure 1.
Figure 1: Baseline model
Many architectures were experimented with and the final model had an input layer, batch normaliza-
tion layer, 2 LSTM layers, a Dense layer with tanh activation function, and a Dense output layer, as
shown in figure 2.
5 Results/Discussion
The correlation coefficient between the actual prices and the predicted prices was used to determine
the quality of each model. The correlation coefficient is a better metric to look at over just the MSE
as the model could sometimes achieve a low MSE despite being uncorrelated with the actual percent
changes.
The baseline model after 2000 epochs achieved a training set MSE of 0.4816, training set MAE of
0.3274, validation set MSE of 0.6506, and validation set MAE of 0.4959. The correlation coefficients
between the predicted prices and the actual validation set prices for the minimum, average, and
maximum labels were -0.2219, 0.1178, and 0.1593, demonstrating poor ability to predict the direction
of the price changes for the validation set.
The final model after 1000 epochs achieved a training set MSE of 0.8616, training set MAE of 0.3149,
validation set MSE of 0.9102, and validation set MAE of 0.3927. It achieved validation set correlation
coefficients (for minimum, mean, and maximum, respectively) of 0.193, 0.3884, and 0.453. Even
though the final model’s training set MSE was greater than the baseline model’s, it had a slightly
lower training set MAE. Similarly, the final model’s validation set MSE was greater than the baseline
model’s, but it had a significantly lower MAE. As for the correlation coefficients, the final model
clearly outperformed the baseline model.
Using 1024 units instead of 512 units in the Dense layer before the output layer in the final model
resulted in overfitting to the training set and poor performance on the validation set. After 2500
epochs with 1024 units, the model achieved a training set MSE of 0.2506, training set MAE of
0.2104, validation set MSE of 2.117, and validation set MAE of 0.9564. It’s validation set correlation
coefficients were -0.228, -0.4446, and -0.4855, demonstrating not only poor MSE/MAE on the
validation set but also poor correlation.
3Figure 2: Final model
6 Conclusion
Unlike in some previous studies that found that LSTM models were not able to predict cryptocurrency
prices accurately, this study has found that with blockchain data and the DFT of the price data, a deep
LSTM model can indeed predict ETH price fluctuations with a decent correlation and low MAE.
Future work could look at varying some hyperparameters that were not really tuned much in this
study, such as the DFT price window length, the input sequence length, and the train split.
7 References
Oyedele, Azeez A., et al. “Performance Evaluation of Deep Learning and Boosted Trees for
Cryptocurrency Closing Price Prediction.” Expert Systems with Applications, vol. 213, Mar. 2023, p.
119233. ScienceDirect, https://doi.org/10.1016/j.eswa.2022.119233.
Alonso-Monsalve, Saúl, et al. “Convolution on Neural Networks for High-Frequency Trend Prediction
of Cryptocurrency Exchange Rates Using Technical Indicators.” Expert Systems with Applications,
vol. 149, July 2020, p. 113250. ScienceDirect, https://doi.org/10.1016/j.eswa.2020.113250.
Patel, Mohil Maheshkumar, et al. “A Deep Learning-Based Cryptocurrency Price Prediction Scheme
for Financial Institutions.” Journal of Information Security and Applications, vol. 55, Dec. 2020, p.
102583. ScienceDirect, https://doi.org/10.1016/j.jisa.2020.102583.
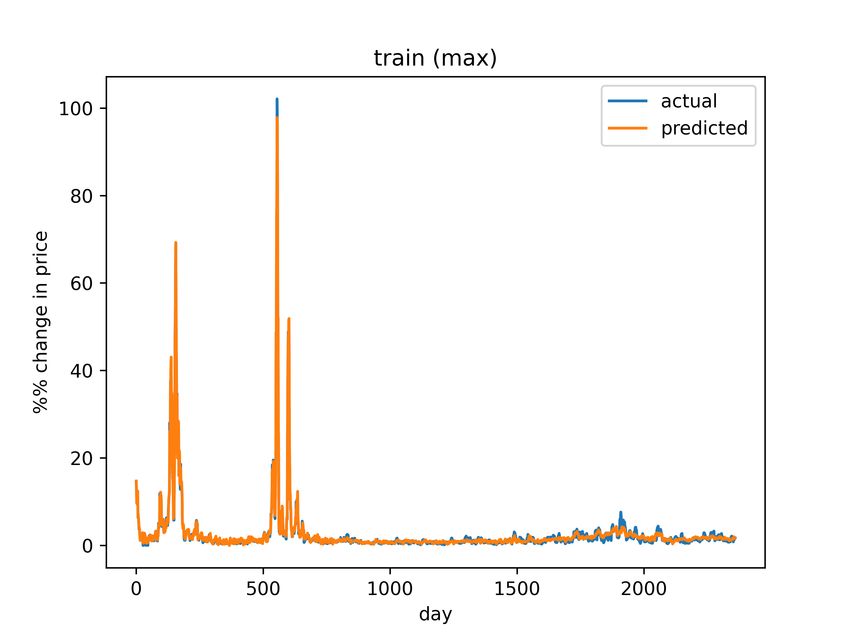
4Figure 3: Final model training set predictions (maximum)
Figure 4: Final model validation set predictions (maximum)
5You can also read