Pocket Guide to Transportation 2023 - Free Copy - Not Meant for Sale - ROSA P
←
→
Page content transcription
If your browser does not render page correctly, please read the page content below

Pocket Guide to
Transportation
2023

 Free Copy - Not Meant for Sale

https://www.bts.gov/pocketguide

For additional copies of this guide or information about the
Bureau of Transportation Statistics and its products and
services, contact:

https://doi.org/10.21949/1527467

Product Orders
Internet: www.bts.gov

Mail:      Product Orders
           Bureau of Transportation Statistics
           ATTN: Product Orders
           1200 New Jersey Avenue, SE, Room
           E34-457
           Washington, DC 20590

Information Service
Phone: 202-366-DATA
Email:     bts@dot.gov

January 2023

Free Copy - Not Meant for Sale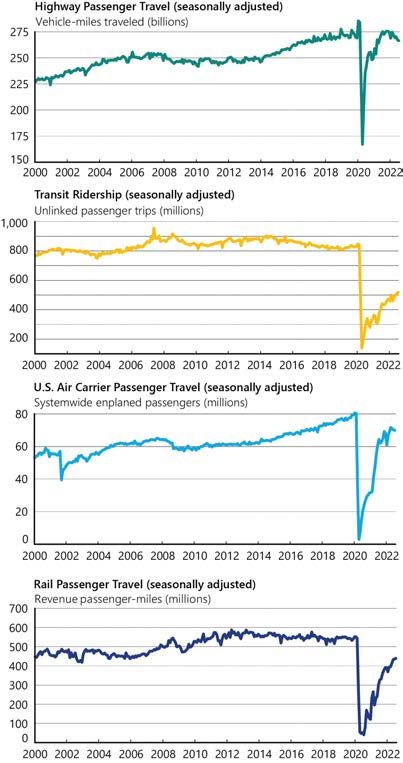
Pocket Guide to
Transportation
2023

  Free Copy - Not Meant for Sale
Acknowledgments
U.S. Department of           Produced under the
Transportation               direction of:
Robert C. Hampshire, PhD     Ramond Robinson
Deputy Assistant Secretary   Director, Office of
for Research and             Transportation Analysis
Technology
                             Sean Jahanmir
Bureau of                    Project Manager
Transportation
Statistics
Patricia Hu                  Alpha Wingfield
Director                     Visual Information
                             Specialist

Rolf Schmitt
                             Major Contributors:
Deputy Director
                             Daniel Palumbo*
                             Hoa Thai*

                             *Spatial Front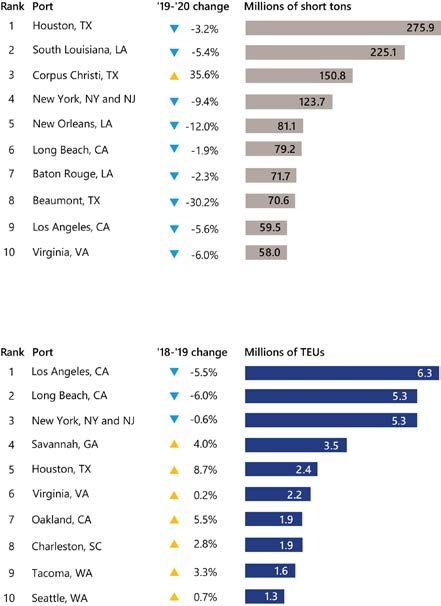
About the
Pocket Guide to Transportation
The BTS Pocket Guide to Transportation is a quick
reference guide that provides transportation
statistics at your fingertips. It provides key
information and highlights major trends on the
U.S. transportation system. Intended as a compact
reference, the Pocket Guide supports the BTS
mission to create, manage, and share transportation
statistical knowledge.
Many of the tables and figures within this
publication are derived from National Transportation
Statistics available at www.bts.gov. The Pocket Guide
is also available online at https://www.bts.gov/
pocketguide.

Contents
Major Trends............................................................iv
Infrastructure............................................................ 1
Moving People .........................................................7
Moving Goods........................................................19
Safety....................................................................... 27
Performance .......................................................... 35
Economy ..................................................................41
Environment .......................................................... 49
Glossary .................................................................. 58
Major Trends
Moving People: January 2000–July 2022

NOTES: Graph scales are not comparable. Seasonally-adjusted data measure
the real differences in data trends by adjusting for seasonal factors, such as
the change in the number of days, weekends, holidays, or other seasonal
activity in a month such as vacation travel.
SOURCE: Seasonally-adjusted transportation data–U.S. Department of
Transportation, Bureau of Transportation Statistics, available at www.bts.gov as
of October 2022.

                                       iv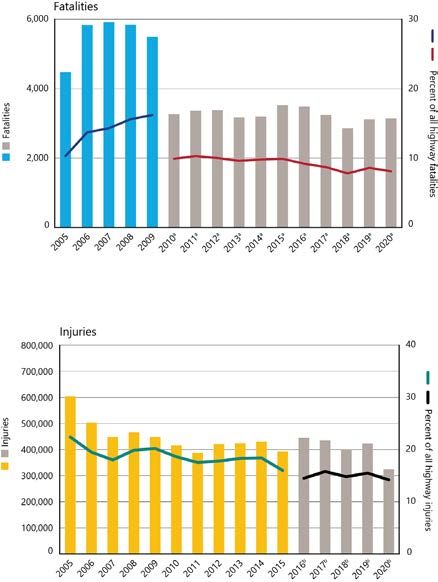
Major Trends
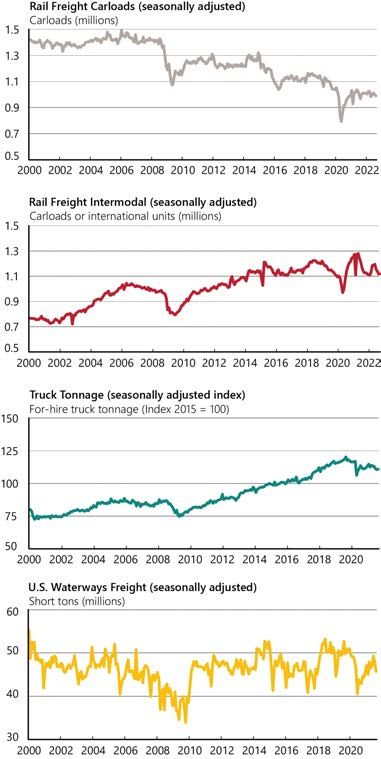
Moving Freight: January 2000–August 2022
NOTES: Graph scales are not comparable. Rail freight intermodal–Rail inter-
modal traffic includes shipping containers and truck trailers moved on rail cars.
U.S. waterways freight–Includes tonnage carried on internal U.S. waterways.
SOURCE: Seasonally-adjusted transportation data–U.S. Department of
Transportation, Bureau of Transportation Statistics, available at www.bts.gov as
October 2022.
v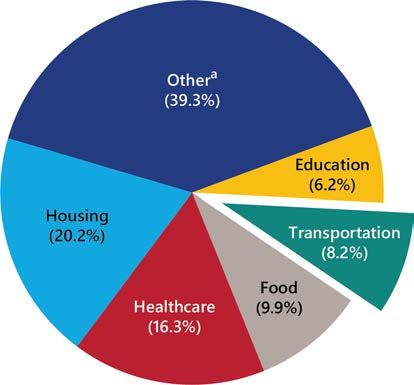
1               Infrastructure

T  he U.S. transportation system consists of a network
   of roads, bridges, airports, railroads, transit
systems, ports, waterways, and pipelines, connecting
the nation to the rest of the world.

    1-1        Transportation Network Length
               miles
    Mode                                             2010                 2020
    Highway
        Public roads                              4,067,077          4,172,562
        Public road lanesa                        8,582,261          8,790,746
    Pipeline
        Gas distribution                          1,229,946          1,328,885
        Gas transmission and gathering              324,458            319,224
    Rail
        Class I freight railroad                     95,700               91,773
        Amtrak                                       21,178               20,787
    Transit
        Commuter railb                                 7,630               7,930
                   b
        Heavy rail                                     1,617               1,663
        Light railb,c                                  1,497               2,096
    Water
        Navigable waterwaysd                         25,000               25,000
    a                         b                                       c
     Measured in lane-miles. Measured in directional route-miles. Light Rail
    was revised beginning in 2011 and includes light rail, street car rail, and
    hybrid rail. dEstimated length of domestic waterways.

    SOURCES: Highway, Pipeline, Rail, Transit, Water–As cited in U.S.
    Department of Transportation, Bureau of Transportation Statistics,
    National Transportation Statistics, tables 1-1, 1-6, and 1-10, available at
    https://www.bts.gov/nts as of October 2022.

                                                                Infrastructure     1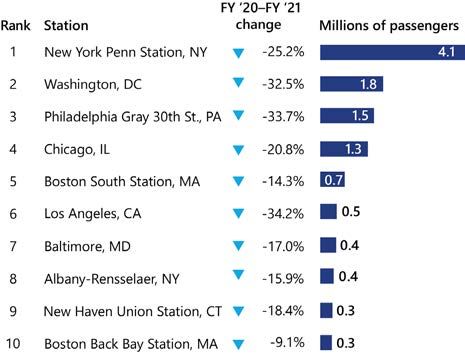
1-2          Transportation Facilities
                  number
     Mode                                          2010               2020
     Air
         Certificated airportsa                       551                 519
         General aviation airports                19,251              19,395
     Highway
         Bridges                                 604,493            618,456
     Pipeline
         LNG facilities                               122                 165
     Rail
         Amtrak stations                              512                 526
         Transit rail
         Commuter rail stations                     1,225              1,311
         Heavy rail stations                        1,041              1,057
         Light rail stationsb                         848              1,287
     Water
         Portsc                                       178                 192
         Cargo handling docks                       8,060              8,334
         Lock chambers                                239                 237
     a
      Certificated airports serve air carrier operations with aircrafts seating
     more than nine passengers. bLight Rail was revised beginning in 2011
     and includes light rail, street car rail, and hybrid rail. cPorts handling
     over 250,000 short tons.

     KEY: LNG = liquified natural gas

     SOURCES: Air, Highway, Rail–As cited in U.S. Department of Trans-
     portation, Bureau of Transportation Statistics, National Transportation
     Statistics, tables 1-3, 1-7, and 1-28, available at https://www.bts.gov/nts
     as of August 2022. Pipeline–U.S. Department of Transportation, Pipe-
     line and Hazardous Materials Administration, available at https://www.
     phmsa.dot.gov as of August 2022. Transit–U.S. Department of Trans-
     portation, National Transit Database, available at https://www.transit.
     dot.gov/ntd/ as of August 2022. Water–U.S. Army Corps of Engineers,
     Navigation Data Center, Transportation Facts and Information, available
     at http://www.navigationdatacenter.us/ as of August 2022.

2   Pocket Guide to Transportation
1-3 Transportation Vehicles
number
Mode 2010 2020
Air
Air carrier aircraft 7,185 5,882
General aviation aircraft 223,370 204,980
Highway
Light-duty vehiclea 230,444,440 253,121,228
Truck 10,770,054 13,479,382
Motorcycle 8,009,503 8,317,363
Rail
Class I freight locomotive 23,893 23,544
Class I freight car 397,730 252,400
Amtrak locomotive 282 384
Amtrak car 1,274 1,313
Transit rail
Commuter railb 6,768 7,524
Heavy railb 11,510 11,064
Light railb 2,096 2,799
Water
Nonself-propelled vessel 31,906 34,168
Self-propelled vessel 10,775 10,333
Oceangoing vessel 221 180
Recreational boat 12,438,926 11,838,188
a
Includes passenger cars, light trucks, vans, and sport utility vehicles. bIncludes
revenue vehicles available for maximum service.
SOURCE: As cited in U.S. Department of Transportation, Bureau of Transporta-
tion Statistics, National Transportation Statistics, table 1-11, available at https://
www.bts.gov/nts as of January 2022.
Infrastructure 31-4 Airport Runway Pavement Condition
percent of NPIAS runways
NOTE: National Plan of Integrated Airport Systems (NPIAS) airports include
commercial service airports, reliever airports, and selected general aviation
airports.
SOURCE: As cited in U.S. Department of Transportation, Bureau of Transportation
Statistics, National Transportation Statistics, table 1-25, available at https://www.
bts.gov/nts as of October 2022.
1-5 National Highway System Pavement
Condition
percent of NHS facility miles
NOTES: Pavement condition is measured by the International Roughness Index
(IRI) which takes a longitudinal profile of pavement roughness based on one-way
facility centerline miles. A lower IRI indicates smoother highway conditions and a
higher IRI indicates rougher highway conditions.
SOURCE: U.S. Department of Transportation, Federal Highway Administration,
Highway Statistics, table HM-47, available at https://www.fhwa.dot.gov/policyin-
formation/statistics.cfm as of November 2022.
4 Pocket Guide to Transportation1-6 Bridge Condition by Deck Area: 2012–2022
NOTE: The deck area calculation was changed as of 2018 in accordance with 23
CFR 490.409.
SOURCE: U.S. Department of Transportation, Federal Highway Administration,
National Bridge Inventory, available at https://www.fhwa.dot.gov/bridge/nbi.cfm
as of October 2022.
1-7 Condition of Highway Bridges by State: 2022
SOURCE: U.S. Department of Transportation, Federal Highway Administration,
National Bridge Inventory, available at https://www.fhwa.dot.gov/bridge/nbi.cfm
as of October 2022.
Infrastructure 52 Moving People
T he U.S. transportation system makes personal
mobility possible. Every day people use the
transportation system to get to and from work,
school, and shopping.
2-1 Vehicle-Miles Traveled
millions
Mode 2010 2020
Air
U.S. air carrier, domestica 5,976 4,214
Highway
Light-duty vehicleb 2,648,456 2,568,745
Motorcycle 18,513 17,632
Truck 286,527 302,141
Bus 13,770 15,104
Passenger rail
Amtrakc 295 185
c
Commuter rail 342 314
Heavy railc 666 663
Light rail c,d 93 120
a
Measured in revenue aircraft-miles. bIncludes passenger cars, light
trucks, vans, and sport utility vehicles. cMeasured in passenger car-
miles. dLight rail was revised beginning in 2011 and includes light
rail, street car rail, and hybrid rail.
SOURCE: As cited in U.S. Department of Transportation, Bureau of
Transportation Statistics, National Transportation Statistics, table
1-35, available at https://www.bts.gov/nts as of October 2022.
Moving People 72-2 Highway Travel: 1970–2020
NOTE: Data for 2007 and later years may not be comparable to previous years
due to changes in methodology.
SOURCE: U.S. Department of Transportation, Federal Highway Administration,
Highway Statistics, available at https://www.fhwa.dot.gov/policyinformation/
statistics.cfm as of October 2022.
8 Pocket Guide to Transportation2-3 Passenger-Miles Traveled
millions
Mode 2010 2020
Air
U.S. air carrier, domestic 554,711 304,253
Highway
Light-duty vehiclea 4,431,451 4,304,298
Motorcycle 21,483 21,237
Truck 286,527 302,141
Bus 270,344 306,843
Passenger rail
Amtrakb 6,420 3,450
Commuter rail 10,774 6,021
Heavy rail 16,407 8,947
c
Light rail 2,173 1,834
a
Includes passenger cars, light trucks, vans, and sport utility vehicles.
b
Measured in revenue passenger-miles. cLight rail was revised beginning
in 2011 and includes light rail, street car rail, and hybrid rail.
SOURCE: As cited in U.S. Department of Transportation, Bureau of Trans-
portation Statistics, National Transportation Statistics, table 1-40, available
at https://www.bts.gov/nts as of October 2022.
Moving People 92-4 Transit Ridership: 1970–2021
NOTE: Includes bus, commuter rail, demand response, heavy rail, light rail,
trolley bus, ferry boat, aerial tramway, automated guideway, cable car, inclined
plane, monorail, and other.
SOURCES: 1970-1989–American Public Transportation Association, Public Trans-
portation Fact Book, Appendix, available at https://www.apta.com/Pages/default.
aspx/ as of March 2020. 1990-2021–American Public Transportation Association,
Ridership Report, available at https://www.apta.com/research-technical-resources/
transit-statistics/ridership-report/ as of October 2022.
10 Pocket Guide to Transportation2-5 Daily Passenger Travel
2001 2009 2017a
Travel per person
Daily person trips 4.1 3.8 3.4
Daily person-miles 36.9 36.1 36.1
Travel per driver
Daily vehicle trips 3.4 3.0 2.7
Daily vehicle-miles of travel 32.7 29.0 25.8
Average commute
Length in miles 12.1 11.8 11.5
Travel time in minutes 23.3 23.9 26.6
Percent of work trips by usual mode
Private vehicles 90.8 89.4 87.5
Public transit b 5.1 5.1 6.9
Walk 2.8 2.8 2.9
Other c 1.3 2.7 2.7
a
The 2017 National Household Travel Survey includes a different methodology
compared to previous years, such as an address-based sample including more
urban and cell phone only households. bPublic transit includes local bus, com-
muter bus, commuter train, subway, trolley, and streetcar. cOther includes travel
modes not specifically cited, such as motorcycle, taxi, bike, truck, and other.
NOTE: The usual mode is defined as the means of transportation usually used
to go to work in the week prior to the travel day.
SOURCE: U.S. Department of Transportation, Federal Highway Administration,
2017 National Household Travel Survey, Summary of Travel Trends, available at
https://nhts.ornl.gov/ as of October 2022.
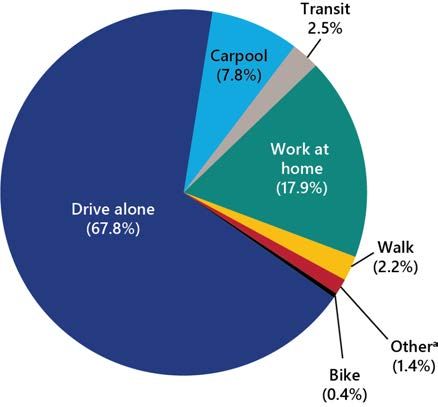
Moving People 112-6 Commute to Work Mode Share: 2021
percent of workers age 16 and older
a
Includes motorcycle, taxi, and other means.
NOTES: Percents may not add to 100 due to rounding. The American Commu-
nity Survey asks for the mode usually used by the respondent to get to work.
For more than one mode of transportation, respondents select the mode used
for most of the distance traveled.
SOURCE: As cited in U.S. Department of Transportation, Bureau of Transporta-
tion Statistics, National Transportation Statistics, table 1-41, available at www.
bts.gov as of October 2022.
12 Pocket Guide to Transportation2-7 Amtrak Ridership: FY2000–FY2021
SOURCE: U.S. Department of Transportation, Federal Railroad Administra-
tion, available at http://safetydata.fra.dot.gov/officeofsafety/default.aspx/ as
of October 2022.
2-8 Top 10 Amtrak Stations: FY2021
by passengers
NOTE: Includes passenger boardings and alightings.
SOURCE: Amtrak, National Fact Sheet and State Fact Sheet, available at www.amtrak.
com/home.html as of October 2022.
Moving People 132-9 U.S. Air Carrier Passenger Traffic:
2003–2021
NOTE: Includes passenger enplanements on scheduled services only (domestic
and international flights).
SOURCE: U.S. Department of Transportation, Bureau of Transportation Statis-
tics, Office of Airline Information, T-100 Market data, available at www.bts.gov
as of September 2022.
2-10 Top 10 U.S. Airports: 2021
by enplaned passengers
NOTE: Includes passenger enplanements on U.S. carrier scheduled domestic
and international service and foreign carrier scheduled international service to
and from the United States.
SOURCE: As cited in U.S. Department of Transportation, Bureau of Transporta-
tion Statistics, National Transportation Statistics, table 1-44, available at https://
www.bts.gov/nts as of October 2022.
14 Pocket Guide to Transportation2-11 Top 10 World Airports: 2021
by enplaned, deplaned, and in-transit passengers
NOTE: Preliminary data for passengers enplaned, deplaned, and passengers in
transit.
SOURCE: Airports Council International, available at https://www.aci.aero/ as of
October 2022.
Moving People 152-12 Incoming Land Border Person
Crossings: 1996–2021
NOTE: Excludes drivers and passengers in commercial trucks.
SOURCE: U.S. Department of Transportation, Bureau of Transportation Sta-
tistics, Border Crossing Entry Data, available at https://www.bts.gov/content/
border-crossingentry-data/ as of September 2022.
16 Pocket Guide to Transportation2-13 Top 5 Land Ports of Entry: 2021
by incoming person crossings
NOTE: Excludes drivers and passengers in commercial trucks.
SOURCE: U.S. Department of Transportation, Bureau of Transportation Sta-
tistics, Border Crossing Entry Data, available at https://www.bts.gov/content/
border-crossingentry-data/ as of September 2022.
Moving People 173 Moving Goods
T he freight transportation network links natural
resources, manufacturing facilities, labor
markets, and customers across the nation and with
international trading partners.
3-1 Freight Shipments Within the U.S. by
Mode
Value of shipments (billions of constant 2017 dollars)
Mode 2017 2020 2050
Truck 13,690 13,148 26,023
Rail 553 537 1,026
Water 293 242 439
Air and truck-air 654 599 1,345
Pipeline 946 998 1,279
Multiple modesa 2,658 2,489 6,050
Otherb 45 12 92
Total 18,839 18,024 36,254
Weight of shipments (millions of tons)
Mode 2017 2020 2050
Truck 12,810 12,595 19,310
Rail 1,624 1,428 1,916
Water 918 858 1,240
Air and truck-air 6 6 13
Pipeline 3,451 3,523 5,102
a
Multiple modes 689 684 1,190
Otherb 311 208 133
Total 19,809 19,303 28,904
Ton miles of shipments (billions of ton miles)
Mode 2017 2020 2050
Truck 2,397 2,358 3,931
Rail 1,095 946 1,230
Water 448 424 538
Air and truck-air 7 7 14
Pipeline 883 926 1,357
Multiple modesa 581 575 1,022
Otherb 13 14 18
Total 5,428 5,251 8,110
a
Includes mail. bIncludes other, unknown, and imported crude oil with no
domestic mode.
NOTES: Details may not add to totals due to rounding. Includes domestic
trade and the domestic portion of imports and exports.
SOURCE: U.S. Department of Transportation, Bureau of Transportation
Statistics and Federal Highway Administration, Freight Analysis Framework,
Version 5.4, available at www.bts.gov/faf as of October 2022.
Moving Goods 193-2 U.S. Trade by Coasts and Borders:
2003–2021
NOTE: Includes U.S. international merchandise trade only.
SOURCES: Value–U.S. Department of Commerce, Census Bureau, Foreign
Trade Division, HS Port-Level Data (Washington, DC: annual issues) as of Octo-
ber 2022. Implicit GDP Deflator–Organization for Economic Co-operation
and Development, GDP Implicit Price Deflator in United States [USAGDPDE-
FAISMEI], retrieved from FRED, Federal Reserve Bank of St. Louis; available at
https://fred.stlouisfed.org/series/USAGDPDEFAISMEI, available at www.bea.gov
as of October 2022.
20 Pocket Guide to Transportation3-3 U.S. Trade with Canada and Mexico by
Mode: 2021
a
Export weights for land modes are estimated by the Bureau of Transporta-
tion Statistics using value-to-weight ratios derived from import data. bIncludes
mail, other, unknown, and shipments through Foreign Trade Zones.
NOTE: Percents may not add to 100 due to rounding.
SOURCE: U.S. Department of Transportation, Bureau of Transportation Statis-
tics, North American Transborder Freight Data, special tabulation, available at
https://www.bts.gov/transborder as of March 2022.
Moving Goods 213-4 Incoming Truck Border Crossings:
1996–2021
SOURCE: U.S. Department of Transportation, Bureau of Transportation Statis-
tics, Border Crossing Entry Data, available at https://data.transportation.gov/
as of March 2022.
22 Pocket Guide to Transportation3-5 Top 5 Truck Ports of Entry: 2021
by incoming truck crossings
NOTE: Customs and Border Patrol CBP separated the Ysleta Port of Entry
from the El Paso Port of Entry beginning on March 1, 2020.
SOURCE: U.S. Department of Transportation, Bureau of Transportation Statis-
tics, Border Crossing Entry Data, available at https://data.transportation.gov/
as of September 2022.
Moving Goods 233-6 Top 10 U.S. Water Ports: 2020
by short tons
by container TEUs (2019)
KEY: TEU = twenty-foot equivalent unit.
NOTE: Includes domestic and foreign waterborne trade. Excludes foreign empty
TEUs.
SOURCE: U.S. Army Corps of Engineers, Waterborne Commerce Statistics
Center, personal communication as of November 2022.
24 Pocket Guide to Transportation3-7 Top 10 World Container Ports: 2021
TEUs, including full and empty containers
KEY: TEU = twenty-foot equivalent unit.
SOURCE: Lloyd’s List, One Hundred Ports 2022, available at https://lloydslist.
maritimeintelligence.informa.com/one-hundred-container-ports-2022 as of
October 2022.
Moving Goods 253-8 Top 10 U.S. International Trade
Gateways: 2020
by value of shipments
KEY: = airport, = land port, = water port.
NOTES: Air gateways include a low level (generally less than 3% of the total value)
of freight shipped through small user-fee airports located in the same area as
the gateways listed. Air gateways not identified by airport name (e.g., Chicago, IL)
include major airport(s) in the area and small regional airports.
SOURCE: As cited in U.S. Department of Transportation, Bureau of Transportation
Statistics, National Transportation Statistics, table 1-51, available at https://www.bts.
gov/nts as of October 2022.
26 Pocket Guide to Transportation4 Safety
T ransportation safety is the top priority of the U.S.
Department of Transportation.
4-1 Transportation Fatalities by Mode
Mode 2010 2020 2021
Air 477 349 U
U.S. air carrier 2 0 U
Commuter carrier 0 5 U
On-demand air taxi 17 21 U
General aviation 458 332 U
Highway 32,999 38,824 U
Passenger car occupants 12,491 13,472 U
Motorcyclists 4,518 5,579 U
Light-truck occupants 9,782 10,352 U
Heavy-truck occupants 530 831 U
Bus occupants 44 16 U
Pedestrians 4,302 6,516 U
Pedalcyclists 623 938 U
Other 709 1,120 U
Pipeline 22 15 13
Rail 735 743 890
Train Accidents 8 6 8
Highway-rail grade crossinga 261 195 236
Trespassers 441 518 614
Other 25 24 32
Transitb 224 289 322
Water 821 838 696
Freight vessel and Industrial/Other 62 56 27
Passenger vessel and Recreational boating 759 782 669
a
Individual modes don’t add up to totals due to double counting in highway, rail, and
transit grade crossings. bIncludes transit employee, contract worker, passenger, peo-
ple waiting or leaving (revenue facility occupant), and other fatalities for all modes
reported to the National Transit Database. Excludes commuter rail (reporting under
FRA jurisdiction). Other transit fatalities are assumed to be counted under Highway
or Rail categories.
KEY: U = data are not available.
SOURCE: As cited in U.S. Department of Transportation, Bureau of Transportation
Statistics, National Transportation Statistics, table 2-1, available at www.bts.gov/nts as
of October 2022.
Safety 274-2 Transportation Injuries by Mode
Mode 2010 2020 2021
Air 278 202 U
U.S. air carrier 17 8 U
Commuter carrier 2 0 U
On-demand air taxi 3 9 U
General aviation 256 187 U
Highway a 2,247,988 2,282,015 U
Passenger car occupantsa 1,256,101 1,221,335 U
Motorcyclistsa 82,300 82,528 U
Light-truck occupantsa 737,152 813,509 U
Heavy-truck occupantsa 19,937 44,934 U
Bus occupantsa 17,586 6,620 U
Pedestriansa 70,267 54,769 U
Pedalcyclistsa 51,688 38,886 U
Othera 12,956 19,435 U
Pipeline 108 39 32
Rail 8,379 5,551 5,817
Train Accidents 110 72 118
Highway-rail grade crossingb 888 697 670
Trespassers 390 561 522
Other 6,991 4,221 4,507
Transitc 23,107 15,421 16,549
Water 3,770 3,540 3,025
Freight vessel and Industrial/Other 407 208 232
Passenger vessel and
Recreational boating 3,363 3,332 2,793
a
2020 and 2021 Crash Reporting Sampling System (CRSS) estimates for injuries are not
comparable with 2010 and earlier NASS GES estimates because of different sampling
designs. bExcludes injuries involving motor vehicles at public highway-rail grade cross-
ings, which are assumed to be counted under Highway categories. cIncludes transit
employee, contract worker, passenger, people waiting or leaving (revenue facility
occupant), and other injuries for all modes reported to the National Transit Database.
Excludes commuter rail (reporting under FRA jurisdiction). Other transit injuries are
assumed to be counted under Highway or Rail categories.
KEY: U = data are not available.
NOTES: Highway numbers are estimates rather than actual counts. The estimates are
calculated from data obtained from a nationally representative sample of crashes.
NHTSA redesigned the nationally representative sample of police-reported traffic
crashes, which estimates the number of police-reported injury and property-damage-
only crashes in the US. The new system, CRSS, replaced the NASS GES in 2016 and has
a different sample design. Thus, the 2020 and 2021 persons injured estimates are not
comparable to earlier estimates.
SOURCE: As cited in U.S. Department of Transportation, Bureau of Transportation
Statistics, National Transportation Statistics, table 2-2, available at www.bts.gov/nts as
of November 2022.
28 Pocket Guide to Transportation4-3 Fatality Rates by Mode
continued on next page
Safety 294-3 Fatality Rates by Mode (continued)
continued on next page
30 Pocket Guide to Transportation4-3 Fatality Rates by Mode (continued)
SOURCES: Highway, Passenger car and light-truck occupants, Highway-
nonoccupants, Large-truck occupants, U.S. air carriers, General aviation,
and Recreational boating—as cited in or calculated from U.S. Department
of Transportation, Bureau of Transportation Statistics, National Transportation
Statistics, tables 2-9, 2-14, 2-17, 2-19, 2-21, 2-23, 2-47, and 3-10 available at
www.bts.gov/nts as of October 2022. Transit—U.S. Department of Transporta-
tion, Federal Transit Administration, NTD Safety & Security Time Series Data,
available at https://www.transit.dot.gov/ntd as of October 2022. Rail—U.S.
Department of Transportation, Federal Railroad Administration, table 1.12,
available at https://safetydata.fra.dot.gov/ as of October 2022.
Safety 314-4 Alcohol-Impaired Driving Fatalities:
1990–2020
NOTE: Includes fatalities occurring in any crash involving a driver with a blood
alcohol concentration (BAC) of 0.08 grams per deciliter or higher.
SOURCE: U.S. Department of Transportation, National Highway Traffic Safety
Administration, Traffic Safety Facts: 2019 Fatal Motor Vehicle Crashes: Overview
as of October 2022.
4-5 Pedestrian and Bicyclist Fatalities:
1990–2020
NOTE: Includes pedestrians and riders of nonmotorized bicycles and other
pedal-powered vehicles.
SOURCE: As cited in U.S. Department of Transportation, Bureau of Transporta-
tion Statistics, National Transportation Statistics, table 2-1, available at www.bts.
gov/nts as of October 2022.
32 Pocket Guide to Transportation4-6 Distracted Driving Fatalities and Injuries:
2005–2020
a
Distracted driving fatality data for 2010 and on are not comparable with
previous years due to changes in methodology. bCrash Reporting Sampling
System (CRSS) estimates for injuries are not comparable with 2015 and earlier
National Automotive Sampling System (NASS) General Estimates System (GES)
estimates because of different sampling designs.
NOTE: Distracted driving involves any activity that could divert a person’s
attention away from the primary task of driving, such as texting, using a cell
phone, eating and drinking, grooming, using a navigation system, adjusting
a radio, etc.
SOURCE: Fatalities–U.S. Department of Transportation, National Center
for Statistics and Analysis, Fatality and Injury Reporting System Tool (FIRST),
available at www.cdan.dot.gov; Injuries- U.S. Department of Transportation,
National Highway Traffic Safety Administration, Traffic Safety Facts, Research
Note, Distracted Driving 2020, available at www.crashstats.nhtsa.dot.gov, as of
October 2022.
Safety 335 Performance
T he physical capacity of the U.S. transportation
system has not kept pace with growth in travel
and commerce. The resulting congestion and delays
have significant impacts on passengers and freight
shippers.
5-1 Road Congestion: 1985–2020
NOTES: Annual hours of delay per car commuter—The extra time spent
during the year traveling at congested speeds rather than free-flow speeds by
private vehicle drivers and passengers who typically travel in the peak periods.
The methodology to calculate congestion performance measures was updated
to reflect more comprehensive data collection using INRIX data for each of the
494 U.S. urban areas. The congestion estimates for all study years are recal-
culated every time the methodology is altered to provide a consistent data
trend. For a detailed explanation of the updated methodology, see the Urban
Mobility Report at http://mobility.tamu.edu/ums/report/.
SOURCE: Texas A&M Transportation Institute, Urban Mobility Report, available
at https://mobility.tamu.edu/umr/report/ as of October 2022.
Performance 355-2 Top 10 Metropolitan Area Congestion
Rankings: 2020
by calendar year, average minutes of congestion
KEY: MSA = Metropolitan Statistical Area
NOTES: Minutes of congestion—the amount of time when freeways operate
less than 90 percent of free-flow freeway speeds. Calculated by calendar year
for an average duration of daily congestion.
SOURCE: U.S. Department of Transportation, Federal Highway Administration,
Urban Congestion Report, personal communication, as of October 2022.
5-3 U.S. Airline On-time Performance: 1995–2021
NOTE: Flights arriving at the gate within 15 minutes of scheduled arrival time are
on time.
SOURCE: U.S. Department of Transportation, Bureau of Transportation Statistics,
Airline On-Time Performance, available at www.bts.gov as of March 2022.
36 Pocket Guide to Transportation5-4 U.S. Major Airport Delays by Cause: 2021
percent of delayed time
a
Includes weather events that prevent flying. Other weather delays that slow
operations are included under other categories. bDelay resulting from a previ-
ous flight with the same aircraft arriving late.
KEY: NAS = Delays attributable to the national aviation system (NAS) that refer
to a broad set of conditions, such as non-extreme weather, airport operations,
heavy traffic volume, and air traffic control.
NOTE: Percents may not add to 100 due to rounding.
SOURCE: U.S. Department of Transportation, Bureau of Transportation Statistics,
Airline On-Time Performance, available at transtats.bts.gov as of October 2022.
5-5 U.S. Major Airport Performance
Rankings: 2021
by percent of on-time arrivals
NOTE: Flights arriving at the gate within 15 minutes of scheduled arrival time
are on time.
SOURCE: U.S. Department of Transportation, Bureau of Transportation Statistics,
Airline On-Time Performance, available at transtats.bts.gov as of October 2022.
Performance 375-6 Amtrak On-time Performance:
FY1990–FY2021
NOTE: On-time performance is a percentage measure of train performance.
A train is considered on-time if it arrives at the final destination, or end-point,
within an allowed number of minutes, or tolerance, of its scheduled arrival
time. Trains are allowed a certain tolerance at the end-point based on the
number of miles traveled.
Train arrives at
Trip length endpoint within
0-250 miles 10 minutes
251-350 miles 15 minutes
351-450 miles 20 minutes
451-550 miles 25 minutes
>551 miles 30 minutes
SOURCE: As cited in U.S. Department of Transportation, Bureau of Transporta-
tion Statistics, National Transportation Statistics, table 1-73, available at transtats.
bts.gov as of October 2022.
38 Pocket Guide to Transportation5-7 Amtrak Delays by Cause: FY2021
percent of delayed time
a
Delays not attributable to Amtrak or other host railroads, such as customs
and immigration, law enforcement action, weather, or waiting for scheduled
departure time.
NOTE: Percents may not add to 100 due to rounding.
SOURCE: As cited in U.S. Department of Transportation, Bureau of Transporta-
tion Statistics, National Transportation Statistics, table 1-73, available at www.
bts.gov/nts as of October 2022.
Performance 396 Economy
T ransportation is a major sector of the U.S. economy.
The transportation system moves people and
goods, employs millions of workers, and consumes
resources and services provided by other sectors.
6-1 U.S. GDP by Spending Category: 2021
percent of GDP
a
Includes all other categories (e.g., entertainment, personal care products and
services, and payments to pension plans).
KEY: GDP = gross domestic product.
NOTE: Percents may not add to 100 due to rounding.
SOURCE: As cited in U.S. Department of Transportation, Bureau of Transportation
Statistics, National Transportation Statistics, table 3-9, available at www.bts.gov/nts
as of October 2022.
Economy 416-2 U.S. Transportation Spending: 1995–2021
KEY: GDP = gross domestic product.
SOURCE: As cited in U.S. Department of Transportation, Bureau of Transportation
Statistics, National Transportation Statistics, table 3-9, available at www.bts.gov/nts
as of October 2022.
42 Pocket Guide to Transportation6-3 Transportation-Related Final Demand
billions of chained 2012 dollars
Category 2011 2021
Personal consumption of transportation 1,105 1,414
Motor vehicles and parts 370 614
Motor vehicle fuels, lubricants, and fluids 400 405
Transportation services 335 395
Gross private domestic investment 192 235
Transportation structures 10 12
Transportation equipment 182 223
Government transportation-related purchases 317 326
Federal purchases 41 43
State and local purchases 252 271
Defense-related purchases 25 13
Exports ( + ) 303 269
Imports ( - ) 396 482
Total transportation-related GDP 1,524 1,717
U.S. GDP 15,892 19,610
KEY: GDP = gross domestic product
NOTES: Data may not add to totals due to rounding. Transportation-related
final demand measures the size of transportation functions in relation to the
Gross Domestic Product (GDP). It includes the transportation portion of the
four components of the GDP: personal consumption, gross private domestic
investment, government purchases, and net exports of goods and services.
SOURCE: As cited in U.S. Department of Transportation, Bureau of Transporta-
tion Statistics, National Transportation Statistics, table 3-4, available at
www.bts.gov/nts as of October 2022.
Economy 436-4 Household Expenses by Category: 2021
percent of average annual household expenses
a
Includes alcoholic beverages, cash contributions, education, entertainment,
personal care products and services, reading, tobacco products and smoking
supplies, and other miscellaneous items.
NOTE: Percents may not add to 100 due to rounding.
SOURCE: U.S. Department of Labor, Bureau of Labor Statistics, Consumer
Expenditure Survey, available at www.bls.gov/cex as of October 2022.
6-5 Household Transportation Expenses:
1985–2021
SOURCE: U.S. Department of Labor, Bureau of Labor Statistics, Consumer
Expenditure Survey, available at www.bls.gov/cex as of October 2022.
44 Pocket Guide to Transportation6-6 Transportation Services Index (TSI):
January 2000–July 2022
chain-type index: 2000 = 100, seasonally adjusted
NOTES: TSI Combined—the TSI, created by the U.S. Department of
Transportation, Bureau of Transportation Statistics, is a measure of the
month-to-month changes in the output of services provided by the for-hire
transportation industries. TSI data change monthly due to the use of concur-
rent seasonal analysis, which results in seasonal analysis factors changing as
each month’s data are added. TSI Freight—includes freight railroad services
(including rail-based intermodal shipments, such as containers on flat cars),
inland waterway traffic, pipeline movements (including principally petroleum
and petroleum products and natural gas), and air freight. TSI Passenger—the
passenger transportation services index consists of local mass transit, intercity
passenger rail, and passenger air transportation.
SOURCE: U.S. Department of Transportation, Bureau of Transportation Statis-
tics, available at www.bts.gov as of October 2022.
Economy 456-7 Employment in Transportation-
Related Industries
thousands
Category 2011 2021
For-hire transportation and warehousing 4,289 6,092
Air 457 475
Rail 193 146
Water 61 56
Truck 1,301 1,514
Transit and ground passenger 447 375
Pipeline 43 50
Scenic and sightseeing 28 23
Support activities 573 722
Couriers and messengers 529 1,082
Warehousing and storage 658 1,648
a
Transportation-related manufacturing 1,685 1,934
Other transportation-related industries 4,811 5,377
Postal service 631 606
Government employmentb 854 851
Total transportation-related labor force 12,270 14,859
U.S. labor force 131,914 146,124
a
Includes transportation equipment; petroleum products; tires; rubber; plastics;
search, detection, navigation, guidance, aeronautical, and nautical systems;
and instrument manufacturing. bFiscal year data for federal, state, and local
personnel.
NOTES: Annual averages based on NAICS data. Details may not add to totals
due to rounding.
SOURCE: As cited in U.S. Department of Transportation, Bureau of Transporta-
tion Statistics, National Transportation Statistics, table 3-23, available at
www.bts.gov/nts as of September 2022.
46 Pocket Guide to Transportation6-8 Motor Vehicle Fuel Prices:
April 1994–September 2022
NOTES: Retail Gasoline Prices include average nominal monthly prices of U.S.
Regular All Formations retail gasoline. Diesel Retail Prices include average
nominal monthly prices of U.S. No. 2 Diesel Retail Prices.
SOURCE: U.S. Department of Energy, Energy Information Administration, avail-
able at https://www.eia.gov/ as of October 2022.
Economy 477 Environment
T he U.S. transportation system is a major consumer
of energy and has consequences for the
environment.
7-1 Energy Consumption by Sector: 1960–2021
KEY: Btu = British thermal unit.
NOTE: Includes primary energy consumption, electricity retail sales, and electri-
cal system energy losses.
SOURCE: U.S. Department of Energy, U.S. Energy Information Administration,
Monthly Energy Review, available at www.eia.gov/totalenergy/data/monthly,
Table 2.1a as of October 2022.
Environment 497-2 Transportation Energy Consumption
by Source: 2021
percent of Btu consumed
KEY: Btu = British thermal unit.
NOTES: Includes primary energy consumed. Excludes electricity retail sales and
electrical system energy losses. Percents may not add to 100 due to rounding.
SOURCE: U.S. Department of Energy, U.S. Energy Information Administration,
Monthly Energy Review, available at www.eia.gov/totalenergy/data/monthly,
Table 2.5, as of October 2022.
50 Pocket Guide to Transportation7-3 Petroleum Consumption by Sector:
1960–2021
SOURCE: U.S. Department of Energy, U.S. Energy Information Administration,
Monthly Energy Review, available at www.eia.gov/totalenergy/data/monthly,
Tables 3.7-3.8, as of October 2022.
Environment 517-4 Greenhouse Gas Emissions by Sector:
1990–2020
KEY: Tg CO2 Eq. = teragrams of carbon dioxide equivalent. Teragram = 1 million
metric tons.
NOTES: Electric power sector emissions are distributed across sectors.
Emissions include carbon dioxide, methane, nitrous oxide, hydrofluorocarbons,
perfluorochemicals, and sulfur hexafluoride.
SOURCE: U.S. Environmental Protection Agency, Inventory of U.S. Greenhouse
Gas Emissions and Sinks: Report Tables, https://cfpub.epa.gov/ghgdata/inven
toryexplorer/#transportation/entiresector/allgas/category/all, as of October
2022.
52 Pocket Guide to Transportation7-5 Greenhouse Gas Emissions by
Transportation Mode: 2020
Percent of Tg CO2 Eq.
KEY: Tg CO2 Eq. = teragrams of carbon dioxide equivalent. Teragram = 1 million
metric tons.
NOTES: Percents may not add to 100 due to rounding. Does not include
international bunker fuels.
SOURCES: U.S. Environmental Protection Agency, Inventory of U.S. Greenhouse
Gas Emissions and Sinks: 1990–2020 Report Tables, available at https://www.
epa.gov/greenvehicles/fast-facts-transportation-greenhouse-gas-emissions,
Fast Facts: U.S. Transportation Sector GHG Emissions, as of May 2022.
Environment 537-6 Highway Vehicle Air Pollutant Emissions:
2002–2021
KEY: PM = particulate matters; PM-10 = airborne particulates of less than 10
microns; PM-2.5 = airborne particulates of less than 2.5 microns.
NOTES: Indices are calculated using data on highway vehicle emissions only. Par-
ticulate matters is without condensibles.
SOURCE: As cited in U.S. Department of Transportation, Bureau of Transportation
Statistics, National Transportation Statistics, tables 4-45 through 4-50, available at
www.bts.gov/nts as of October 2022.
54 Pocket Guide to Transportation7-7 Fuel Economy of Light-Duty Vehicles:
1990–2020
KEY: CAFE = Corporate Average Fuel Economy; EPA = Environmental Protection
Agency.
NOTES: New fleet data and CAFE standards are for vehicle model years. On-
road fleet data include passenger cars and light trucks and are estimated using
average miles traveled per gallon of fuel consumed for each calendar year.
SOURCE: As cited in U.S. Department of Transportation, Bureau of Trans-
portation Statistics, National Transportation Statistics, table 4-23, available
at www.bts.gov/nts as of October 2022.
Environment 557-8 Sales of Hybrid, Plug-in Hybrid, and
Battery Electric Vehicles: 2000–2021
KEY: BEV = Battery electric-only vehicles, HEV = Hybrid electric vehicle,
PHEV = Plug-in hybrid electric vehicle.
SOURCE: Oak Ridge National Laboratory, Transportation Energy Data Book,
Annual Issues, available at tedb.ornl.gov as of May 2022.
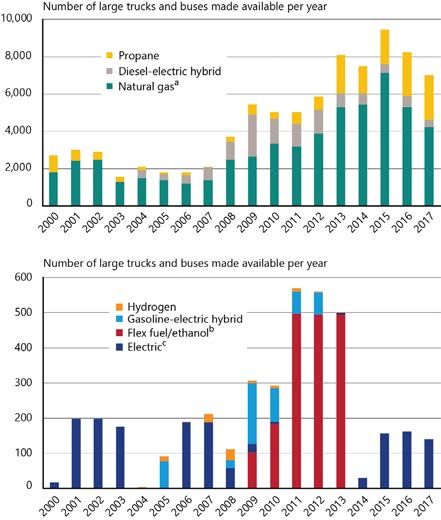
56 Pocket Guide to Transportation7-9 Alternative Fuel Vehicles by Fuel Type,
Large Trucks and Buses: 2000–2017
NOTES: aIncludes compressed natural gas (CNG) and liquified natural gas
(LNG). Includes the total number of heavy duty vehicles that were manufac-
tured or converted by vehicle suppliers (companies or organizations) in the
associated calendar year. bFlex fuel/ethanol vehicles are capable of running on
E85, unblended gasoline, or any ethanol-gasoline blends in between. cExcludes
gasoline-electric and diesel-electric hybrids.
SOURCE: U.S. Department of Energy, Energy Information Administration,
Alternative Fuel Vehicle Data, Supplier Database, available at
www.eia.gov/renewable/afv/ as of October 2022.
Environment 57Glossary
Air carrier: Certificated provider of scheduled and nonscheduled
services.
Alternative fueled vehicle: A vehicle designed to operate on an
alternative fuel (e.g., compressed natural gas, propane, electricity).
The vehicle can be either a dedicated vehicle designed to operate
exclusively on alternative fuel or a non-dedicated vehicle designed to
operate on alternative fuel and/or traditional fuel.
Chained dollars: A method of adjusting to real dollar amounts
to account for both changes in price-levels and the composition
of output over time. This is completed by using a chain-weighted
type index, or average weights in successive time periods, to get a
comparable time series of data.
Class I railroad: Railroads earning adjusted annual operating
revenues for three consecutive years of $250,000,000 or more, based
on 1991 dollars with an adjustment factor applied to subsequent
years.
Commuter rail: Urban/suburban passenger train service for short-
distance travel between a central city and adjacent suburbs run on
tracks of a traditional railroad system. Does not include heavy or light
rail transit service.
Demand response transit: A nonfixed-route, nonfixed-schedule form
of transportation that operates in response to calls from passengers
or their agents to the transit operator or dispatcher.
Directional route-miles: The sum of the mileage in each direction
over which transit vehicles travel while in revenue service.
Enplanements: Total number of revenue passengers boarding
aircraft.
For-hire: Refers to a vehicle operated on behalf of or by a
company that provides services to external customers for a fee.
It is distinguished from private transportation services, in which a
firm transports its own freight and does not offer its transportation
services to other shippers.
General aviation: Civil aviation operations other than those air
carriers holding a Certificate of Public Convenience and Necessity.
Types of aircraft used in general aviation range from corporate, multi–
engine jets piloted by a professional crew to amateur-built, single-
engine, piston-driven, acrobatic planes.
Gross domestic product: The total value of goods and services
produced by labor and property located in the United States. As
long as the labor and property are located in the United States,
the suppliers may be either U.S. residents or residents of foreign
countries.
58 Pocket Guide to TransportationHeavy-rail transit: High-speed transit rail operated on rights-of-way
that exclude all other vehicles and pedestrians.
Hybrid electric vehicle: Hybrid electric vehicles combine features of
internal combustion engines and electric motors. Unlike 100% electric
vehicles, hybrid vehicles do not need to be plugged into an external
source of electricity to be recharged. Most hybrid vehicles operate on
gasoline.
International Roughness Index (IRI): A scale for pavement
roughness based on the simulated response of a generic motor
vehicle to the roughness in a single wheel path of the road surface.
Lane-miles: One mile of one lane of road.
Light-duty vehicle: Includes passenger cars, light trucks, vans, pickup
trucks, and sport/utility vehicles regardless of wheelbase.
Light-rail transit: Urban transit rail operated on a reserved right-
of-way that may be crossed by roads used by motor vehicles and
pedestrians.
Nominal dollars: A market value that does not take inflation into
account and reflects prices and quantities that were current during
the period being measured.
Nonself-propelled vessels: Includes dry cargo, tank barges, and
railroad car floats that operate in U.S. ports and waterways.
Oceangoing vessels: Includes U.S. flag, privately owned merchant
fleet of oceangoing, self-propelled, cargo-carrying vessels of 1,000
gross tons or greater.
Particulates: Carbon particles formed by partial oxidation and
reduction of hydrocarbon fuel. Also included are trace quantities of
metal oxides and nitrides originating from engine wear, component
degradation, and inorganic fuel additives.
Passenger-mile: One passenger transported one mile. For example,
1 vehicle traveling 3 miles carrying 5 passengers generates 15
passenger-miles.
Personal communication: Involves contacting the source for data if
not publicly available.
Plug-in hybrid electric vehicles: Plug-in hybrids use the electric
battery as the primary energy source by relying on battery power
for propulsion for a limited range (15–40 miles) before switching
to internal combustion propulsion (thus reducing gasoline
consumption).
Reliever airports: Airports designated by the Federal Aviation
Administration to relieve congestion at commercial service airports
and to provide improved general aviation access to the overall
community.
Glossary 59Seasonally adjusted: Measures the real differences in data trends by
adjusting for seasonal factors, such as the change in the number of
days, weekends, holidays, or other seasonal activity in a month, such
as vacation travel.
Self-propelled vessels: Includes dry cargo vessels, tankers, and
offshore supply vessels, tugboats, pushboats, and passenger vessels,
such as excursion/sightseeing boats, combination passenger and dry
cargo vessels, and ferries.
Short ton: A unit of weight equal to 2,000 pounds.
Structurally deficient: Structural deficiencies are characterized by
deteriorated conditions of significant bridge elements and reduced
load-carrying capacity.
Real dollars: A method of adjusting nominal dollars to account for
price level changes over time. It reflects purchasing power in a given
period.
Tg CO2 Eq.: Teragrams of carbon dioxide equivalent, a metric measure
used to compare the emissions from various greenhouse gases based
on their global warming potential.
Ton-mile: A unit of measure equal to movement of 1 ton over 1 mile.
Transportation Services Index: BTS’ monthly measure indicating the
relative change in the volume of services over time performed by the
for-hire transportation sector. Change is shown relative to a base year,
which is given a value of 100. The TSI covers the activities of for-hire
freight carriers, for-hire passenger carriers, and a combination of the
two. See www.bts.gov for a detailed explanation.
Transportation Services Index Combined: The combined
Transportation Services Index (TSI) includes available data on freight
traffic, as well as passenger travel, that have been weighted to yield a
monthly measure of transportation services output.
Transportation Services Index Freight: The freight TSI measures the
output of the for-hire freight transportation industry and consists of
data from for-hire trucking, rail, inland waterways, pipelines, and air
freight.
Transportation Services Index Passenger: The passenger TSI
includes local transit, intercity passenger rail, and passenger air
transportation, which have been weighted to yield a monthly measure
of transportation services output.
Unlinked passenger trip: The number of passengers who board
public transportation vehicles. Passengers are counted each time they
board vehicles no matter how many vehicles they use to travel from
their origin to their destination.
Vehicle-mile: One vehicle traveling 1 mile.
60 Pocket Guide to TransportationStatistics published in this Pocket Guide to Transportation come from many different sources. Some statistics are based on samples and are subject to sampling variability. Statistics may also be subject to omissions and errors in reporting, recording, and processing. Photos provided by Adobe and BTS Stock Photos
MAJOR TRENDS

INFRASTRUCTURE

MOVING PEOPLE

MOVING GOODS

SAFETY

PERFORMANCE

ECONOMY

ENVIRONMENT

GLOSSARY

         Printed on paper containing recycled post
                  consumer waste paper.
You can also read