Planning Year 2023-2024 Loss of Load Expectation Study Report
←
→
Page content transcription
If your browser does not render page correctly, please read the page content below
Planning Year 2023-2024
 Loss of Load Expectation
 Study Report
 MISO — Resource Adequacy

Highlights
• MISO’s seasonal construct, accepted by FERC in September 2022, introduces seasonal requirements to
 the Planning Resource Auction (PRA) to account for the unique risk profile of each season.

• MISO made several modeling improvements to the LOLE study to support the new seasonal construct.

• MISO’s annual Loss of Load Expectation (LOLE) study sets the system-wide Planning Reserve Margin and
 the zonal Local Reliability Requirements for each season of the upcoming Planning Year.
Contents
Executive Summary ........................................................................................................................................................................ 4
1 LOLE Study Process Overview .......................................................................................................................................... 8
 1.1 Study Improvements .................................................................................................................................................... 9
2 Transfer Analysis .................................................................................................................................................................. 10
 2.1 Calculation Methodology and Process Description........................................................................................ 10
 2.1.1 Generation Pools................................................................................................................................................ 10
 2.1.2 Redispatch ............................................................................................................................................................ 10
 2.1.3 Generation Limited Transfer for CIL/CEL and ZIA/ZEA ...................................................................... 11
 2.1.4 Voltage Limited Transfer for CIL/CEL and ZIA/ZEA ............................................................................. 11
 2.2 Powerflow Models and Assumptions................................................................................................................... 12
 2.2.1 Tools Used ............................................................................................................................................................ 12
 2.2.2 Inputs Required .................................................................................................................................................. 12
 2.2.3 Powerflow Modeling......................................................................................................................................... 12
 2.2.4 General Assumptions ....................................................................................................................................... 13
 2.3 Results for CIL/CEL and ZIA/ZEA ......................................................................................................................... 14
 2.3.1 Outyear Analysis ................................................................................................................................................ 24
3 Loss of Load Expectation Analysis.................................................................................................................................. 25
 3.1 LOLE Modeling Input Data and Assumptions ................................................................................................... 25
 3.2 MISO Generation ........................................................................................................................................................ 25
 3.2.1 Thermal Units ...................................................................................................................................................... 25
 3.2.2 Behind-the-Meter Generation ...................................................................................................................... 28
 3.2.3 Attachment Y....................................................................................................................................................... 28
 3.2.4 Future Generation ............................................................................................................................................. 29
 3.2.5 Intermittent Resources.................................................................................................................................... 29
 3.2.6 Demand Response ............................................................................................................................................. 29
 3.3 MISO Load Data .......................................................................................................................................................... 29
 3.3.1 Weather Uncertainty ....................................................................................................................................... 30
 3.3.2 Economic Load Uncertainty ........................................................................................................................... 30
 3.4 External System ........................................................................................................................................................... 31
 3.5 Loss of Load Expectation Analysis and Metric Calculations ........................................................................ 32

 Planning Year 2022-2023 Loss of
 Load Expectation Study Report
3.5.1 Seasonal LOLE Targets .................................................................................................................................... 33
 3.7.1 MISO-Wide LOLE Analysis and PRM Calculation .................................................................................. 33
 3.7.2 LRZ LOLE Analysis and Local Reliability Requirement Calculation ................................................. 34
4 MISO System Planning Reserve Margin Results ....................................................................................................... 35
 4.1 Planning Year 2023-2024 MISO Planning Reserve Margin Results ......................................................... 35
 4.2 Comparison of PRM Targets Across 10 Years .................................................................................................. 36
 4.3 Future Years 2023 through 2032 Planning Reserve Margins..................................................................... 36
5 Local Resource Zone Analysis – LRR Results ............................................................................................................. 37
 5.1 Planning Year 2023-2024 Local Resource Zone Analysis ............................................................................ 37
6 Appendix A: Comparison of Planning Year 2022 to 2023 ..................................................................................... 42
 6.1 A.1 Waterfall Chart Details ..................................................................................................................................... 43
 6.1.1 A.1.1 Load ............................................................................................................................................................. 43
 6.1.2 A.1.2 Units ............................................................................................................................................................ 43
7 Appendix B: Capacity Import Limit Tier 1 & 2 Source Subsystem Definitions ............................................... 44
8 Appendix C: Compliance Conformance Table ........................................................................................................... 49
9 Appendix D: Acronyms List Table ................................................................................................................................... 53
10 Appendix E: Outyear PRM and LRR Results ............................................................................................................... 54
11 Appendix F: Outyear CIL/CEL Results .......................................................................................................................... 54

 Planning Year 2022-2023 Loss of
 Load Expectation Study Report
Executive Summary
Midcontinent Independent System Operator (MISO) conducts an annual Loss of Load Expectation (LOLE) study to
determine a Planning Reserve Margin Unforced Capacity (PRM UCAP), zonal per-unit Local Reliability Requirements
(LRR), Zonal Import Ability (ZIA), Zonal Export Ability (ZEA), Capacity Import Limits (CIL) and Capacity Export Limits
(CEL) for each season (Summer, Fall, Winter, & Spring) of the upcoming Planning Year. The results of the study and its
deliverables supply inputs to the MISO Planning Resource Auction (PRA).
The Planning Year 2023-2024 (PY 2023-2024) LOLE Study:

 • Establishes PRM UCAP for each season to be applied to the Load Serving Entity (LSE) seasonal coincident
 peaks for the Planning Year starting June 2023 and ending May 2024:
 o Summer 2023 PRM UCAP of 7.4%
 o Fall 2023 PRM UCAP of 14.9%
 o Winter 2023-2024 PRM UCAP of 25.5%
 o Spring 2024 PRM UCAP of 24.5%
 • Uses the Strategic Energy Risk Valuation Model (SERVM) software for Loss of Load analysis to provide
 results applicable across the MISO market footprint.
 • Provides zonal ZIA, ZEA, CIL and CEL for each Local Resource Zone (LRZ) (Figure ES-1). These values may be
 adjusted in March 2023 based on changes to MISO units with firm capacity commitments to non-MISO load,
 and equipment rating changes since the LOLE analysis. The Simultaneous Feasibility Test (SFT) process can
 further adjust CIL and CEL to ensure the resources cleared in the auction are simultaneously reliable.
 • Determines a minimum planning reserve margin for each season of the studied Planning Year that would
 result in the MISO system experiencing a less than one-day loss of load event every 10 years, as per the MISO
 Tariff.1 The MISO analysis shows that the system would achieve this reliability level for the summer 2023
 season when the amount of installed capacity available (considering external support) is 1.159 times that of
 the MISO system summer 2023 coincident peak.
 • Sets forth initial zonal-based (Table 1-1) PRA deliverables in the LOLE charter.

The stakeholder review process played an integral role in this study. The MISO staff would like to thank the Loss of
Load Expectation Working Group (LOLEWG) for its assistance and input. There were several process improvements
made to the LOLE study this year including updated transfer limits due to improved redispatch and four major LOLE
modeling enhancements: seasonal outage rates, wind and solar hourly profiles, probabilistic modeling of non-firm
support, and correlated cold weather outages.

1
 A one-day loss of load in 10 years (0.1 day/year) is not necessarily equal to 24 hours loss of load in 10 years (2.4 hours/year).

 4
One MISO Voice Style Guide
PRA and LOLE Metrics LRZ 1 LRZ 2 LRZ 3 LRZ 4 LRZ 5 LRZ 6 LRZ 7 LRZ 8 LRZ 9 LRZ 10

Summer 2023 PRM UCAP 7.4% 7.4% 7.4% 7.4% 7.4% 7.4% 7.4% 7.4% 7.4% 7.4%

LRR UCAP per-unit of LRZ
 1.139 1.120 1.299 1.212 1.333 1.172 1.171 1.473 1.157 1.538
 Peak Demand

Capacity Import Limit (CIL)
 5,301 3,477 6,108 7,884 3,576 8,492 5,087 4,139 5,268 3,064
 (MW)

 No No
 Capacity Export Limit
 3,959 2,550 4,310 Limit Limit 2,703 3,953 5,503 1,574 1,794
 (CEL) (MW)
 Found2 Found

 Zonal Import Ability (ZIA)
 5,299 3,477 6,043 6,992 3,576 8,092 5,087 4,091 4,456 3,064
 (MW)

 No No
Zonal Export Ability (ZEA)
 3,961 2,550 4,375 Limit Limit 3,109 3,953 5,551 2,386 1,794
 (MW)
 Found Found
 Table ES-1: Initial Planning Resource Auction Deliverables — Summer 2023

 PRA and LOLE Metrics LRZ 1 LRZ 2 LRZ 3 LRZ 4 LRZ 5 LRZ 6 LRZ 7 LRZ 8 LRZ 9 LRZ 10

 Fall 2023 PRM UCAP 14.9% 14.9% 14.9% 14.9% 14.9% 14.9% 14.9% 14.9% 14.9% 14.9%

LRR UCAP per-unit of LRZ
 1.274 1.218 1.408 1.254 1.452 1.247 1.345 1.490 1.278 1.619
 Peak Demand

 Capacity Import Limit
 (CIL) (MW) 6,528 4,411 14,3752 5,173 5,380 6,070 4,285 4,705 6,045 2,425

 Capacity Export Limit
 (CEL) (MW)
 3,804 3,577 4,354 4,878 1,992 1,701 3,990 5,080 1,526 2,878

Zonal Import Ability (ZIA)
 (MW) 6,526 4,411 14,3102 4,281 5,380 5,670 4,285 4,657 5,233 2,425

Zonal Export Ability (ZEA)
 (MW)
 3,806 3,577 4,419 5,770 1,992 2,101 3,990 5,128 2,338 2,878

 Table ES-2: Initial Planning Resource Auction Deliverables — Fall 2023

 2 “No Limit Found” reflects no valid constraint identified.

 5
 One MISO Voice Style Guide
PRA and LOLE Metrics LRZ 1 LRZ 2 LRZ 3 LRZ 4 LRZ 5 LRZ 6 LRZ 7 LRZ 8 LRZ 9 LRZ 10

Winter 23-24 PRM UCAP 25.5% 25.5% 25.5% 25.5% 25.5% 25.5% 25.5% 25.5% 25.5% 25.5%

LRR UCAP per-unit of LRZ
 1.403 1.422 1.850 1.365 1.474 1.301 1.573 1.503 1.323 1.777
 Peak Demand

 Capacity Import Limit
 4,937 4,905 11,0392 3,928 3,811 8,818 6,340 4,729 6,080 2,396
 (CIL) (MW)

 Capacity Export Limit
 (CEL) (MW)
 3,501 4,198 7,002 3,445 6,348 1,242 4,350 5,351 877 1,980

Zonal Import Ability (ZIA)
 4,935 4,905 10,9742 3,036 3,811 8,418 6,340 4,681 5,268 2,396
 (MW)

Zonal Export Ability (ZEA)
 (MW)
 3,503 4,198 7,067 4,337 6,348 1,642 4,350 5,399 1,689 1,980

 Table ES-3: Initial Planning Resource Auction Deliverables — Winter 2023-2024

 PRA and LOLE Metrics LRZ 1 LRZ 2 LRZ 3 LRZ 4 LRZ 5 LRZ 6 LRZ 7 LRZ 8 LRZ 9 LRZ 10

 Spring 2024 PRM UCAP 24.5% 24.5% 24.5% 24.5% 24.5% 24.5% 24.5% 24.5% 24.5% 24.5%

LRR UCAP per-unit of LRZ
 1.375 1.267 1.623 1.454 1.610 1.320 1.329 1.627 1.315 1.747
 Peak Demand

Capacity Import Limit (CIL)
 (MW)
 6,185 4,454 7,675 5,906 3,881 8,162 5,559 4,606 6,250 2,144

 Capacity Export Limit
 (CEL) (MW)
 4,321 3,679 6,173 3,745 3,724 2,344 4,413 5,472 2,240 2,720

 Zonal Import Ability (ZIA)
 (MW)
 6,183 4,454 7,610 5,014 3,881 7,762 5,559 4,558 5,438 2,144

Zonal Export Ability (ZEA)
 (MW)
 4,323 3,679 6,238 4,637 3,724 2,744 4,413 5,520 3,052 2,720

 Table ES-4: Initial Planning Resource Auction Deliverables — Spring 2024

 LRZ3 Fall and Winter ZIA and CIL were updated after the final results were presented at the October LOLEWG. Both
 studies resulted in No Limit found and the equation was updated to include Tier 2, the October 3rd 2022 LOLEWG
 presentation has also been updated accordingly.

 6
 One MISO Voice Style Guide
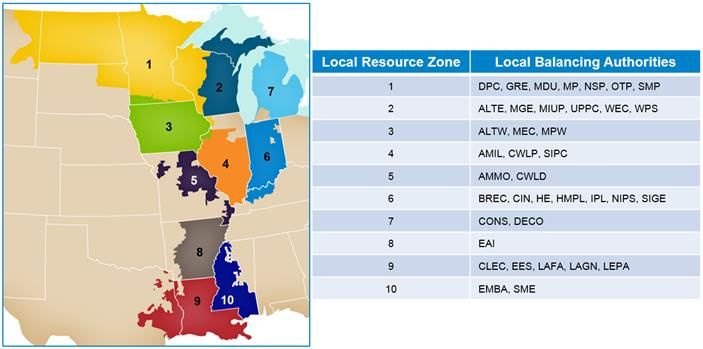
Figure ES-1: Local Resource Zones (LRZ)

 7
One MISO Voice Style Guide
1 LOLE Study Process Overview
In compliance with Module E-1 of the MISO Tariff, MISO performed its annual LOLE study to determine, for each
season of Planning Year 2023-2024, the system unforced capacity (UCAP) Planning Reserve Margin (PRM) and the
per-unit Local Reliability Requirements (LRR) of Local Resource Zone (LRZ) Peak Demand.
In addition to the LOLE analysis, MISO performed seasonal transfer analyses to determine seasonal Zonal Import
Ability (ZIA), Zonal Export Ability (ZEA), Capacity Import Limits (CIL) and Capacity Export Limits (CEL). CIL, CEL, and
ZIA are used, in conjunction with the LOLE analysis results, in the Planning Resource Auction (PRA). ZEA is
informational and not used in the PRA.
The PY 2023-2024 per-unit seasonal LRR UCAP multiplied by the updated LRZ seasonal Peak Demand forecasts
submitted for the 2023-2024 PRA determines each LRZ’s seasonal LRR. Once the seasonal LRR is determined, the
ZIA values and non-pseudo tied exports are subtracted from the seasonal LRR to determine each LRZ’s seasonal
Local Clearing Requirement (LCR) consistent with Section 68A.6 of Module E-13. An example calculation pursuant to
Section 68A.6 of the current effective Module E-1 shows how these values are reached (Table 1-1).

 Local Resource Zone (LRZ) EXAMPLE Example LRZ Formula Key
 Installed Capacity (ICAP) 17,442 [A]
 Unforced Capacity (UCAP) 16,326 [B]
 Adjustment to UCAP (1d in 10yr) 50 [C]
 Local Reliability Requirement (LRR) (UCAP) 16,376 [D]=[B]+[C]
 LRZ Peak Demand 14,270 [E]
 LRR UCAP per-unit of LRZ Peak Demand 114.8% [F]=[D]/[E]
 Zonal Import Ability (ZIA) 3,469 [G]
 Zonal Export Ability (ZEA) 2,317 [H]
 Proposed PRA (UCAP) EXAMPLE Example LRZ Formula Key
 Forecasted LRZ Peak Demand 14,270 [I]
 Forecasted LRZ Coincident Peak Demand 13,939 [J]
 Non-Pseudo Tied Exports UCAP 150 [K]
 Local Reliability Requirement (LRR) UCAP 16,376 [L]=[F]x[I]
 Local Clearing Requirement (LCR) 12,757 [M]=[L]-[G]-[K]
 Planning Reserve Margin (PRM) 7.4% [N]
 Zone’s System Wide PRMR 14,970 [O]=[1.074]x[J]
 [P]=Higher of [M] or
 PRMR 14,970
 [O]
 Table 1-1: Example LRZ Calculation

3 https://www.misoenergy.org/legal/tariff
 Effective Date: November 1, 2018

 8
One MISO Voice Style Guide
The actual effective PRM Requirement (PRMR) for each season of Planning Year 2023-2024 will be determined after
the updated LRZ Seasonal Peak Demand forecasts are submitted by November 1, 2022, for the 2023-2024 PRA. The
ZIA, ZEA, CIL and CEL values are subject to updates in March 2023 based on changes to exports of MISO resources to
non-MISO load, changes to pseudo tied commitments, and updates to facility ratings following the completion of the
LOLE study.
Finally, the simultaneous feasibility test (SFT) is performed as part of the PRA where cleared generation is tested to
ensure transmission reliability and if constraints arise, they are mitigated by adjusting CIL and CEL values as needed.

1.1 Study Improvements
The Planning Year 2023-2024 LOLE study incorporated a number of study improvements as a result of the approved
seasonal construct. These improvements include seasonal outage rates, correlated cold-weather outages,
probabilistic distribution of non-firm support, and hourly wind and solar profiles.
Historically, the LOLE model utilized a 5-year average EFORd, based on historic GADS data, which was constant
throughout the simulated year for all resources. This year, seasonal EFORd was calculated using the same GADS data
but outages were classified by season to produce four unique seasonal EFORd values for each resource. This change
better captures the seasonal availability of resources observed in operations.
Additional outages are added to the model during times of extreme cold temperatures to better capture the
magnitude of correlated outages observed. The magnitude of outages added increases as temperatures decrease
based on the relationship between outages and temperature determined from historic GADS and weather data. Each
LRZ has a unique outage/temperature curve based on actual performance.
For the last several years MISO has accounted for non-firm support in the LOLE process by simply reducing the PRM
by a fixed amount on a 1-for-1 MW basis. This year’s study incorporated seasonal distributions of non-firm support
directly in the model which are based on historic Net Scheduled Interchange (NSI) data. As the model steps through
time chronologically, SERVM will randomly draw import values from this distribution to be used to serve load.
In previous LOLE studies, wind resources were modeled as perfect units with a constant output equal to their
monthly ELCC values while solar resources were modeled as perfect units with constant output equal to their
capacity credit. For Planning Year 2023-2024, wind and solar resources were modeled as variable energy resources
with 30 unique hourly profiles corresponding to the 30 unique weather years within SERVM.

 9
One MISO Voice Style Guide
2 Transfer Analysis
2.1 Calculation Methodology and Process Description
Transfer analyses determined CIL and CEL values for LRZs in each season for Planning Year 2023-2024. Annual
adjustments are made for Border External Resources (BERs) and Coordinating Owner Resources (COs) to determine
the ZIA and ZEA in each season. Further adjustments are made for exports to non-MISO Loads to arrive at the CIL
and CEL values. The objective of transfer analysis is to determine constraints caused by the transfer of capacity
between zones and the associated transfer capability. Multiple factors impacted the analysis when compared to
previous studies, including:

 • 3.7 GW of Retirements / Suspensions
 • New Intermittent Resources
 • Base Model Dispatch in MISO and Seams

2.1.1 Generation Pools
To determine an LRZ’s import or export limit, a transfer is modeled by ramping generation up in a source subsystem
and ramping generation down in a sink subsystem. The source and sink definitions depend on the limit being tested.
The LRZ studied for import limits is the sink subsystem and the adjacent MISO LBA’s are the source subsystem. The
LRZ studied for export limits is the source subsystem and the rest of MISO is the sink subsystem. These are the same
in all seasons for the upcoming Planning Year.
Transfers can cause potential issues, which are addressed through the study assumptions. First, an abundantly large
source pool spreads the impact of the transfer widely which can cause differences in studied zones transfer
capabilities and constraints identified. Second, ramping up generation from remote areas could cause electrically
distant constraints for any given LRZ, which should not determine a zone’s limit. For example, export constraints due
to dispatch of LRZ 1 generation in the northwest portion of the footprint should not limit the import capability of LRZ
10, which covers the MISO portion of Mississippi.
To address these potential issues, the transfer studies limit the source pool for the import studies to the Tier 1 and
Tier 2 adjacent LBA’s to the study zone. Since the generation that is ramped up in export studies are contained in the
study LRZ, these issues only apply to import studies. Generation within the zone studied for an export limit is ramped
up and constraints are expected to be near or in the study zone.

2.1.2 Redispatch
Limited redispatch is applied after performing transfer analyses to mitigate constraints. Redispatch ensures
constraints are not caused by the base dispatch and aligns with potential actions that can be implemented for the
constraint in MISO operations. Redispatch scenarios can be designed to address multiple constraints as required and
may be used for constraints that are electrically close to each other or to further optimize transfer limits for several
constraints requiring only minor redispatch. The redispatch assumptions include:

 • The use of no more than 10 conventional fuel plants or intermittent resources
 • Redispatch limit at 2,000 MW total (1,000 MW up and 1,000 MW down)
 • No adjustments to nuclear units
 • No adjustments to the portions of pseudo-tied units committed to non-MISO load

 10
One MISO Voice Style Guide
2.1.3 Generation Limited Transfer for CIL/CEL and ZIA/ZEA
When conducting transfer analysis to determine import or export limits, the source subsystem might run out of
generation to dispatch before identifying a valid constraint caused by a transmission limit. MISO developed a
Generation Limited Transfer (GLT) process to identify transmission constraints in these situations, when possible, for
both imports and exports.
After running the First Contingency Incremental Transfer Capability (FCITC) analysis to determine limits for each
LRZ, MISO will determine whether a zone is experiencing a GLT (e.g. whether the first constraint would only occur
after all the generation is dispatched at its maximum amount). If the LRZ experiences a GLT, MISO will adjust the base
model depending on whether it is an import or export analysis and re-run the transfer analysis.
For an export study, when a transmission constraint has not been identified after dispatching all generation within
the exporting system (LRZ under study) MISO will decrease load and generation dispatch in the study zone. The
adjustment creates additional capacity to export from the zone. After the adjustments are complete, MISO will rerun
the transfer analysis. If a GLT reappears, MISO will make further adjustments to the load and generation of the study
zone.
For an import study, when a transmission constraint has not been identified after dispatching all generation within
the source subsystem, MISO will decrease load and generation in the source subsystem. This increases the export
capacity of the adjacent LBA’s for the study zone. After the adjustments are complete, MISO will run the transfer
analysis again. If a GLT reappears, MISO will make further adjustments to the model’s load and generation in the
source subsystem.
FCITC could indicate the transmission system can support larger thermal transfers than would be available based on
installed generation for some zones. However, large variations in load and generation for any zone may lead to
unreliable limits and constraints. Therefore, MISO limits load scaling for both import and export studies to 50 percent
of the zone’s load. In a GLT, redispatch, or GLT plus redispatch scenario, the FCITC of the most limiting constraint
might exceed Zonal Export/Import Capability. If the GLT does not produce a limit for a zone(s), due to a valid
constraint not being identified, or due to other considerations as listed in the prior paragraph, MISO shall report that
LRZ as having no limit and ensure that the limit will not bind in the first iteration of the Simultaneous Feasibility Test
(SFT).

2.1.4 Voltage Limited Transfer for CIL/CEL and ZIA/ZEA
Zonal imports may be limited by voltage constraints due to a decrease in the generation in the study zone. Voltage
constraints might occur at lower transfer levels than thermal limits determined by linear FCITC. As such, LOLE
studies may evaluate Power-Voltage curves for LRZs with known voltage-based transfer limitations identified
through existing MISO or Transmission Owner studies. Such evaluation may also occur if an LRZ’s import reaches a
level where the majority of the zone’s load would be served using imports from resources outside of the zone. MISO
will coordinate with stakeholders as it encounters these scenarios. For Planning Year 2023-2024, all seasons only
Zones 1, 4 and 7 import analysis included voltage screening and study. Only LRZ4 Summer identified a voltage limit
with lower transfer capability than the thermal limit.

 11
One MISO Voice Style Guide
2.2 Powerflow Models and Assumptions
2.2.1 Tools Used
MISO used the Siemens PTI Power System Simulator for Engineering (PSS/E) and Transmission Adequacy and
Reliability Assessment (TARA) for analysis tools.

2.2.2 Inputs Required
Thermal transfer analysis requires powerflow models and related input files. MISO used contingency files from
MTEP4 reliability assessment studies. Single-element contingencies in MISO/seam areas were also evaluated.
MISO developed a subsystem file to monitor its footprint and seam areas which was used for all seasons. LRZ
definitions were developed as sources and sinks in the study. See Appendix B for tables containing adjacent area
definitions (Tiers 1 and 2) used for this study. The monitored file includes all facilities under MISO functional control
and single elements in the seam areas of 100 kV and above.

2.2.3 Powerflow Modeling
The MTEP22 models were built using MISO’s Model on Demand (MOD) model data repository, with the following
base assumptions (Table 2-1).

 Load and
 Effective
 Scenario Projects Applied External Modeling Generation Wind % Solar %
 Date
 Profile
 Capacity
 MTEP Appendix A 2021 Series 2023 Summer
 Summer 2023 July 15th Credit 50%
 and Target A Summer ERAG MMWG Peak
 ~15.5%
 October MTEP Appendix A 2021 Series 2023
 Fall 2023 Fall Peak 32% 28.5%
 15th and Target A Summer ERAG MMWG

 Winter 2023- January MTEP Appendix A 2021 Series 2023 Winter
 67% 0%
 2024 15th and Target A Summer ERAG MMWG Peak

 MTEP Appendix A 2021 Series 2023 Spring
 Spring 2024 April 15th 28.5% 32%
 and Target A Summer ERAG MMWG Peak
 Table 2-1: Model Assumptions
MISO excluded several types of units from the transfer analysis dispatch—these units’ base dispatch remained fixed.

 • Nuclear dispatch does not change for any transfer
 • Wind and solar resources can be ramped down, but not up
 • Pseudo-tied resources were modeled at their expected commitments to non-MISO load, although portions of
 these units committed to MISO could participate in transfer analyses
System conditions such as load, dispatch, topology, and interchange have an impact on transfer capability. The model
was reviewed as part of the base model build for MTEP22 analyses, with study files made available on MISO

4
 Refer to the Transmission Planning BPM (BPM-20) for more information regarding MTEP input files.
https://www.misoenergy.org/legal/business-practice-manuals/

 12
One MISO Voice Style Guide
ShareFile. MISO worked closely with transmission owners and stakeholders in order to model the transmission
system accurately, as well as to validate constraints and redispatch. Like other planning studies, transmission outage
schedules were not included in the analysis. This is driven partly by limited availability of outage information as well
as current transmission planning standards. Although no outage schedules were evaluated, single element
contingencies were evaluated. This includes BES lines, transformers, and generators.
Contingency coverage covers most of category P1 and some of category P2 outlined in Table 1 of TPL-001:
(https://www.nerc.com/pa/Stand/Reliability%20Standards/TPL-001-5.pdf).

2.2.4 General Assumptions
MISO uses TARA to process the powerflow model and associated input files to determine the import and export
limits of each LRZ in each season by determining the transfer capability. Transfer capability measures the ability of
interconnected power systems to reliably transfer power from one area to another under specified system
conditions. The incremental amount of power that can be transferred is determined through FCITC analysis. FCITC
analysis and base power transfers provide the information required to calculate the First Contingency Total Transfer
Capability (FCTTC), which indicates the total amount of transferrable power before a constraint is identified. FCTTC
is the base power transfer plus the incremental transfer capability (Equation 3-1). All published limits are based on
the zone’s FCTTC and may be adjusted for capacity exports.
 ( ) = +

 Equation 2-1: Total Transfer Capability

FCITC constraints are identified under base case situations in each season or under P1 contingencies provided
through the MTEP process. Linear FCITC analysis identifies the limiting constraints using a minimum transfer
Distribution Factor (DF) cutoff of 3 percent, meaning the transfer must increase the loading on the overloaded
element, under system intact or contingency conditions, by 3 percent or more.
A pro-rata dispatch is used, which ensures all available generators will reach their maximum dispatch level at the
same time. The pro-rata dispatch is based on the MW reserve available for each unit and the cumulative MW reserve
available in the subsystem. The MW reserve is found by subtracting a unit’s base model generation dispatch from its
maximum dispatch, which reflects the available capacity of the unit.

 13
One MISO Voice Style Guide
Table 2-2 and Equation 2-2 show an example of how one unit’s dispatch is set, given all machine data for the source
subsystem.

 Base
 Minimum Maximum Reserve MW
 Model
 Unit Unit (Unit Dispatch
 Machine Unit
 Dispatch Dispatch Max – Unit
 Dispatch
 (MW) (MW) Dispatch Min)
 (MW)
 1 20 20 100 80
 2 50 10 150 100
 3 20 20 100 80
 4 450 0 500 50
 5 500 100 500 0
 Total Reserve 310
 Table 2-2: Example Subsystem

 = ×

 80
 ℎ 1 ℎ = × 100 = 25.8
 310
 ℎ 1 ℎ = 25.8

 Equation 2-2: Machine 1 Dispatch Calculation for 100 MW Transfer

2.3 Results for CIL/CEL and ZIA/ZEA
Study constraints and associated ZIA, ZEA, CIL, and CEL for each LRZ for each season were presented and reviewed
through the LOLEWG with final results for Planning Year 2023-2024 presented at the October 3rd, 2022 meeting.
Table 2-3 below shows the Planning Year 2023-2024 CIL and ZIA with corresponding constraint, GLT, and redispatch
(RDS) information.
All zones had an identified ZIA this year. If there is no valid constraint identified the following equation will be used
where the FCITC will be replaced by the Tier 1 & 2 capacity.

 = + –

 Equation 2-3: Zonal Import Ability (ZIA) Calculation

 14
One MISO Voice Style Guide
LRZ1 Monitored Element Contingency GLT RDS ZIA CIL
 Summer 2023 North Appleton - Werner W 345kV North Appleton - Morgan 345kV 15% 494MWx2 5299 5301
 Fall 2023 North Appleton - Werner W 345kV North Appleton - Morgan 345kV None 636MWx2 6526 6528
 Winter 2023/24 Council Bluffs - Sarpy County 345kV Arbor Hill - Raccoon Trail 345kV None 681MWx2 4935 4937
 Spring 2024 North Appleton - Werner W 345kV North Appleton - Morgan 345kV None 328MWx2 6183 6185
 LRZ2 Monitored Element Contingency GLT RDS ZIA CIL
 Summer 2023 Elk Mound - Wheaton 161kV King - Eau Claire 345kV 10% 1000MWx2 3477 3477
 Fall 2023 Arpin - Sigel 138kV Rocky Run - Arpin 345kV None 1000MWx2 4411 4411
 Winter 2023/24 Arpin - Sigel 138kV Rocky Run - Arpin 345kV None 1000MWx2 4905 4905
 Spring 2024 Arpin - Sigel 138kV Rocky Run - Arpin 345kV None 603MWx2 4454 4454
 LRZ3 Monitored Element Contingency GLT RDS ZIA CIL
 Summer 2023 S3458 3 - S3456 3 345kV S3455 - S3740 345kV 10% 113MWx2 6043 6108
 Fall 2023 No Limit Found None None 14,310 14,375
 Winter 2023/24 No Limit Found None None 10,974 11,039
 Prairie Island - North Rochester North Rochester - Hampton
 Spring 2024 None 345MWx2 7610 7675
 345kV Corner 345kV
 LRZ4 Monitored Element Contingency GLT RDS ZIA CIL
 Summer 2023 Bus 636410 Sub P Iowa City 161kV Hills 345/161kV Transformer None None 6992 7884
 Marblehead 161/138kV
 Fall 2023 Herlman - Maywood 345kV None 1000MWx2 4281 5173
 Transformer
 Marblehead 161/138kV
 Winter 2023/24 Herlman - Maywood 345kV None 1000MWx2 3036 3928
 Transformer
 Marblehead 161/138kV
 Spring 2024 Herlman - Maywood 345kV None 935MWx2 5014 5906
 Transformer
 LRZ5 Monitored Element Contingency GLT RDS ZIA CIL
 Summer 2023 Pike - Cryene 161kV Maywood - Spencer Creek 345kV 10% 81MWx2 3576 3576
 Fall 2023 Mississippi Tap - Sioux 138kV Loss of Sioux Generation 15% 708MWx2 5380 5380
 Winter 2023/24 Overton 345/161kV Transformer Mc Credie - Overton 345kV None 1000MWx2 3811 3811
 Spring 2024 Calif - Apache Tap 161kV Mc Credie - Montgomery 345kV None 244MWx2 3881 3881
 LRZ6 Monitored Element Contingency GLT RDS ZIA CIL
 Summer 2023 Cayuga Sub - Cayuga 345kV Kansas - Sugar Creek 345kV 20% 619MWx2 8092 8492
 Mount Vernon - West Frankfort
 Fall 2023 Jord - West Frankfort 138kV None 1000MWx2 5670 6070
 345kV
 Winter 2023/24 Cayuga Sub - Cayuga 345kV Kansas - Sugar Creek 345kV None 923MWx2 8418 8818
 Spring 2024 Cayuga Sub - Cayuga 345kV Kansas - Sugar Creek 345kV None 620MWx2 7762 8162
 LRZ7 Monitored Element Contingency GLT RDS ZIA CIL
 Summer 2023 Argenta - Tompkins 345kV Argenta - Battle Creek 345kV 15% 1000MWx2 5087 5087
 Fall 2023 Benton Harbor - Segreto 345kV Cook - Segreto 345kV None 1000MWx2 4285 4285
 Winter 2023/24 Stillwell 345kV/138kV Transformer Dumont - Stillwell 345kV None 1000MWx2 6340 6340
 Spring 2024 Benton Harbor - Segreto 345kV Cook - Segreto 345kV None 1000MWx2 5559 5559
 LRZ8 Monitored Element Contingency GLT RDS ZIA CIL
 Summer 2023 Lyon - Jonestown 115kV Crossroads - Moonlake 230kV None 180MWx2 4091 4139
 Clarksdale - Crossroads
 Fall 2023 Moon Lake - Ritchie 230kV None 372MWx2 4657 4705
 230/115kV Transformer
 Winter 2023/24 Mount Olive - Vienna 115kV Mount Olive - El Dorado 500kV None 1000MWx2 4681 4729
 Spring 2024 Mount Olive - Vienna 115kV Mount Olive - El Dorado 500kV None 181MWx2 4558 4606

 15
One MISO Voice Style Guide
LRZ9 Monitored Element Contingency GLT RDS ZIA CIL
 Summer 2023 Bogalusa - Barkers Corner 230kV McKnight - Franklin 500kV None 1000MWx2 4456 5268
 Fall 2023 Braswell - Franklin 500kV Franklin - Grand Gulf 500kV None 325MWx2 5233 6045
 Winter 2023/24 Camden - Smackover 115kV McNeil - Camden 115kV None 963MWx2 5268 6080
 Spring 2024 Boogalusa 500/230kV Transformer McKnight - Franklin 500kV None 1000MWx2 5438 6250
 LRZ10 Monitored Element Contingency GLT RDS ZIA CIL
 Summer 2023 Braswell - Northside 230kV Braswell - Lakeover 500kV None 38MWx2 3064 3064
 Fall 2023 Braswell - Northside 230kV Braswell - Lakeover 500kV None 33MWx2 2425 2425
 Winter 2023/24 Adams Creek - Angie 230kV Slidel - Logtown 230kV None 134MWx2 2396 2396
 Spring 2024 Hernando - Coldwater 115kV Moonlake - Ritchie 230kV None 31MWx2 2144 2144

 Table 2-3: Planning Year 2023–2024 Import Limits

 MISO PY 2023-2024
 Summer CIL Constraints

 100 – 161 kV

 230 kV

 345kV

 500 kV

 MISO Region

 Existing All kV

 Figure 2-1: Planning Year 2023-2024 Summer Capacity Import Constraints Map

 16
One MISO Voice Style Guide
MISO PY 2023-2024
 Fall CIL Constraints

 100 – 161 kV

 230 kV

 345kV

 500 kV

 MISO Region

 Existing All kV

 Figure 2-2: Planning Year 2023-2024 Fall Capacity Import Constraints Map

 17
One MISO Voice Style Guide
MISO PY 2023-2024
 Winter CIL Constraints

 100 – 161 kV

 230 kV

 345kV

 500 kV

 MISO Region

 Existing All kV

 Figure 2-3: Planning Year 2023-2024 Winter Capacity Import Constraints Map

 18
One MISO Voice Style Guide
MISO PY 2023-2024
 Spring CIL Constraints

 100 – 161 kV

 230 kV

 345kV

 500 kV

 MISO Region

 Existing All kV

 Figure 2-4: Planning Year 2023-2024 Spring Capacity Import Constraints Map

Capacity Exports Limits are found by increasing generation in the study zone and decreasing generation in the rest of
the MISO footprint to create a transfer. Table 2-4 below shows the Planning Year 2023-2024 CEL and ZEA with
corresponding constraint, GLT, and redispatch information.

 19
One MISO Voice Style Guide
LRZ1 Monitored Element Contingency GLT RDS ZEA CEL
Summer 2023 Granville - Butler 138kV Granville - Arcadian 345kV 15% None 3961 3959
 Fall 2023 Arpin - Sigel 138kV Rocky Run - Arpin 345kV None 18MWx2 3806 3804
Winter 2023/24 Arpin - Sigel 138kV Rocky Run - Arpin 345kV None 29MWx2 3503 3501
 Spring 2024 Rocky Run - Werner 345kV Highway 22 - Gardner Park 345kV None 21MWx2 4323 4321
 LRZ2 Monitored Element Contingency GLT RDS ZEA CEL
 Summer 2023 Wempletown 345/138kV Transformer Cherry Valley - Wempleton 345kV 20% None 2550 2550
 Fall 2023 Elm Road - Racine 345kV Base Case None None 3577 3577
Winter 2023/24 Pleasant Prairie - Zion EC 345kV Pleasant Prairie - Zion 345kV 15% None 4198 4198
 Spring 2024 Elm Road - Racine 345kV Base Case None None 3679 3679
 LRZ3 Monitored Element Contingency GLT RDS ZEA CEL
Summer 2023 Mercer - Sandburg 161kV Sandburg - Oak Grove 345kV 45% None 4375 4310
 Fall 2023 Prar Creek - Marion 115 Prar Creek - Bertram 115kV None 147MWx2 4419 4354
Winter 2023/24 Sandburg 161/138kV Transformer Sandburg - Oak Grove 345kV None 109MWx2 7067 7002
 Spring 2024 Sandburg 161/138kV Transformer Sandburg - Oak Grove 345kV 40% None 6238 6173
 LRZ4 Monitored Element Contingency GLT RDS ZEA CEL
Summer 2023 No CEL Found No CEL Found 50% None 9999 9999
 Fall 2023 No CEL Found No CEL Found 50% None 9999 9999
Winter 2023/24 No CEL Found No CEL Found 50% None 9999 9999
 Spring 2024 No CEL Found No CEL Found 50% None 9999 9999
 LRZ5 Monitored Element Contingency GLT RDS ZEA CEL
Summer 2023 No CEL Found No CEL Found 45% None 9999 9999
 Mount Vernon - West Frankfort
 Fall 2023 Jord - West Frankfort 138kV None None 1992 1992
 345kV
Winter 2023/24 Miles Avenue - Moro 138kV Roxford - Moro 345kV 35% 121MWx2 6348 6348
 Spring 2024 Mass 345/161 kV Transformer Joppa - Mass 345kV None None 3724 3724
 LRZ6 Monitored Element Contingency GLT RDS ZEA CEL
Summer 2023 Franscisco - Duff 345kV AB Brown - Reid 345kV 15% 206MWx2 3109 2703
 Fall 2023 Newtonville - Coleman 161kV Duff - Coleman 345kV None 493MWx2 2101 1701
Winter 2023/24 Newtonville- Grandview 138kV Cutley - Dubois 138kV None 42MWx2 1642 1242
 Spring 2024 Newtonville - Coleman 161kV AB Brown - Reid 345kV None 65MWx2 2744 2344
 LRZ7 Monitored Element Contingency GLT RDS ZEA CEL
 Summer 2023 Monroe - Lulu 345kV Monroe - Lallendorf 345kV 25% None 3953 3953

 Fall 2023 Monroe - Lulu 345kV Monroe - Lallendorf 345kV None None 3990 3990

Winter 2023/24 Monroe - Lulu 345kV Monroe - Lallendorf 345kV None None 4350 4350
 Spring 2024 Monroe - Lulu 345kV Monroe - Lallendorf 345kV None None 4413 4413

 LRZ8 Monitored Element Contingency GLT RDS ZEA CEL
Summer 2023 Cash - Jonesboro 161kV Ises - Powerlane Road 500kV 50% 218MWx2 5551 5503
 Fall 2023 Arklahoma - HS EHV 115kV 2 Arklahoma - HS EHV 115kV 2 None 177MWx2 5128 5080
Winter 2023/24 Cash - Jonesboro 161kV Ises - Powerlane Road 500kV 25% 134MWx2 5399 5351
 Spring 2024 Cash - Jonesboro 161kV Ises - Powerlane Road 500kV None 177MWx2 5520 5472

 20
One MISO Voice Style Guide
LRZ9 Monitored Element Contingency GLT RDS ZEA CEL
Summer 2023 Adams Creek - Angie 230kV Slidel - Log Town 230kV None None 2386 1574
 Fall 2023 Wrightsville - Keo 500kV White Bluff - Keo 500kV None None 2338 1526
Winter 2023/24 Adams Creek - Angie 230kV Slidel - Log Town 230kV None None 1689 877
 Spring 2024 Adams Creek - Angie 230kV Slidel - Log Town 230kV None None 3052 2240
 LRZ10 Monitored Element Contingency GLT RDS ZEA CEL
Summer 2023 Andrus 230/115kV Transformer Andrus - Indianola None 510MWx2 1794 1794
 Fall 2023 Clarksdale - Lyon 115kV Crossroads - Moon Lake 230kV None 284MWx2 2878 2878
Winter 2023/24 Batesville - Tallahachie 161kV Choctaw - Clay 500kV None 690MWx2 1980 1980
 Spring 2024 Clarksdale - Lyon 115kV Crossroads - Moon Lake 230kV None 535MWx2 2720 2720

 Table 2-4: Planning Year 2023–2024 Export Limits

 MISO PY 2023-2024
 Summer CEL Constraints

 100 – 161 kV

 230 kV

 345kV

 500 kV

 MISO Region

 Existing All kV

 Figure 2-5: Planning Year 2023-2024 Summer Export Constraint Map

 21
One MISO Voice Style Guide
MISO PY 2023-2024
 Fall CEL Constraints

 100 – 161 kV

 230 kV

 345kV

 500 kV

 MISO Region

 Existing All kV

 Figure 2-6: Planning Year 2023-2024 Fall Export Constraint Map

 22
One MISO Voice Style Guide
MISO PY 2023-2024
 Winter CEL Constraints

 100 – 161 kV

 230 kV

 345kV

 500 kV

 MISO Region

 Existing All kV

 Figure 2-7: Planning Year 2023-2024 Winter Export Constraint Map

 23
One MISO Voice Style Guide
MISO PY 2023-2024
 Spring CEL Constraints
 CEL Constraints
 100 – 161 kV

 230 kV

 345kV

 500 kV

 MISO Region

 Existing All kV

 Figure 2-8: Planning Year 2023-2024 Spring Export Constraint Map

2.3.1 Outyear Analysis
In 2018, MISO and its stakeholders redesigned the outyear LOLE transfer analysis process through the LOLEWG and
Resource Adequacy Subcommittee (RASC). The outyear analysis is now performed after the prompt Planning Year
analyses are complete. The outyear results are informational only. The zones identified for outyear analysis are
determined by BPM-011 criteria. The results will be documented outside of the LOLE report and recorded in RASC
meeting materials in Q2 of 2023 and memorialized at a later date as an addendum to the LOLE report in 2023.

 24
One MISO Voice Style Guide
3 Loss of Load Expectation Analysis
3.1 LOLE Modeling Input Data and Assumptions
MISO uses a program managed by Astrapé Consulting called Strategic Energy & Risk Valuation Model (SERVM) to
calculate the LOLE for the applicable Planning Year. SERVM uses a sequential Monte Carlo simulation to model a
generation system and to assess the system’s reliability based on any number of interconnected areas. SERVM
calculates the LOLE for the MISO system and each LRZ by stepping through the year chronologically and taking into
account generation, load, load modifying and energy efficiency resources, equipment forced outages, planned and
maintenance outages, weather and economic uncertainty, and external support.
Building the SERVM model is the most time-consuming task of the LOLE study. Many scenarios are built in order to
determine how certain variables impact the results. The base case models determine the seasonal MISO PRM
Installed Capacity (ICAP), PRM UCAP, and the LRRs for each LRZ for future Planning Years one, four and six.

3.2 MISO Generation
3.2.1 Thermal Units
The Planning Year 2023-2024 LOLE study used the 2022-2023 PRA converted capacity as a starting point for which
resources to include in the study. This ensured that only resources eligible as a Planning Resources were included in
the LOLE study. An exception was made for resources with a signed GIA with an anticipated in-service date for PY
2023-2024—these resources were also included. All internal Planning Resources were modeled in the LRZ in which
they are physically located. Additionally, Coordinating Owners and Border External Resources were modeled as
being internal to the LRZ in which they are committed to serving load.
Forced outage rates and planned maintenance factors were calculated over a five-year period (January 2017 to
December 2021) and modeled as four seasonal values for each unit. Some units did not have five years of historical
data in MISO’s Generator Availability Data System (PowerGADS)—however, if they had at least 3 consecutive
months of seasonal data, unit-specific information was used to calculate their seasonal forced outage rates and
maintenance factors. Units with fewer than 3 consecutive months of seasonal unit-specific data were assigned the
corresponding MISO seasonal class average forced outage rate and seasonal planned maintenance factor based on
their fuel type. The overall MISO ICAP-weighted seasonal class average forced outage rate and seasonal planned
maintenance factor are applied in lieu of class averages for classes with fewer than 30 units. When the units are
populated into the LOLE model, the weighted outage rate in SERVM may be different from the calculated MISO-wide
weighted average because the MISO-wide weighted average excludes units with insufficient operating history.
Therefore, the weighted outage rate is recalculated to include units that were assigned class average outage rates to
gauge how SERVM views the MISO-wide weighted average. This value is for information only and is not assigned to
any units.
Each nuclear unit has a fixed maintenance schedule, which was pulled from publicly available information and was
modeled for each of the study years.
The historical class average outage rates as well as the MISO system-wide weighted average forced outage rate are
provided in Table 3-1 to show the year-over-year trends, as well as in Table 3-2 on a seasonal basis.

 25
One MISO Voice Style Guide
Pooled EFORd 2017-2021 2016-2020 2015-2019 2014-2018 2013-2017 2012-2016
 GADS Years (%) (%) (%) (%) (%) (%)

 PY 2023-2024 PY 2020-
 LOLE Study PY 2022-2023 PY 2021-2022 PY 2019-2020 PY 2018-2019
 LOLE Study – 2021 LOLE
 Planning Year LOLE Study LOLE Study LOLE Study LOLE Study
 Summer 2023 Study

 Combined Cycle 5.54 5.85 5.52 5.70 5.370 4.62

 Combustion
 Turbine (0-20 23.40 35.20 36.38 40.39 23.18 29.02
 MW)
 Combustion
 Turbine (20-50 6.30 13.65 14.20 15.29 15.76 13.48
 MW)
 Combustion
 Turbine (50+ 4.07 4.36 4.76 4.65 5.18 6.19
 MW)

 Diesel Engines 12.79 7.25 10.05 23.53 10.26 10.42

 Fluidized Bed
 * * * * * *
 Combustion

 Hydro (0-30 MW) * * * * * *

 Hydro (30+ MW) * * * * * *

 Nuclear * * * * * *

 Pumped Storage * * * * * *

 Steam - Coal (0-
 * * * 5.33 4.60 5.14
 100 MW)

 Steam - Coal
 * * * * * *
 (100-200 MW)

 Steam - Coal
 * * 10.47 10.16 9.82 9.77
 (200-400 MW)

 Steam - Coal
 * * * * * *
 (400-600 MW)

 Steam - Coal
 * * * * 8.22 7.90
 (600-800 MW)

 Steam - Coal
 * * * * * *
 (800-1000 MW)

 26
One MISO Voice Style Guide
Steam - Gas 11.26 11.84 12.91 12.54 11.56 11.94

 Steam - Oil * * * * * *

 Steam - Waste
 * * * * * *
 Heat

 Steam - Wood * * * * * *

 MISO Weighted
 8.23 9.04 9.36 9.24 9.28 9.16
 System-wide

 MISO Weighted
 7.64 8.95 9.17 9.22 9.18 -
 as seen in SERVM
 *MISO system-wide weighted forced outage rate used in place of class data for those with less than 30 units
 reporting 12 or more months of data

 Table 3-1: Historical Class Average Forced Outage Rates

 Pooled EFORd
 2017-2021 (%) 2017-2021 (%) 2017-2021 (%) 2017-2021 (%)
 GADS Years
 LOLE Study
 Planning Year Summer 2023 Fall 2023 Winter 2023-2024 Spring 2024
 2023-2024

 Combined Cycle 5.54 8.32 4.70 6.19

 Combustion
 Turbine (0-20 23.40 53.44 42.92 58.75
 MW)
 Combustion
 Turbine (20-50 6.30 16.79 56.52 25.23
 MW)
 Combustion
 Turbine (50+ 4.07 6.60 9.68 4.81
 MW)

 Diesel Engines 12.79 9.32 14.84 8.07

 Fluidized Bed
 * * * *
 Combustion

 Hydro (0-30 MW) * * * *

 Hydro (30+ MW) * * * *

 27
One MISO Voice Style Guide
Nuclear * * * *

 Pumped Storage * * * *

 Steam - Coal (0-
 * * * *
 100 MW)

 Steam - Coal
 * * * *
 (100-200 MW)

 Steam - Coal
 * * * *
 (200-400 MW)

 Steam - Coal
 * * * *
 (400-600 MW)

 Steam - Coal
 * * * *
 (600-800 MW)

 Steam - Coal
 * * * *
 (800-1000 MW)

 Steam - Gas 12.48 13.66 8.28 11.26

 Steam - Oil * * * *

 Steam - Waste
 * * * *
 Heat

 Steam - Wood * * * *

 MISO Weighted
 8.23 9.48 12.47 11.42
 System-wide
 *MISO system-wide weighted forced outage rate used in place of class data for those with less than 30
 units reporting 12 or more months of data

 Table 3-2: Planning Year 2023-2024 Seasonal Class Average Forced Outage Rates

3.2.2 Behind-the-Meter Generation
Behind-the-Meter Generation data came from the Module E Capacity Tracking (MECT) tool. Behind-the-Meter
Generation backed by thermal resources were explicitly modeled just as any other thermal generator with a monthly
capacity and forced outage rate. Performance data was pulled from PowerGADS. Behind-the-Meter Generation
backed by wind or solar resources had their hourly generation tied to the hourly wind and solar profiles in the model.

3.2.3 Attachment Y
MISO obtained information on generating units with approved suspensions or retirements (as of June 1, 2022)
through MISO’s Attachment Y process. Any unit with approved retirement or suspension in Planning Year 2023-2024

 28
One MISO Voice Style Guide
was excluded from the year-one analysis during the months the unit has been approved to be out-of-service for. This
same methodology is used for the four- and six-year analyses.

3.2.4 Future Generation
Future thermal generation and upgrades were added to the LOLE model based on unit information in the MISO
Generator Interconnection Queue. The LOLE model included units with a signed generator interconnection
agreement (as of June 1, 2022). These new units were assigned seasonal class average forced outage rates and
planned maintenance factors based on their particular unit class. Units upgraded during the study period reflect the
megawatt increase for each month, beginning the month the upgrade was finished. The LOLE analysis also included
future wind and solar generation, tied to the same hourly wind and solar profiles used for existing wind and solar
resources in the model.

3.2.5 Intermittent Resources
Intermittent resources such as run-of-river hydro, biomass, wind and solar were explicitly modeled as demand-side
resources. Run-of-river hydro and biomass provide MISO with a minimum of 3 years and up to 15 years of historical
output data during seasonal peak hours, defined as hours ending 15, 16, & 17 EST for summer, fall, and spring, and
hours ending 8, 9, 19, & 20 for winter. This data is averaged at the seasonal level and modeled in the LOLE analysis as
UCAP for all months within a given season. Each individual unit is modeled and put in the corresponding LRZ.
As a process improvement to the LOLE model for this year’s study, in collaboration with the SERVM vendor Astrapé,
hourly wind and solar profiles were developed and introduced into the model to better simulate the variance in
renewable generation on an hourly basis.
Using historical hourly wind data from 246 front-of-meter wind resources from 2013 to 2021, normalized hourly
capacity profiles were developed and aggregated at the LRZ level to represent wind in the model. As a result of the
LOLE analysis being based on 30 weather years (1992 – 2021), synthetic shapes were created for the 1992 – 2013
period based on historical wind performance and temperatures. Once the weather and wind performance matching
has been performed, the data is analyzed as a function of load to ensure the variability around the load profiles is
reasonable.
Solar profiles were developed using historical solar irradiance data from the NREL National Solar Radiation Database
(NSRDB) from 1998 – 2021.
For more details, refer to the supporting documentation Astrapé provided for stakeholders at the LOLEWG detailing
the development of the wind and solar profiles: MISO Seasonal Inputs for the 2022 LOLE Study

3.2.6 Demand Response
Demand response data came from the MECT tool. These resources were explicitly modeled as dispatch-limited
resources. Each demand response program was modeled individually with a monthly capacity, limited to the number
of times each program can be called upon, and limited by duration.

3.3 MISO Load Data
The Planning Year 2023-2024 LOLE analysis used a load training process with neural net software to create a neural-
net relationship between historical weather and load data. This relationship was then applied to 30 years of hourly
historical weather data to create 30 different load shapes for each LRZ in order to capture both load diversity and
seasonal variations. The average monthly loads of the predicted load shapes were adjusted to match each LRZ’s

 29
One MISO Voice Style Guide
Module E 50/50 monthly zonal peak load forecasts for each study year. The results of this process are shown as the
MISO System Peak Demand (Table 4-1) and LRZ Peak Demands (Table 5-1, Table 5-2, Table 5-3, & Table5-4).
Direct Control Load Management and Interruptible Demand types of demand response were explicitly included in
the LOLE model as resources. These demand resources are implemented in the LOLE simulation before accumulating
LOLE.

3.3.1 Weather Uncertainty
MISO has adopted a six-step load training process in order to capture the weather uncertainty associated with the
50/50 load forecasts. The first step of this process requires the collection of five years of historical real-time load
modifying resource (LMR) performance and load data, as well as the collection of 30 years of historical weather data.
Both the LMR and load data are taken from the MISO market for each LBA, while the historical weather data is
collected from the National Oceanic and Atmospheric Administration (NOAA) for each LRZ. After collecting the data,
the hourly gross load for each LRZ is calculated using the five years of historical data.
The second step of the process is to normalize the five years of load data to consistent economics. With the load
growth due to economics removed from 5 years of historical LRZ load, the third step of the process utilizes neural
network software to establish functional relationships between the five years of historical weather and load data. In
the fourth step of the process the neural network relationships are applied to the 30 years of historical weather data
in order to predict/create 30 years’ worth of load shapes for each LRZ.
In the fifth step of the load training process, MISO undertakes extreme temperature verification on the 30 years of
load shapes to ensure that the hourly load data is accurate at extremely hot or cold temperatures. This is required
since there are fewer data points available at the temperature extremes when determining the neural network
functional relationships. This lack of data at the extremes can result in inaccurate predictions when creating load
shapes, which will need to be corrected before moving forward.
The sixth and final step of the load training process is to average the monthly peak loads of the predicted load shapes
and adjust them to match each LR’s Module E 50/50 monthly zonal peak load forecasts for each study year. In order
to calculate this adjustment, the ratio of the first year’s non-coincident peak forecast to the zonal coincident peak
forecast is applied to future year’s non-coincident peak forecast.
By adopting this new methodology for capturing weather uncertainty MISO is able to model multiple load shapes
based off a functional relationship with weather. This modeling approach provides a variance in load shapes, as well as
the peak loads observed in each load shape. This approach also provides the ability to capture the frequency and
duration of severe weather patterns.

3.3.2 Economic Load Uncertainty
To account for economic load uncertainty in the Planning Year 2023-2024 LOLE model, MISO utilized a normal
distribution of electric utility forecast error accounting for projected and actual Gross Domestic Product (GDP), as
well as electricity usage. The historic projections for GDP growth were taken from the Congressional Budget Office
(CBO), the actual GDP growth was taken from the Bureau of Economic Analysis (BEA), and the electric use was taken
from the U.S. Energy Information Administration (EIA). Due to lack of statewide projected GDP data MISO relied on
United States aggregate level data when calculating the economic uncertainty.
In order to calculate the electric utility forecast error, MISO first calculated the forecast error of GDP between the
projected and actual values. The resulting GDP forecast error was then translated into electric utility forecast error

 30
One MISO Voice Style Guide
You can also read