Pachinko/Pachislot Playing Participation in Japan: Results From a National Survey - Journal of ...
←
→
Page content transcription
If your browser does not render page correctly, please read the page content below
Journal of Gambling Issues                           http://igi.camh.net/doi/pdf/10.4309/jgi.2021.46.8
Volume 46, February 2021                                  DOI: http://dx.doi.org/10.4309/jgi.2021.46.8

          Pachinko/Pachislot Playing Participation in Japan:
                  Results From a National Survey

Akiyo Shoun,1 Akira Sakamoto,2 Yukiko Horiuchi,3 Kumiko Akiyama,3
Hitoshi Ishida,4 Kikunori Shinohara,5 Yasunobu Komoto,6 Taku Sato,7
Naoyuki Nishimura,8 & Nobuo Makino9
1
  Graduate School of Humanities and Sciences, Ochanomizu University, Bunkyo-ku,
  Tokyo, Japan
2
  Faculty of Core Research, Human Science Division, Ochanomizu University,
  Bunkyo-ku, Tokyo, Japan
3
  Faculty of Letters and Education, Ochanomizu University, Bunkyo-ku, Tokyo,
  Japan
4
  The Nikkoso Research Foundation for Safe Society, Chiyoda-ku, Tokyo, Japan
5
  Faculty of Engineering, Suwa University of Science, Chino-shi, Nagano, Japan
6
  Yoshino Hospital, Machida-shi, Tokyo, Japan
7
  Naruse Mental Clinic, Machida-shi, Tokyo, Japan
8
  NPO Recovery Support Network, Nishihara-cho, Okinawa, Japan
9
  Japan Women’s University, Bunkyo-ku, Tokyo, Japan

                                       Abstract

To understand individuals’ pachinko/pachislot playing behaviour, one of the major
games in Japan, we conducted a national study of Japanese residents who were
between 18 and 79 years old. From resident records, in which all Japanese citizens
are registered, 9,000 individuals were chosen by the two-stage stratified random
sampling method. A total of 5,060 individuals submitted valid responses (response
rate: 56.2%). Results indicated that 582 (11.5%) played pachinko/pachislot in the last
12 months (‘‘past-year players’’). Compared with ‘‘non-players’’ (those who never
played pachinko/pachislot before or did not play in the last 12 months), past-year
players had higher 12-month participation rates in all 10 gambling activities other
than pachinko/pachislot. To compare demographic variables between the past-year
players and non-players, we performed chi-square tests. Past-year players were more
likely to be men in their 30s, junior high school graduates, and earning a similar
annual household income to the median value for all respondents. Demographic
variables were compared for each participation level and significant differences
between age groups were found: Participants in their 60s and 70s visited pachinko/
pachislot parlours more frequently than did those in their 20s to 40s. This is the first
study to reveal the details of pachinko/pachislot playing behaviour in Japan.

                                          132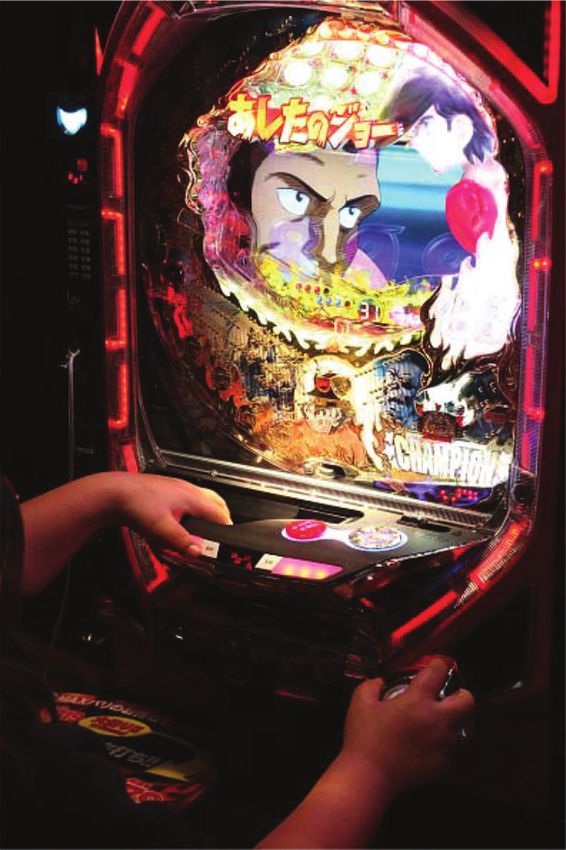
PACHINKO/PACHISLOT PLAYING PARTICIPATION IN JAPAN

Keywords: national survey, gambling, participation, Pachinko, Pachislot, gaming
machine

                                         Résumé

Une enquête nationale a été menée auprès de résidents japonais âgés de 18 à 79 ans
dans le but d’étudier le comportement des joueurs de pachinko/pachislot, l’un des
principaux jeux pratiqués au Japon. À partir du registre de déclaration de résidence,
auquel tous les citoyens du pays sont inscrits, 9000 personnes ont été sélectionnées en
suivant la méthode d’échantillonnage aléatoire stratifié en deux étapes. Sur ce
nombre, 5060 ont donné des réponses valides (taux de réponse : 56,2 %). Selon les
résultats, 582 (11,5 %) ont joué au pachinko/pachislot dans les 12 derniers mois
() joueurs de l’année précédente *). Comparativement aux ) non-joueurs * (à savoir
ceux qui n’ont jamais pratiqué ce jeu dans le passé ou au cours des 12 derniers mois),
les joueurs de l’année précédente affichent sur 12 mois des taux de participation plus
élevés à 10 autres activités de jeux de hasard outre le pachinko/pachislot. Des tests de
chi-square ont été réalisés en vue de comparer les variables démographiques entre
les joueurs de l’année précédente et les non-joueurs. Les premiers étaient plus
susceptibles d’être des hommes dans la trentaine et des diplômés des écoles
intermédiaires, dont le revenu familial annuel se rapprochait de la valeur médiane
pour l’ensemble des répondants. Les variables démographiques ont été comparées
pour chaque niveau de participation, faisant apparaître des différences notables entre
les groupes d’âge : les sexagénaires et les septuagénaires fréquentaient les maisons de
pachinko/pachislot plus souvent que les générations de la vingtaine à la quarantaine.
Cette étude est la toute première à révéler des détails sur les habitudes de jeux de
pachinko/pachislot au Japon.

                                      Introduction

Although gambling is illegal in Japan, six exceptions—horse races, bicycle racing,
powerboat racing, Auto Race, Takarakuji (literally means ‘‘lottery’’), and the Sports
Promotion Lottery (toto)—are legally permitted. Aside from these types of activities,
there are games resembling gambling games, although they are not public, called
pachinko and pachislot (Hirano & Takahashi, 2003). They are different from
gambling games in the sense that no money is directly bet, but because of how
they work, they resemble gambling games. In pachinko and pachislot, players can
exchange their winnings—balls and medals, respectively—for prizes of equal value
inside the parlour. One of these prizes is a special prize, which can be taken to a local
exchange centre outside the parlour and exchanged for cash. In fact, almost 90%
to 95% of players choose to exchange their balls or medals for a special prize

                                            133
PACHINKO/PACHISLOT PLAYING PARTICIPATION IN JAPAN
(Kaji, 2007). There is thus a mechanism that allows individuals to win cash indirectly
by playing pachinko or pachislot, and these games seem to resemble gambling games.
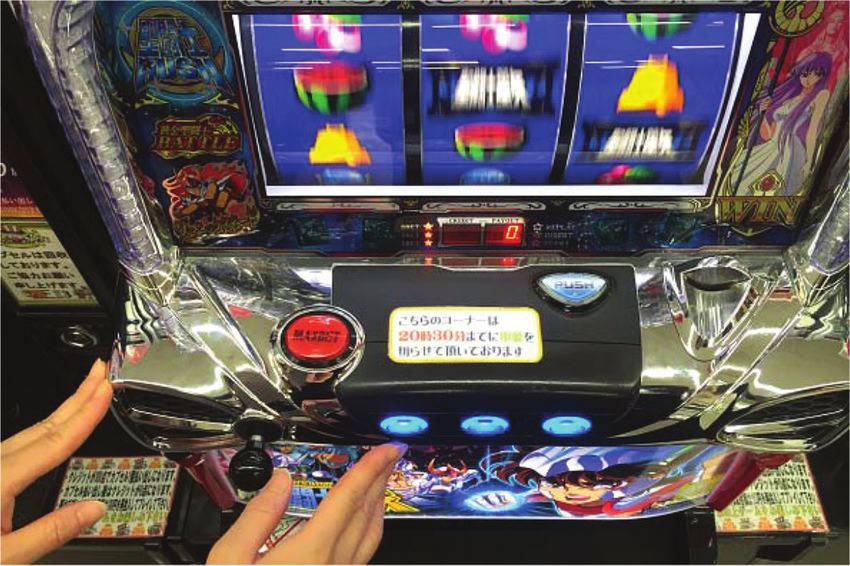
To play pachislot, players first pay money to borrow medals. They put the medals in
a machine and press the knob down. The knob movement triggers a lucky draw
inside the machine. If players win the lucky draw, they can press the buttons to try to
match pictures on reels. They receive different numbers of medals depending on
which pictures are matched. Although a pachislot machine differs from an electronic
gaming machine (EGM) in that it is equipped with buttons to stop the reels, the two
machines are similar because both involve the matching of pictures (Figure 1).
Players pay money to borrow small balls to play pachinko. A pachinko machine
looks like a vertical pinball machine. Players pour the balls into the machine and
turn a handle to shoot the balls up into the board. Balls fall from the top while
running through a maze of pins. Players try to put as many balls as possible in a gate
that activates a slot machine. Although players can receive balls if they are
successful, a machine opens an even larger gate at a set time that players can take
advantage of to win more balls (Brooks et al., 2008; Figure 2).
Although pachinko and pachislot have different machine mechanisms and playing
methods, they are similar in that they are machine games and not table games. They
are electronically controlled, and the price of balls and medals is legally decided.
Many parlours have both pachinko and pachislot machines, and players can play
both games in these venues. Furthermore, according to Ziolkowski (2018), pachinko
and pachislot machines are defined as gaming machines because of two
characteristics: They are designed entirely or partially as chance-based games that
require skill in some areas, and they are designed for games that involve payment of
money or tokens or that record rights to an equivalent amount of money.
Figure 1
An example of a Pachislot gaming machine at a Pachinko parlour in Japan.
134PACHINKO/PACHISLOT PLAYING PARTICIPATION IN JAPAN
Figure 2
An example of a Pachinko gaming machine at a Pachinko parlour in Japan.
According to some previous studies, however, these characteristics are likely to cause a
disorder. Brooks et al. (2008) reported that pachinko is a continuous, rapid, and
frequently played game with an element of skill and is more closely connected to problem
gambling than are other gambling games. It provides a large number of opportunities to
play in a given time period (e.g., a pachislot can play about 15 times per minute.)
Japanese surveys have also reported that individuals spent more money on pachinko
or pachislot than on any other gambling games when they gambled most frequently
(Cabinet Meeting on Anti-Gambling Addition Measure Promotion, 2017). Spending
a lot of money on pachinko or pachislot may harm not only the players themselves,
but also their family members, relatives, friends, or work relationships. The impact is
serious. There are also non-financial issues. For example, an individual may visit a
pachinko/pachislot parlour with his or her child and leave the child inside a car while
playing pachinko or pachislot because individuals under 18 years old cannot enter
the parlour. The child may suffer heatstroke, resulting in death. Such incidents occur
repeatedly and have developed into social issues (Kaji, 2007, 2014).
For pachinko and pachislot that have the characteristics described earlier, only a
limited number of studies have been done to clarify how individuals interact with
these games. Pachinko/pachislot studies have been conducted in Japan. For example,
the Japan Productivity Center publishes the White Paper on Leisure, which examines
135PACHINKO/PACHISLOT PLAYING PARTICIPATION IN JAPAN
leisure activities engaged in by 3,000 Japanese residents from 15 to 79 years old.
A total of 108 leisure activities are studied and pachinko is one of them. For each
leisure activity, the number of participants, annual average activity frequency,
annual average spending, and market size are reported every year. Note, however,
that the White Paper does not provide any further details on playing behaviour,
including the amount of investment, amount of loss, or demographic variables of the
individuals studied (Japan Productivity Center, 2018).
Another example is the Survey on Time Use and Leisure Activities conducted every
5 years by the Ministry of Internal Affairs and Communications. The survey defines
‘‘hobbies and entertainment’’ as activities that individuals engage in during their free
time, not obligatory activities such as work, study, or housework. Hobbies and
entertainment are divided into 34 categories, and respondents are asked whether or
not they engaged in these activities in the last 12 months. These 34 categories include
pachinko, and the 2016 survey reported the percentage of respondents (of 200,000
individuals across the country who were 10 years or older) who had played (Ministry
of Internal Affairs and Communications, 2017a). This survey, however, does not
provide detailed results on playing behaviour or survey respondents.
Another survey is conducted by an electronic device manufacturer that sells products
to pachinko/pachislot parlours. The company reported various data, including the
number of active units and the amount of sales (Daikoku Denki Co., Ltd., 2018)
from sales data submitted by its contracting companies. Here it should be noted that
this report shows the results of tabulation of sales data collected from each parlour.
Although it allows estimation of sales and playing time nationwide, unclarified
attributes of individuals and inadequate sampling quality pose problems because
contracting companies are the only source of data.
For this reason, in the present study, we studied playing behaviour in detail, analysed
demographic variables of the study participants, and conducted a national survey of
participants sampled by an appropriate method. We aimed to discuss how indivi-
duals interact with pachinko/pachislot in Japan by (1) examining pachinko/pachislot
playing behaviour and (2) comparing pachinko/pachislot participation in Japan and
gambling participation in other countries.
Method
Participants
A total of 5,060 participants submitted valid responses (2,400 men and 2,660 women)
in January to February, 2017.
Sampling
To study 9,000 individuals, we performed two-stage stratified random sampling.
First, we divided the population of Japanese residents between 18 and 79 years old as
136PACHINKO/PACHISLOT PLAYING PARTICIPATION IN JAPAN
of January 2016 according to the Basic Resident Register (a municipality-based
resident record collection that registers all Japanese residents) across the country into
44 strata, that is, four population strata each divided into 11 regional strata. Use of
the Basic Resident Register can reduce the coverage error, which indicates a
difference between the population and the sampling frame. Second, we defined
‘‘a location’’ as an area that can be covered by a door-to-door investigator and decided
to have 25 such investigators. As a result, there were 360 locations (9,000 divided by
25). We proportionally distributed these 360 locations into the 44 strata on the basis
of their population (‘‘stratification’’). Third, we randomly sampled locations in each
stratum across the country. Finally, we randomly sampled 25 residents from each
location by using the Basic Resident Register (two-stage stratified random sampling).
This sampling method is very common in Japanese social surveys and is considered
to be an excellent technique. The number of valid responses was 5,060 (56.2%).
Procedure
We first sent out postcards with a request for survey participation to the sampled
individuals. A package with a hard copy questionnaire and a document about online
participation was then mailed to them. After offering participants the option of
responding by mail or online, door-to-door investigators visited them to request their
participation. Responses could be delivered online, by returning the questionnaire by
mail, or by handing the questionnaire to a door-to-door investigator. This procedure
is the standard social survey method in Japan, called the ‘‘drop-off and pick-up
method,’’ but with the addition of a pre-posting step (Fukuda, 2009; Jackson-Smith
et al., 2016). Respondents who submitted answers received a 1,000-yen prepaid card
as a reward. This survey was performed while hiding its actual purpose—to examine
gambling or pachinko/pachislot playing behaviour—in order to prevent bias regarding
the rate of reporting by participants who had pachinko/pachislot experience. This
study was approved in advance by the Ethics Committee of the first author’s university.
Measures
Demographic Variables
Gender, age group, education, annual income, and place of residence were used in our
analysis. The Basic Resident Register was used to obtain information on the gender
and age of the participants. Age was stratified into age groups in 10-year increments.
Participants indicated their level of education as either junior high school, senior high
school, vocational training school or 2-year college, and university or graduate school.
For annual household income, defined as the annual income made by family
members, the participants selected from 14 categories from less than a million yen to
13 million yen or more divided by increments of a million yen. For the purpose of
137PACHINKO/PACHISLOT PLAYING PARTICIPATION IN JAPAN
analysis, these categories were integrated into four categories: less than 3 million yen,
3 million to less than 5 million yen, 5 million to less than 8 million yen, and 8 million
yen or more.
Place of residence was divided into four categories by size: major city/Tokyo 23 ward,
city with population of 150,000 or more, city with population under 150,000, and town/
village. Categorization was based on data provided by local governments randomly
selected in the first stage of the two-stage stratified random sampling.
Pachinko/Pachislot Experience
The participants reported their past pachinko/pachislot experience by using a 3-point
scale that included once a week or more, less than once a week, and never played
before. For those who had played before, we asked when they last played.
Participants used a 7-point scale from 5 years ago or before to less than a month ago
to provide the answer.
Past Public Sports and Lottery Experience
The participants reported their past experience of playing the nine types of public
sports and lotteries by using a 3-point scale that included once a week or more, less
than once a week, and never played before.
Pachinko/Pachislot Participation Levels
For those who played pachinko less than a year ago, we measured four types of
participation levels.
Frequency. The frequency of going to a pachinko/pachislot parlour was measured
by using a 9-point scale from less than once a year to four times a week or more.
Time. The average amount of time spent playing pachinko/pachislot in a day for
the last 12 months was measured by using a 9-point scale from less than an hour to 8
hours or longer.
Wager. The average amount of money invested in pachinko/pachislot per month
for the last 12 months was measured by using a 9-point scale from 5,000 yen or less to
over 200,000 yen. For example, if 10,000 yen in cash was invested, the wager would be
10,000 yen regardless of the amount of wins or losses.
Loss. The average amount of loss per month for the last 12 months was
measured by using a 10-point scale from no losses to over 200,000 yen. For example,
if 10,000 yen in cash was invested and a player ended up with 8,000 yen, the loss would
be 2,000 yen.
138PACHINKO/PACHISLOT PLAYING PARTICIPATION IN JAPAN
Analyses
Participation Rates
The percentage of respondents who participated in pachinko/pachislot was
calculated with 5,060 as the denominator, which was the number of all participants,
including those who did not respond. The gender-specific participation rates were
obtained by using the denominator 2,400 for men and 2,660 for women, including
those who did not respond. The category-specific participation rates for age group,
education, annual household income, and place of residence were also calculated by
using the number of all respondents in each category.
Distribution of Past-Year Players by Demographic Variable
Chi-square tests were performed to identify any biases in distributions of past-year
players and non-players for each demographic variable, which included gender, age
group, education, annual household income, and place of residence. Data from
individuals who did not respond were excluded from analysis. The demographic
variables were adjusted based on population statistics. Gender and age group were
adjusted based on the 2017 population estimated from the Population Census that is
conducted every 5 years (Ministry of Internal Affairs and Communications, 2018b).
To adjust education, we used data from the 2017 Employment Status Survey issued
by the Bureau of Statistics (Ministry of Internal Affairs and Communications,
2018a). We referred to the 2016 Overview of the National Livelihood Survey to
adjust the annual household income (Ministry of Health, Labour and Welfare,
2018). Finally, we adjusted residence by using the values in the 2015 Population
Census (Ministry of Internal Affairs and Communications, 2017b).
Comparison of Participation Levels by Demographic Variable
We examined whether the four types of participation levels (frequency, time, wager,
and loss) of past-year players differed by demographic variable, which included
gender, age group, education, annual household income, and place of residence. The
Mann-Whitney U test was used for gender and the Kruskal-Wallis test for other
demographic variables.
Results
Pachinko/Pachislot Participation Rate
Among the 5,060 respondents, 582 (11.5%) played pachinko/pachislot in the
last 12 months (past-year players), 4,457 (88.1%) had never played pachinko/
pachislot before or did not play in the last 12 months (non-players), and 21 did not
provide an answer.
139PACHINKO/PACHISLOT PLAYING PARTICIPATION IN JAPAN
Rates of Participation in Other Gambling Activities
Table 1 shows the rates of participation in other gambling activities by past-year
players and non-players. Among the past-year players, Takarakuji had the highest
participation rate of 39.5%, followed by horse racing, accounting for 17.4%.
Among the non-players, Takarakuji and LOTO accounted for a 31.4% and 8.7%
participation rate, respectively. Compared with non-players, past-year players had
higher participation rates in all gambling activities.
Pachinko/Pachislot Participation Rate of Past-Year Players and Their Distribution by
Demographic Variable
Gender
The percentage of past-year players was calculated for each gender. As seen in
Table 2, male and female past-year pachinko/pachislot players accounted for 18.3%
and 5.4% of all participants, respectively.
Furthermore, a w2 test was conducted to find any distribution biases between genders
for past-year players and non-players. The result was significant at a level of 0.1%
(w2 = 206.332, df = 1, n = 5,039, p o .001, Cramer’s V = .20). Examination of the
adjusted standardized residuals indicated that the number of men was significantly
high among the past-year players.
Age Group
The percentage of past-year players was calculated for each age group. As seen in
Table 2, it was the highest in the 30s; 15.8% of respondents in this age group were
past-year players.
Table 1
Gambling Participation Rates (%) for the Last 12 Months for Past-Year Players
and Non-players
Past-year players (%) Non-players (%)
Type of gambling (n = 582) (n = 4,457)
Horse racing 17.4 5.5
Bicycle racing 4.0 0.8
Powerboat racing 5.3 1.2
Auto Race 2.1 0.4
Takarakuji 39.5 31.4
Numbers 12.4 6.5
LOTO 13.7 8.7
Sports Promotion Lottery 8.4 3.6
Casino 2.7 0.8
140Table 2
Twelve-Month Gambling Participation Rates (%) by Demographic Variable and Past-Year Player and Non-player Distributions
Total Past-year players Non-players N/A
Demographic variablea n n (%) n (%) n (%)
Total 5,060 582 (11.5) 4,457 (88.1) 21 (0.4)
Gender
Male 2462.19 450.38*** (18.3) 1996.43 (81.1) 15.39 (0.6)
Female 2597.81 139.66 (5.4) 2452.29*** (94.4) 5.86 (0.2)
Age group
Teens 128.54 7.49 (5.8) 121.06*** (94.2) 0.00 (0.0)
20s 654.11 83.79 (12.8) 567.62 (86.8) 2.70 (0.4)
30s 783.60 123.95*** (15.8) 658.57 (84.0) 1.08 (0.1)
40s 987.60 116.01 (11.7) 870.58 (88.2) 1.01 (0.1)
50s 822.95 97.34 (11.8) 725.61 (88.2) 0.00 (0.0)
60s 926.25 112.17 (12.1) 811.60 (87.6) 2.47 (0.3)
70s 756.95 45.96 (6.1) 697.86*** (92.2) 13.13 (1.7)
141
Education
Junior high school 815.11 136.51*** (16.7) 669.32 (82.1) 9.28 (1.1)
Senior high school 1935.96 245.54 (12.7) 1682.60 (86.9) 7.83 (0.4)
Vocational training school/2-year college 913.94 76.98 (8.4) 834.27*** (91.3) 2.69 (0.3)
University/graduate school 1094.99 102.33 (9.3) 991.71*** (90.6) 0.96 (0.1)
Annual household income
Less than 3 million yen 1192.14 128.56 (10.8) 1059.68 (88.9) 3.90 (0.3)
3 million to less than 5 million yen 844.88 109.58* (13.0) 731.95 (86.6) 3.35 (0.4)
PACHINKO/PACHISLOT PLAYING PARTICIPATION IN JAPAN
5 million to less than 8 million yen 816.24 97.63 (12.0) 717.73 (87.9) 0.88 (0.1)
8 million yen or more 723.16 59.93 (8.3) 663.23* (91.7) 0.00 (0.0)
Place of residence
Major city/Tokyo 23 ward 1463.92 156.81 (10.7) 1299.43 (88.8) 7.68 (0.5)
City with population of 150,000 or more 1565.83 161.81 (10.3) 1399.93 (89.4) 4.10 (0.3)
City with population under 150,000 1594.00 199.60 (12.5) 1386.09 (87.0) 8.32 (0.5)
Town/village 436.25 60.20 (13.8) 375.12 (86.0) 0.93 (0.2)
Note. N/A = not available.
a
The demographic variables were adjusted on the basis of the population statistics.
Values were significantly higher than the expected values as a result of residual analysis, *po.05, ***po.001.PACHINKO/PACHISLOT PLAYING PARTICIPATION IN JAPAN
A w2 test of past-year players and non-players for each age group was then
performed. The calculation resulted in statistical significance at a level of 0.1% (w2 =
40.425, n = 5,039, df = 6, p o .001, Cramer’s V = .09). Examination of the adjusted
standardized residuals that followed showed that, compared with the number of non-
players, the number of past-year players was significantly high among those in their
30s and significantly low among those in their teens and 70s.
Education
The percentage of past-year players was calculated for each education level. As seen
in Table 2, it was the highest for the junior high school level; 16.7% of respondents
who were junior high school graduates were past-year players.
A w2 test of past-year players and non-players for each education level was perfor-
med. The result indicated statistical significance at a level of 0.1% (w2 = 38.077,
df = 3, n = 4,741, p o .001, Cramer’s V = .09). The adjusted standardized residuals
were then examined and showed that the number of past-year players whose final
education was junior or senior high school was significantly higher than it was for
non-players, but the number of past-year players whose final education was voca-
tional training school, 2-year college, university, or graduate school was significantly
lower than it was for non-players.
Annual Household Income
The percentage of past-year players was calculated for each annual household income
range. As seen in Table 2, it was the highest in the 3 million to less than 5 million yen
income range; 13.0% of respondents within this range were past-year players.
A w2 test of past-year players and non-players for each annual household income
range was then performed. It resulted in statistical significance at a level of 5%
(w2 = 9.681, df = 3, n = 3,572, p o .05, Cramer’s V = .05). Examination of the
adjusted standardized residuals indicated that, compared with the number of non-
players, the number of past-year players was significantly higher in the 3 million to
less than 5 million yen income range but significantly lower in the 8 million yen or
more income range. Since the median range for annual household income for all
5,060 participants was 4 million to less than 5 million yen, many past-year players
fell in approximately the same income range as the median range for all participants.
Place of Residence
The percentage of past-year players was calculated for each place of residence.
As seen in Table 2, it was highest in the town/village category, accounting for 13.8%
of respondents within this category.
142PACHINKO/PACHISLOT PLAYING PARTICIPATION IN JAPAN
A w2 test of past-year players and non-players for each place of residence category
was performed, but no statistically significant difference was indicated (w2 = 6.931,
df = 3, n = 5,039, ns).
Comparison of Participation Levels by Demographic Variable
We conducted an additional analysis only for past-year players by using four
pachinko/pachislot participation levels as dependent variables. First, we obtained
median values for each type of participation level. The median values for the
frequency of going to a pachinko/pachislot parlour was two to three times/month,
time spent playing was 3–4 hours, the amount spent was 10,000–20,000 (JPY), and
the amount of loss was 5,000–10,000 (JPY) (Table 3).
Next, for each of the four pachinko/pachislot participation levels, the demographic
data of past-year players was compared for each variable: gender, age group,
education, income, and place of residence (Table 3). The result for each independent
variable is as follows.
Gender
There were no significant gender differences for all participation levels (frequency:
Mann-Whitney U = 28767.5, ns; time: U = 29522.0, ns; wager: U = 27880.0, ns; loss:
U = 28751.0, ns).
Age Group
Significant age-group differences were found in the frequency of going to a pachinko/
pachislot parlour (Kruskal-Wallis test, w2 = 31.613, df = 6, p o .001, Z2 = .05). The
Bonferroni multiple comparison test indicated a higher frequency for those in their 60s
and 70s than for their counterparts in their 20s, 30s, or 40s. There were no significant
age-group differences for any other participation levels (Kruskal-Wallis test, time:
w2 = 11.364, df = 6, ns; wager: w2 = 2.876, df = 6, ns; loss: w2 = 10.081, df = 6, ns).
Education
Education did not make any difference for any participation levels (Kruskal-Wallis
test, frequency: w2 = 2.811, df = 3, ns; time: w2 = 4.917, df = 3, ns; wager: w2 = 2.209,
df = 3, ns; loss: w2 = 1.964, df = 3, ns).
Annual Household Income
No significant annual household income differences were found for any participation
levels (Kruskal-Wallis test, frequency: w2 = 2.811, df = 3, ns; time: w2 = 4.917, df = 3,
ns; wager: w2 = 2.209, df = 3, ns; loss: w2 = 1.964, df = 3, ns).
143Table 3
Median Pachinko/Pachislot Participation Levels by Demographic Variable for Past-Year Players
Participation level (median value)
Demographic variable Frequency Time (hr) Spending (JPY) Loss (JPY)
Past-year players 2–3 times/month 3–4 10,000–20,000 5,000–10,000
Gender
Male 2–3 times/month 3–4 10,000–20,000 5,000–10,000
Female 2–3 times/month 3–4 10,000–20,000 5,000–10,000
Age group
Teens 2–3 times/month 2–3 20,000–40,000 No losses
20s Once a month*** 3–4 5,000–10,000 5,000–10,000
30s 2–3 times/month*** 3–4 10,000–20,000 5,000–10,000
40s 2–3 times/month*** 3–4 10,000–20,000 5,000–10,000
50s 2–3 times/month 3–4 10,000–20,000 5,000–10,000
60s Once a week*** 2–3 10,000–20,000 5,000–20,000
144
70s Once a week*** 2–3 10,000–20,000 10,000–20,000
Education
Junior high school 2–3 times/month 2–3 10,000–20,000 5,000–10,000
Senior high school 2–3 times/month 3–4 10,000–20,000 5,000–10,000
Vocational training school/2-year college 2–3 times/month 3–4 10,000–20,000 5,000–10,000
University/graduate school 2–3 times/month 2–3 10,000–20,000 5,000–10,000
Annual household income
Less than 3 million 2–3 times/month 3–4 10,000–20,000 5,000–10,000
3 million to less than 5 million 2–3 times/month 2–3 10,000–20,000 10,000–20,000
PACHINKO/PACHISLOT PLAYING PARTICIPATION IN JAPAN
5 million to less than 8 million 2–3 times/month 3–4 10,000–20,000 5,000–10,000
8 million or more 2–3 times/month 2–3 10,000–20,000 10,000–20,000
Place of residence
Major city/Tokyo 23 ward 2–3 times/month 3–4 10,000–20,000 5,000–10,000
City with population of 150,000 or more 2–3 times/month 3–4 10,000–20,000 5,000–10,000
City with population under 150,000 2–3 times/month 3–4 10,000–20,000 5,000–10,000
Town/village 2–3 times/month 3–4 10,000–20,000 10,000-20,000
***po.001 indicates a significant difference between categories.PACHINKO/PACHISLOT PLAYING PARTICIPATION IN JAPAN
Place of Residence
Place of residence produced no significant differences in participation levels
(Kruskal-Wallis test, frequency: w2 = 7.454, df = 3, ns; time: w2 = 2.835, df = 3,
ns; wager: w2 = 2.473, df = 3, ns; loss: w2 = 5.369, df = 3, ns).
Discussion
Pachinko/Pachislot Playing Behaviour
Past-year players, defined as those who played pachinko/pachislot in the last
12 months, accounted for 11.5% of all participants. Since the 18- to 79-year-old
Japanese population as of the base sampling date was 96,337,130, we estimated that
there were 11 million past-year players in the general population. We also found that
past-year pachinko/pachislot players had higher rates of participation in public
sports and lotteries.
The distribution of past-year players suggested that, unlike the non-players, many
were men in their 30s, were junior high school graduates, and fell in the annual
household income range of 3 to 5 million yen. Comparison of their income with the
median value for the 5,060 study participants suggested that many past-year players
had a standard annual household income.
Regarding participation levels, median values for past-year players were two to three
times a month for frequency, 3 to less than 4 hours for the time spent on playing,
more than 10,000 to 20,000 yen for the wager, and losses of more than 5,000 to
10,000 yen.
When demographic data were compared within each variable for each participation
level, the past-year players in their 60s and 70s went to a pachinko/pachislot parlour
more frequently than did their counterparts in their 20s to 40s.
Comparison With Gambling Participation in Other Countries
Ziolkowski (2018) defined pachinko and pachislot machines as gaming machines
similar to slot machines, video lottery terminals, and video gaming machines because
of their characteristics and stated that slot machines fell into the same category as
fruit machines, pokies, and jackpot machines. On the basis of this notion, we
compared player participation rates and wagers between pachinko and pachislot
machines, EGMs, slot machines, and jackpot machines.
Gambling Participation Rate
According to a study by the University of Macau (2016) on the gambling
participation rate of Macanese residents, 6.5% responded that they had played a slot
machine in the past year. The National Council on Problem Gambling (2018)
145PACHINKO/PACHISLOT PLAYING PARTICIPATION IN JAPAN
reported that, in a 2017 study of Singaporean residents, 1% of them had played a
jackpot machine at a local casino, 1% at a local club, and 2% during a cruise or outside
Singapore in the past year. Williams et al. (2013) conducted a survey of Korean
residents in 2011 and reported that 0.4% of them had played a slot machine at a casino
in the past year. In a 2011–2013 gambling participation study by Welte et al. (2015),
17.4% of all study participants living in the United States had played a slot machine
(but not at a casino) in the past year. Furthermore, the 2010–2011 study suggested that
19.43% of Australian residents had played an EGM in the past year, and a 2012 study
reported that 8.4% of residents of New Zealand had played an EGM at a casino,
12.2% at a pub, and 5.7% at a club in the past year (Abbott et al., 2014; Armstrong
et al., 2018). In our study, 11.5% of all respondents said they had played pachinko/
pachislot in the past year. Compared with that of the three Asian countries and
regions, the rate of pachinko/pachislot participation by Japanese residents was higher,
although participation in gambling is controlled in Korea and Singapore, possibly
influencing the participation rate of each country. More specifically, Korea has only
one casino accessible to Korean residents, and Singaporean residents must pay an
expensive admission fee and pass a strict ID check to gamble. Nevertheless, the rate of
pachinko/pachislot participation by Japanese residents was the fourth highest after the
pub-based EGM participation rates by Australian, American, and New Zealand
residents. The Japanese pachinko/pachislot participation rate may be heightened by
the fact that Japanese pachinko/pachislot parlours are admission free and highly
accessible, being located everywhere across the country.
Gender Differences in Gambling Participation Rates
In New Zealand, there was no gender difference in the EGM playing rate (Abbott
et al., 2014). In Japan, on the other hand, more men than women played pachinko/
pachislot. However, we found no gender differences among past-year players in any
of the participation levels. This means that, despite there being no gender differences
in playing behaviour, there were large differences in the phase prior to that when
individuals decided whether or not they would play. This seems to be a characteristic
of pachinko/pachislot playing behaviour in Japan.
Traditionally, a game hall was considered to be ‘‘the men’s place’’ and women would
feel unwelcome. Similar opinions were still present in studies conducted in the 2000s
(Entertainment Business Institute Co., Ltd., 2004; Yamada & Imaizumi, 2002).
According to a study by the Japan Federation of Game Business Cooperatives
(2017), in half of the cases, individuals entered a game hall for the first time with their
friends or acquaintances who invited them. This led us to speculate that the flow of
male players inviting new male players has been maintained and expressed in the
different participation rates between genders.
Gambling Participation Rates by Income
The New Zealand study found that the general gambling participation rate was
proportional to income level. The rate of participation in non-casino EGM games,
146PACHINKO/PACHISLOT PLAYING PARTICIPATION IN JAPAN
however, was higher for the low-income population. Furthermore, the preferred type
of gambling varied by income group: The high-income population preferred horse
races and dog races, whereas the low-income population preferred non-casino EGM
games (Abbott et al., 2014). In Japan, the rate of pachinko/pachislot participation
was higher for individuals whose annual household income was roughly the same as
the median value. This finding suggests that pachinko/pachislot is a type of enter-
tainment for the middle-class and that there were almost no differences in partici-
pation rates by the financial standing of individuals.
Comparison of Wagers
We compared wagers on gambling activities in the past year between countries. In
Macau, the median value for monthly wagers on slot machines was 200 MOP
(approximately 3,000 JPY). In New Zealand, the average monthly wager on casino
EGMs was 52.28 NZD (approximately 4,000 JPY) and the average monthly wager
on non-casino EGMs was 48.9 NZD (about 3,700 JPY; Abbott et al., 2014; University
of Macau, 2016). In Australia, the average annual participant expenditure on EGMs
was 3,817 AUD (about 313,000 JPY), which was 318 AUD (about 26,000 JPY) per
month (Armstrong et al., 2018). Our study showed that the median value for a
monthly wager on pachinko/pachislot per past-year player fell in the range of more
than 10,000 to 20,000 yen.
According to the International Labour Organization ILOSTAT database (2018), the
average monthly income in the year (or near the year) in previous studies was 15,000
MOP in Macau (2016), 4,420 NZD in New Zealand (2014), 5,528 AUD in Australia
(2014), and 304,000 JPY in Japan (2016). The wager represented the following
percentages of the monthly income: 1.3% in Macau, 1.2% for casino EGMs and
1.1% for non-casino EGMs in New Zealand, 5.8% in Australia, and between 3.3%
and 6.6% in Japan if the monthly wager on pachinko/pachislot was in the range of
more than 10,000 to 20,000 yen. Although a study limitation was that the expen-
ditures in Australia and New Zealand were average values and the expenditures in
Macau and Japan (in the present study) were median values, the wager on pachinko/
pachislot in Japan could nonetheless be estimated to be higher than New Zealand
and Macau but about the same level as Australia.
Representativeness of the Sample
In this study, we used a low-coverage error sampling method. To collect survey
responses, we offered multiple response options such as sending by mail or via the
website in addition to the drop-off and pick-up method. As a result, the valid
response rate was 5 percentage points higher (56.2%) than a well-known Japanese
social survey (Nakamura et al., 2015; Shirahase, 2018). Therefore, a low-coverage
error sampling method and multiple response options were adopted to increase
the response rate, and we believe that the maximum representativeness of the sample
was secured.
147PACHINKO/PACHISLOT PLAYING PARTICIPATION IN JAPAN
Conclusion
In the present study, we conducted a pachinko/pachislot survey of a general
population sampled from across Japan. Examination of the pachinko/pachislot
participation rate and the characteristics of past-year players led us to identify their
playing behaviour. The study results showed that past-year players were often men in
their 30s with low education and an average annual income, who had a high
participation rate in other types of gambling activities. This finding suggests that
these players constitute a group prone to the risks of problem gambling, and active
interventions and awareness-raising programs would effectively prevent them from
problem gambling. These interventions and programs should encourage players
to engage in a responsible play style or recommend seeking treatment when they
have problems.
Although previous studies have uncovered gambling behaviour in various countries,
no detailed examinations have been reported for playing behaviour in Japan.
The present study was designed to accomplish such a detailed examination.
References
Abbott, M., Bellringer, M., Garrett, N., & Mundy-McPherson, S. (2014). New
Zealand 2012 National gambling study: Overview and gambling
participation. Auckland University of Technology. https://www.health.govt.nz/
system/files/documents/publications/national-gambling-study-report-1.pdf
Armstrong, A. R., Thomas, A., & Abbott, M. (2018). Gambling participation,
expenditure and risk of harm in Australia, 1997-1998 and 2010-2011. Journal of
Gambling Studies, 34(1), 255–274. https://doi.org/10.1007/s10899-017-9708-0
Brooks, G., Ellis, T., & Lewis, C. (2008). Pachinko: A Japanese addiction?
International Gambling Studies, 8(2), 193–205. https://doi.org/10.1080/
14459790802168958
Cabinet Meeting on Anti-Gambling Addiction Measure Promotion. (2017).
Organizing discussion points for strengthening of anti-gambling addiction measures.
https://www.kantei.go.jp/jp/singi/gambling_addiction/
Daikoku Denki Co., Ltd. (2018). DK-SIS white paper 2018.
Entertainment Business Institute Co., Ltd. (2004). 2004 Participation survey of
Pachinko.
Fukuda, S. (2009). Leaving the parental home in post-war Japan: Demographic
changes, stem-family norms and the transition to adulthood. Demographic
Research, 20, 731–816. https://doi.org/10.4054/DemRes.2009.20.30
148PACHINKO/PACHISLOT PLAYING PARTICIPATION IN JAPAN
Hirano, K., & Takahashi, K. (2003). Trends of Japan’s giant leisure industry:
Pachinko. Gaming Research & Review Journal, 7(2). https://digitalscholarship.unlv.
edu/grrj/vol7/iss2/5/
International Labour Organization. (2018). ILOSTAT (ILO database of labour
statistics): Monthly earnings. http://www.ilo.org/global/statistics-and-databases/
lang--en/index.htm
Jackson-Smith, D., Dolan, M., Holyoak, G., Flint, C. G., Trentelman, C. K.,
Thomas, B., & Ma, G. (2016). Effectiveness of the drop-off/pick-up survey
methodology in different neighborhood types. Journal of Rural Social Sciences,
31(3), 35–67. https://egrove.olemiss.edu/jrss/vol31/iss3/3/
Japan Federation of Game Business Cooperatives. (2017). A survey on fans 2017.
http://www.zennichiyuren.or.jp/assets/files/2017/07/kensen777_questionnaire_sum.
pdf
Japan Productivity Center. (2018). White paper on leisure 2018.
Kaji, H. (2007). Present-day problems and measures in the pachinko parlor industry.
The Social Science, 78, 23–47. doi/10.14988/pa.2017.0000011098
Kaji, H. (2014). Pachinko’s appearance, spread and influence in Japan. The Social
Science, 44(2), 75–104. doi/10.14988/pa.2017.0000013664
Ministry of Health, Labour and Welfare. (2018). 2016 Overview of the National
Livelihood Survey. https://www.mhlw.go.jp/toukei/saikin/hw/k-tyosa/k-tyosa16/
index.html
Ministry of Internal Affairs and Communications. (2017a). 2016 Survey on Time Use
and Leisure Activities. http://www.stat.go.jp/data/shakai/2016/kekka.htm
Ministry of Internal Affairs and Communications. (2017b). 2017 Population Census:
Statistics by prefecture and municipality. http://www.stat.go.jp/data/kokusei/2015/
kekka.html
Ministry of Internal Affairs and Communications. (2018a). 2017 Employment Status
Survey. https://www.e-stat.go.jp/dbview?sid=0003222404
Ministry of Internal Affairs and Communications. (2018b). Population estimate as of
October 1, 2017. https://www.e-stat.go.jp/dbview?sid=0003215840
Nakamura, T., Tsuchiya, T., & Maeda, T. (2015). A study of the Japanese national
character—The thirteenth nationwide survey (ISM Survey Research Report No. 116).
The Institute of Statistical Mathematics. https://www.ism.ac.jp/kokuminsei/page9/
page13/index.html
149PACHINKO/PACHISLOT PLAYING PARTICIPATION IN JAPAN
National Council on Problem Gambling. (2018). Report of survey on participation in
gambling activities among Singapore residents, 2017. https://www.ncpg.org.sg/en/pdf/
Report_on_NCPG_Gambling_Participation_Survey_2017_final.pdf
Shirahase, S. (2018). Overview of the 2015 National Survey of Social Stratification
and Social Mobility. http://www.l.u-tokyo.ac.jp/2015SSM-PJ/report1.html
University of Macau. (2016). Report on a study of Macao people’s participation in
gambling activities 2016. Institute for the Study of Commercial Gaming. http://
iasweb.ias.gov.mo/cvf/en/annualReport/dfccvf_rs2016.pdf
Welte, J. W., Barnes, G. M., Tidwell, M. C. O., Hoffman, J. H., & Wieczorek, W. F.
(2015). Gambling and problem gambling in the United States: Changes between
1999 and 2013. Journal of Gambling Studies, 31(3), 695–715. https://doi.org/10.1007/
s10899-014-9471-4
Williams, R. J., Lee, C. K., & Back, K. J. (2013). The prevalence and nature of
gambling and problem gambling in South Korea. Social Psychiatry and Psychiatric
Epidemiology, 48(5), 821–834. https://doi.org/10.1007/s00127-012-0580-z
Yamada, S., & Imaizumi, H. (2002). A history of hundred years of Pachinko.
Ad-circle Co.
Ziolkowski, S. (2018). The world count of gaming machines 2017. Gaming
Technologies Association. http://gamingta.com/wp-content/uploads/2018/08/
World_Count_2017.pdf
*******
Submitted January 16, 2020; accepted July 13, 2020. This article was peer reviewed.
All URLs were available at the time of submission.
For correspondence: Akiyo Shoun, M.A., Graduate School of Humanities and
Sciences, Ochanomizu University, 2-1-1, Otsuka, Bunkyo-ku, Tokyo, 112-8610,
JAPAN. E-mail: g1370309@edu.cc.ocha.ac.jp
Competing interests: HI is employed at the Nikkoso Research Foundation for Safe
Society. KS is on the board of trustees of Nichiyukyo (Japan Pachinko Pachislot
Industry Association).
Ethics approval: The study ‘‘A national survey on Pachinko/Pachislot playing
disorder’’ (# 2016-98) was approved by the Ochanomizu University Ethics
Committee for Research in the Humanities and Social Sciences on August 31, 2016.
Acknowledgements: This study was funded by the Nikkoso Research Foundation for
Safe Society.
150You can also read