P2Y Purinergic Receptor Signaling in Oral Squamous Cell Carcinoma Cell Lines and Its Role in Proliferation and Cisplatin-Mediated Apoptosis
←
→
Page content transcription
If your browser does not render page correctly, please read the page content below
Sains Malaysiana 51(1)(2022): 175-186
http://doi.org/10.17576/jsm-2022-5101-14

  P2Y Purinergic Receptor Signaling in Oral Squamous Cell Carcinoma Cell Lines
          and Its Role in Proliferation and Cisplatin-Mediated Apoptosis
 (Isyarat Reseptor Purinergik P2Y dalam Titisan Sel Oral Skuamus Sel Karsinoma dan Peranannya dalam Proliferasi
                                        dan Apoptosis Didorong Cisplatin)

                   L OK M UN L AW, N ORAZRINA A ZMI, I AN C HARLES P ATERSON & P EI Y UEN N G*

                                                      ABSTRACT
Treatment of advanced stage oral squamous cell carcinoma (OSCC) often involves the use of chemotherapeutic agents,
such as cisplatin. However, its use often results in therapeutic failure due to chemoresistance. This study focused
on a class of purinergic receptors, namely P2Y, which are activated via interaction with extracellular nucleotides. The
functional effects of P2Y receptor activation in OSCC cell lines as well as the signaling pathways involved were
investigated. The expression of P2Y2 receptors in histological sections of OSCC was studied due to its association
with cancer. Activation of MAPK pathways via extracellular nucleotides were studied in OSCC cell lines, along with
downstream effects such as proliferation and cisplatin-mediated apoptosis. Immunohistochemical staining of OSCC tissue
samples showed loss of P2Y2 expression as the disease progressed. Western blotting identified different MAPK signaling
pathways were activated by extracellular nucleotides. Bromodeoxyuridine proliferation assays showed increased cellular
proliferation in the OSCC cell lines H400 (p < 0.001) and SAS (p < 0.001) after 24 h treatment with ATP. However, the
ability of extracellular nucleotides to activate multiple P2Y receptor subtypes may indicate the involvement of other
subtypes aside from P2Y2. Cisplatin-mediated apoptosis was enhanced in SAS cells co-treated with ATP (p < 0.001),
while H376 (p < 0.001) showed reduction in the number of apoptotic cells and no significant changes were observed
in H103. This study concluded that extracellular nucleotide on OSCC cell lines with different characterizations had
varied downstream effects, which suggests the use of targeted therapy to specific individuals.
Keywords: Adenosine triphosphate; extracellular nucleotide; oral squamous cell carcinoma; P2Y; purinergic receptor

                                                      ABSTRAK
Rawatan karsinoma sel skuamus mulut (OSCC) peringkat lanjut selalunya melibatkan penggunaan agen kemoterapi
seperti cisplatin. Akan tetapi, rawatan sering kali gagal disebabkan oleh kerintangan terhadap agen kemoterapi
tersebut. Kajian ini menumpukan perhatian pada satu kelas reseptor purinergik iaitu P2Y kerana ia diaktifkan oleh
interaksi dengan nukleotida ekstrasel. Pengekspresan reseptor P2Y2 pada OSCC ditentukan dalam kajian histologi
kerana ia sering dikaitkan dengan kanser. Pengaktifan tapak jalan MAPK oleh nukleotida ekstrasel juga dikaji
dalam titisan sel OSCC, bersama dengan kesan hiliran seperti proliferasi dan apoptosis oleh cisplatin. Pewarnaan
imunohistokimia menunjukkan penurunan pengekspresan P2Y2 dengan perkembangan penyakit. Pemblotan Western
juga menunjukkan pengaktifan tapak jalan MAPK yang berlainan dengan nukleotida yang digunakan. Ujian proliferasi
juga menunjukkan peningkatan kadar proliferasi pada titisan sel OSCC H400 dan SAS selepas 24 jam rangsangan oleh
nukleotida ekstrasel. Akan tetapi, kebolehan nukleotida ekstrasel untuk berinteraksi dengan golongan subjenis
reseptor P2Y berkemungkinan menunjukkan kesan yang dikaji melibatkan reseptor selain daripada P2Y2. Apoptosis
oleh cisplatin ditingkatkan dalam titisan sel SAS selepas rangsangan nukleotida ekstrasel, manakala titisan sel H376
pula menunjukkan penurunan bilangan sel apoptosis. Hasil kajian ini mendapati bahawa titisan sel OSCC yang berlainan
dari segi penciriannya mempunyai kesan hiliran yang berbeza dan ini mencadangkan rawatan khusus yang disasarkan
terhadap individu.
Kata kunci: Adenosina trifosfat; karsinoma sel skuamus mulut; nukleotida ekstrasel; P2Y; reseptor purinergik

                    I NTRODUCTION                            development of OSCC include the use of tobacco and
OSCC is the most common subset of head and neck              excessive alcohol consumption (Rivera 2015). Despite
cancer (Wang et al. 2013). The major risk factors for the    advances in therapeutic treatment, the mortality rate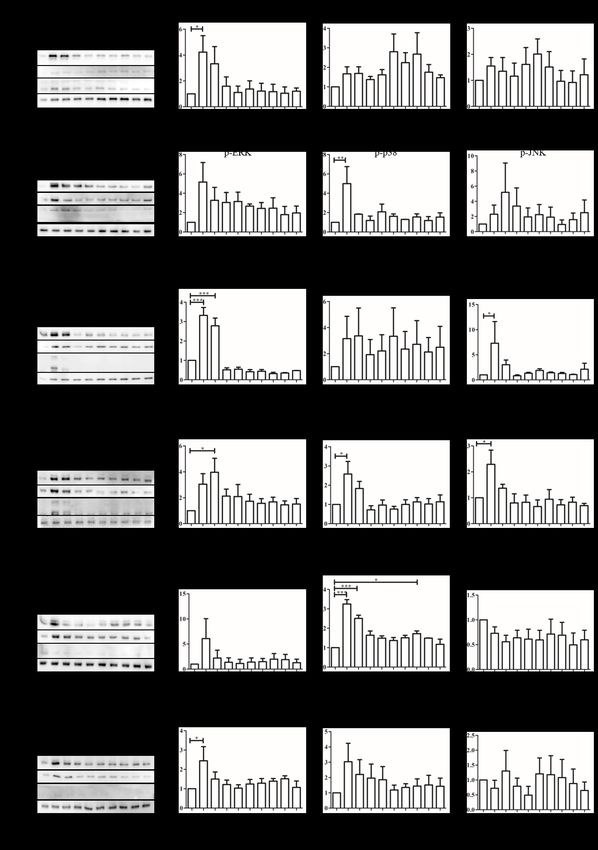
176

of patients with advanced disease has not improved             both classes of purinergic receptors, one major difference
significantly, with a 5-year survival rate of not more         that dictates the class of receptor to be stimulated is
than 12% (Markopoulos 2012). Late-stage diagnoses              the level of extracellular ATP present. P2Y is activated
occur more frequently as early-stage OSCCs are generally       by ATP in micromolar range, while P2X is activated in
painless and may go unnoticed (Wang et al. 2014).              the millimolar range (James & Butt 2001). The present
Treatment of advanced stage OSCC involves the use              study focused on the role of P2Y receptors in OSCC as
of chemotherapeutic agents such as cisplatin (Sacco            the level of extracellular ATP found around the tumor
& Cohen 2015). However, one major drawback is the              microenvironment was reported to be in the micromolar
development of resistance to cisplatin in secondary            range (Puchalowicz et al. 2014). Firstly, the expression
malignancies, which presents a clinical challenge (Chinn       of P2Y2 in OSCC patient samples was examined and then
& Myers 2015; Florea & Busselberg 2011).                       we investigated which MAPK signaling pathways were
      This study focused on the role of nucleotide adenosine   activated via purinergic receptors, and the downstream
triphosphate (ATP) as it functions as an extracellular         effects of ATP on cell proliferation and cisplatin-mediated
signaling molecule. Extracellular nucleotides were found       apoptosis were studied.
to play a role in physiological functions such as apoptosis,
proliferation, migration, differentiation, secretion of                      M ATERIALS AND M ETHODS
growth factors and inflammatory mediators (Di Virgilio &
Adinolfi 2017). An in vivo study conducted by Pellegatti                    CULTURE OF OSCC CELL LINES
et al. (2008) showed vast differences in concentrations
                                                               The derivation and culture of the OSCC cell lines
of ATP around the extracellular matrices of healthy and
                                                               H103, H376, and H400 was described previously
tumor-bearing sites, with micromolar concentrations
                                                               (Prime et al. 1990). The OSCC cell line, SAS , was
being detected at tumor-bearing sites (Falzoni et al. 2013;
                                                               obtained from Institute for Research, Development &
Yegutkin 2014). Such high levels at tumor sites may be
                                                               Innovation, International Medical University Malaysia.
explained by the presence of a necrotic tumor core which
                                                               Briefly, the H-series OSCC cell lines H103, H376, and
releases intracellular ATP (Xu et al. 2016).
                                                               H400 were routinely grown in DMEM /Ham’s F-12
      Previous studies have described contradictory roles
                                                               supplemented with 10% fetal bovine serum and 0.5 µg/
of extracellular ATP as a signaling molecule, with both
                                                               mL hydrocortisone sodium succinate, while SAS cell
anti-tumor and pro-tumor properties being reported.
                                                               line was cultured in DMEM/Ham’s F-12 supplemented
One study showed extracellular ATP capable of acting
                                                               with only 10% fetal bovine serum. Cultured cells were
as damage-associated molecular pattern (DAMP), which
                                                               maintained in a humidified atmosphere containing 5%
activated the anti-tumor immune response (Krysko
                                                               CO2 at 37 °C. All cell culture media were acquired from
et al. 2013). This signal was detected by and caused
                                                               Nacalai Tesque, Kyoto, Japan.
the recruitment of monocytes (Elliott et al. 2009).
Extracellular ATP signaling molecules could also be
recognized by dendritic cells, which results in the                           IMMUNOHISTOCHEMISTRY
activation of inflammasome NALP3-ASC, causing the              Paraffin-embedded tissue samples (n = 60) were obtained
section of interleukin-1β ( IL-1β) (Ghiringhelli et al.        from the Oral Cancer Research and Coordinating Centre,
2009). Together with antigen presentation, cytokine            University Malaya (OCRCC). A rabbit polyclonal anti-
IL-1β was able to induce an immune response towards            P2Y2 antibody (Alomone, Jerusalem, Israel) was used
cancer cells (Krysko et al. 2012). In contrast, another        to assess P2Y2 receptor expression on these sections.
study showed that extracellular ATP induced proliferation      All participants provided written informed consent
of hepatocellular carcinoma HepG2 and BEL -7404                for retrieval of biopsy samples. Ethical approval for
cells (Xie et al. 2014). In addition, ATP was capable of       this study was obtained from the Medical Ethics
enhancing the immunosuppressive ability of regulatory          Committee, Faculty of Dentistry, University of Malaya
CD4+ T cells (Tregs) (Trabanelli et al. 2012). Thus, it is     (DF OC1701/0012U). Immunohistochemical analysis was
imperative to study the effects of extracellular ATP in        performed using the peroxidase/3,3’-diaminobenzidine
the tumor microenvironment in different malignancies.          (DAB) EnVision detection system (Dako, CA, USA).
Receptors with extracellular nucleotides as ligands are        Staining was performed and optimized in accordance to
known as purinergic receptors and are classified into          the manufacturer’s instructions. Briefly, the sectioned
two separate categories, namely P2X and P2Y receptors.         samples were deparaffinized and rehydrated. Heat-
Although extracellular ATP is capable of stimulating           induced epitope retrieval was then performed and slides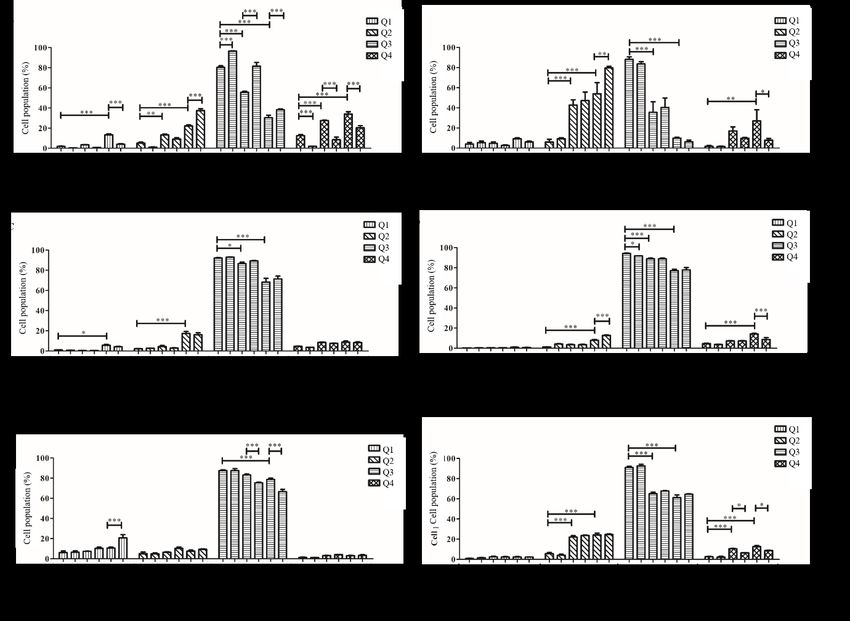
177
were subsequently blocked with peroxidase-blocking Annexin V apoptosis detection kit (BD Biosciences,
solution for 5 min in the dark. The sections were incubated CA, USA) in accordance to the manufacture’s protocol.
with P2Y2 primary antibody for 1.5 h. Slides were then Briefly, OSCC cell lines (2 × 10⁵ cells/well) were seeded
incubated with EnVision/HRP anti-rabbit/mouse (Dako, onto 6-well culture plates. 30 min prior to treatment with
CA, USA) for 30 min followed by incubation with DAB+ cisplatin, cells were either untreated, treated with ATP
chromogen (Dako, CA, USA ). Next, sections were (100 µM) or suramin (50 µM) and the cells then cultured
washed and counterstained with hematoxylin before for 24 h with cisplatin. The cells were then trypsinized
they were dehydrated and mounted with DPX mounting and collected by centrifugation. Cell pellets were washed
medium. Qualitative analysis of slides was conducted 2 times with PBS before resuspending with Annexin V
by a pathologist. binding buffer. FITC Annexin V and propidium iodide
were then added to the cells and incubated in the dark
CELL LYSIS, PROTEIN EXTRACTION AND WESTERN BLOT for 15 min. Cells were analyzed with flow cytometer (BD
ANALYSIS FacsCanto II, CA, USA). Data from at least 10,000 single
cell events were acquired from each sample.
OSCC cell lines (1 × 10⁵ cells/well) were seeded onto
12-well culture plates. Cells were either untreated,
treated with ATP (100 µM) or uridine triphosphate (UTP; PROLIFERATION ASSAY
100 µM) at different time points. Cells were detached The proliferation rate of OSCC cells was determined
from plates with trypsin/EDTA buffer and collected for with a colorimetric bromodeoxyuridine (BrdU) cell
lysis. RIPA lysis buffer (50 mM Tris-hydrochloric acid proliferation ELISA kit (Roche, CA, USA). Cells (5 × 10³
buffer pH = 7.6, 150 mM NaCl, 1% w/v Nonidet P40 cells/well) were seeded onto 96-well culture plates. Cells
substitute, 0.5% w/v sodium deoxycholate, 0.1% w/v were either untreated, treated with ATP (100 µM) or UTP
sodium dodecyl sulfate (SDS), protease and phosphatase (100 µM) for 24 h. After that, the wells were incubated
inhibitor, 1 mM dichlorodiphenyltrichloroethane with BrdU labeling solution for 24 h. The cells were
(Nacalai Tesque, Kyoto, Japan) was prepared and then then fixed with ethanol, followed by incubation of
added to the pellets. Supernatants were collected and monoclonal antibody from mouse-mouse hybrid cells
protein concentrations were determined with Bradford conjugated with peroxidase (anti-BrdU-POD) for 1.5
assay. Lysates were heated in Laemmli buffer and h. Wells were washed with washing solution provided
were separated in 10% SDS-PAGE and transferred onto in the kit. Finally, tetramethyl-benzidine substrate
nitrocellulose membranes (Pall Corporation, NY, USA). solution was added and cells were incubated in the dark
Membranes were blocked by incubation with NATT for 30 min. Plates were read with the Infinite M200
buffer (20 mM Tris (pH=7.4), 150 mM NaCl and 0.03% Pro microplate reader at 370 and 492 nm, respectively
Tween-20 v/v) containing 5% non-fat dry milk. After (Tecan, Männedorf, Switzerland). Stimulation index was
blocking, the membranes were washed in NATT BrdU labeling
buffer and index = (Absorbance
calculated using (1)at 370
andnm(2):- Absorbance of blank at
then probed with primary antibody in NATT containing
370 nm)
BrdUBrdU
labeling - BrdU
labeling
index
labeling
(Absorbance
index atindex
492 =nm
= (Absorbance
= (Absorbance at 370
(Absorbance
- atAbsorbance
370- nm
nm - atAbsorbance
370 nm - Absorbance
Absorbance of blank
of blank at at
0.3% bovine serum albumin (BSA) at 4 °C overnight. The
(1)
next day, membranesBrdU
werelabeling
washed
BrdUwith
labeling
index =NATT buffer
index = and
(Absorbance (Absorbance
at 370 nm -atAbsorbance
of370 nm at- Absorbance
blank of blank
492 of
370blank
nm)370at nm) at- (Absorbance
370 nm) - (Absorbance -atAbsorbance
492 nm - A
-nm)
(Absorbance at 492at nm
492(1)
- nm
Absorbance
incubated with secondary antibody in NATT containing
0.3% BSA at 4 °C for 1.5 h. Finally, membranes 370 nm) - (Absorbance
370 nm) -were
(Absorbance at 492 nm -atAbsorbance
492 nm - Absorbance
of blank of blank
nm) at 492 nm)
of blank at 492atnm)
492
developed with enhanced chemiluminescence substrate, (1) (1)
of blank
followed by imaging with Fusion FX7 Imaging System at of
492blank
nm) at 492 nm)
SI = Mean BrdU labeling index of treated group
(Vilber Lourmat, Collégien, France). (2) (2)
Mean BrdU labeling index of untreated group
SI = Mean BrdU labeling indexgroup
of treate
MeanMean
SI = SI = BrdUBrdU labeling
labeling indexindex of treated
of treated group
APOPTOSIS ASSAY Mean BrdU labeling index of untreat
SI = SI =BrdUMean
Mean BrdU
labeling labeling
index of index
treated MeanMean
of treated
STATISTICAL
group BrdUBrdU
group
ANALYSIS
labeling
labeling indexindex of untreated
of untreated groupgroup
Concentrations of cisplatin that reduced the percentage (2) from(2)three
Mean BrdUMean
of viable cells significantly were predetermined labeling
in Data
BrdU
index were
labeling presented
index of group
of untreated as mean
untreated group ± SEM
respective cell lines. Due to the differences in sensitivity independent experiments and were analyzed using
of OSCC cell lines towards cisplatin, the concentrations GraphPad Prism 5 software. Statistical analysis was done
used in this study ranged from 10 to 100 µM. The by analysis of variance (ANOVA), followed by Dunnett
apoptotic cell distribution was determined using FITC post-hoc test for Western Blot analysis and Tukey post-
hoc test for proliferation and apoptosis assays.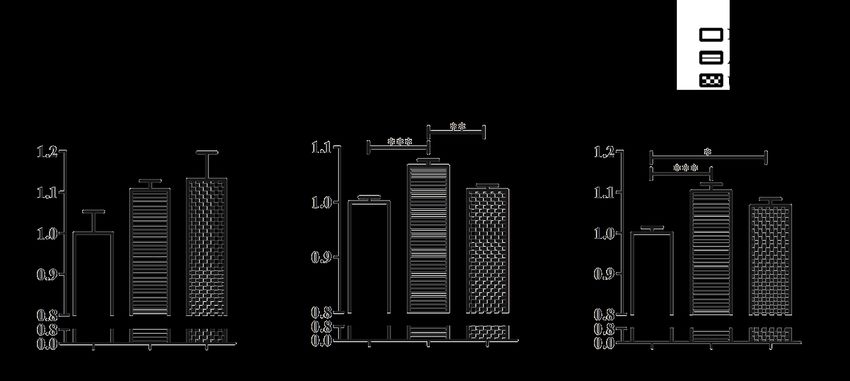
178

               R ESULTS AND D ISCUSSION                           conditions such as cancer of the liver, pancreas, and
                                                                  colon (Bellefeuille et al. 2019). We therefore anticipated
        P2Y2 RECEPTORS IN OSCC PATIENT SAMPLES                    a similar trend to be observed in OSCC samples.
Due to the prevalence of OSCC within the Indian                   Qualitative analysis of patient samples found that normal
community in Malaysia, it is imperative to develop                squamous epithelium generally showed expression of
a novel therapeutic approach to improve its current               P2Y2 receptors at the membrane as well as cytoplasm.
treatment (Ab Manan et al. 2015). This study looked at            However, the expression of P2Y2 receptors varied in
the effects of extracellular nucleotides on OSCC cells            different disease stages. In areas of keratinization, strong
as concentrations of nucleotides are often found to be            staining was observed in the cytoplasm (samples D227
elevated around the tumor microenvironment (Pellegatti            and D586; Figure 1). For poorly differentiated as well
et al. 2008).                                                     as non-keratinizing OSCCs, however, staining was weak
      P2Y2 protein expression was examined in OSCC                which indicated a downregulation of P2Y 2 (sample
patient samples as it was the first P2Y purinergic receptor       D123; Figure 1). In addition, a loss of P2Y2 expression
associated with gastrointestinal (GI) cancer (Bellefeuille et     was observed during the transition from normal
al. 2019; Hopfner et al. 1998). In addition to P2Y2 protein       epithelium to epithelial dysplasia (sample D365; Figure
being found ubiquitously expressed throughout the GI              1). Nevertheless, quantitative analysis of P2Y2 staining
tract, its expression was also increased in pathological          should be included in future study to confirm this finding.

                    FIGURE 1. Immunohistochemical staining of OSCC patient tissues with P2Y2 antibody.
                       HER2 positive breast cancer tissue was used as positive control for P2Y2 receptor
                     expression. Cell nuclei were stained with hematoxylin and appeared blue, while regions
                                             with P2Y2 receptors were stained brown

      ROLE OF P2Y2 RECEPTOR AGONISTS IN MITOGEN-                  the pathogenesis of many human diseases (Kim & Choi
          ACTIVATED PROTEIN KINASES (MAPKS)                       2010). Notably, it was previously reported that ERK1/2
As MAPK signaling pathways play a role in a                       MAPK as well as p38 MAPK pathways are involved in the
wide range of cellular activities such as proliferation,          invasive phenotype of various types of cancers including
differentiation and survival, it is unsurprising that             melanoma (Ge et al. 2002), vascular smooth muscle
activation of these pathways has been associated with             cells (Graf et al. 1997), breast epithelial cells (Kim et
179
al. 2003) and endothelial cells (Matsumoto et al. 1999). MAPK which peaked at 15 min (p < 0.05, Figure 2(A)) and
Thus, MAPK signaling pathways were included in the a 4.998 ± 1.757-fold increase of p38 MAPK which peaked
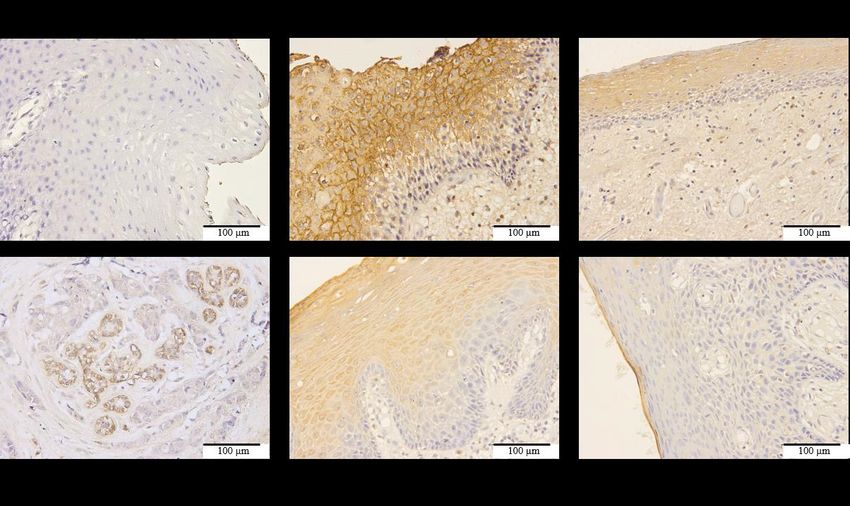
present study. Stimulation of H376 cells with 100 µM at 15 min was observed when H376 cells were treated with
ATP resulted in a 4.225 ± 1.279-fold increase of ERK1/2 100 µM UTP (p < 0.01, Figure 2(B)). Treatment of H400
FIGURE 2. Activation of MAPK signaling pathways ERK1/2, p38 MAPK and SAPK/JNK on OSCC cell
lines upon treatment with extracellular nucleotide in a period of 24 h. Fold activation was obtained by
normalizing with an untreated control: (A) H376, (C) H400, and (E) SAS cells were treated with 100 µM
ATP. Additionally: (B) H376, (D) H400, and (F) SAS cells were treated with 100 µM UTP. All experiments
were independently repeated three times. Data are represented as mean ± SEM. * p < 0.05, ** p < 0.01, and
*** p < 0.01 compared with corresponding negative control180
cells with 100 µM ATP resulted in a 3.317 ± 0.4077-fold Figure S1). Considering the complexity of the purinergic
increase of ERK1/2 MAPK (p < 0.001, Figure 2(C)) as signaling network, it is not unreasonable to suggest
well as a 7.293 ± 4.308-fold increase of SAPK/JNK (p < that an array of purinergic receptors contribute towards
0.05, Figure 2(C)) at the 15 min time point. On the other tumorigenesis (Bellefeuille et al. 2019).
hand, 100 µM UTP activated all three MAPKs studied. Transient activation of MAPKs observed throughout
ERK1/2 MAPK was found to peak at 30 min (3.967 ± the study may possibly be due to degradation of
1.079-fold; p < 0.05, Figure 2(D)), whereas p38 MAPK nucleotides by ectonucleotidases C39 and CD73 (Allard
and SAPK/JNK peaked at 15 min post treatment (2.584 et al. 2017; Stagg & Smyth 2010). To confirm whether
± 0.6554-fold and 2.288 ± 0.5504-fold respectively; p < hydrolysis of ATP was causing such a phenomenon,
0.05, Figure 2(D)). a poorly hydrolysable ATP analogue ATPγS was used
Stimulation of OSCC cell line SAS with 100 µM ATP (Kauffenstein et al. 2004). However, transient activation
only showed an activation of p38 MAPK pathway which of MAPK pathways was also observed with this
peaked at the 15 min time point (3.250 ± 0.2256-fold, p < analogue, indicating that it was not due to degradation of
0.001, Figure 2(E)) while stimulation with 100 µM UTP nucleotides (Supplementary Figure S2). Interestingly, it
caused the activation of ERK1/2 MAPK pathway which is also worthy to note that ATPγS is a selective agonist
also peaked at 15 min (2.445 ± 0.7318-fold increase; p of P2Y11 (Gruenbacher et al. 2019; Jacobson et al. 2006),
< 0.05, Figure 2(F)). Studies were conducted for a total suggesting a possibility of the involvement of P2Y11 in
period of 24 h and that no signification detection of MAPK signaling activation in these cells. A study that
MAPK phosphorylation was detected after more than 30 utilized P2Y11 antagonist NF157 was able to suppress
min, except for p38 MAPK activation in SAS stimulated the activation of p38 MAPK in human primary aortic
with 100 µM ATP (Figure 2(E)). endothelial cells, further illustrating the role of P2Y11 in
In summary, stimulation of OSCC cells with ATP MAPK activation (Kuang et al. 2019).
resulted in phosphorylation of ERK1/2 in H376 cells,
whilst H400 cells showed activation of ERK1/2 and PROLIFERATIVE EFFECT OF P2Y2 AGONISTS IN OSCC
SAPK/JNK pathways. A different MAPK pathway, p38 CELL LINES
MAPK, was activated in SAS cell line. It is possible that
Contrasting effect of P2Y2 receptor activation on cell
the results observed were due to other P2Y receptors
proliferation has previously been demonstrated in various
being activated, as ATP is able to activate a range of P2Y
malignancies (Li et al. 2013). Specifically, its activation
receptors (Jacobson et al. 2009). In addition, the use of
was found to induce cell proliferation in lung cancer
UTP, which is equipotent in P2Y2 receptor activation,
and melanoma, whereas a reduction in cell proliferation
resulted in the activation of different MAPK pathways
was reported in esophageal and colorectal cancer (Li
within the same cell line. This could be attributed to
et al. 2013; Maaser et al. 2002). Therefore, it would be
the presence of multiple purinergic receptors on the
interesting to measure cell proliferation of OSCC cells in
cell membrane, which indicated that P2Y 2 receptor
the presence of extracellular ATP.
may not be the only receptor subtype expressed in these
In H400 cells, ATP treatment increased the rate
cells. The presence of ectonucleoside triphosphate
of cell proliferation with a stimulation index (SI) of
diphosphohydrolases and ectonucleotidases further adds
1.065 ± 0.011 (p < 0.001, Figure 3). Similarly, SAS
complexity to the signaling network, as the degradation
cells also showed increase in SI of 1.102 ± 0.018 (p <
products of ATP may also be contributing to the pathways
0.001). However, H376 did not show significant increase
observed (Bellefeuille et al. 2019). In order to address
in proliferation rate (SI of 1.106 ± 0.022, Figure 3).
this issue, a follow-up study which utilized a selective
Treatment with UTP, another P2Y2 agonist, resulted in
P2Y2 agonist MRS2768 was carried out on OSCC cell
an increase in SI only in SAS cells (1.066 ± 0.017; p <
lines H376 and H400 to confirm whether activation of
0.05), while the proliferation of H376 and H400 was
P2Y2 by itself contributed to the MAPK signaling pathway
not increased (SIs of 1.131 ± 0.066 and 1.022 ± 0.009,
activation observed with extracellular ATP. Notably, the
respectively), as shown in Figure 3.
levels of phosphorylation of ERK1/2, SAPK/JNK and p38
MAPK seemed negligible compared to their unstimulated
In the present study, the effect of P2Y2 agonists
groups, indicating that P2Y2 itself was not sufficient to
on OSCC cell proliferation was variable across different
induce the MAPK signaling pathway and that different
cell lines. H376 did not show any changes in cell
receptor subtype(s) may be activated (Supplementary181
FIGURE 3. Stimulation indices (SIs) of OSCC cell lines H376, H400 and SAS after being treated with either
100 µM ATP or 100 µM UTP for 24 h. All experiments were independently repeated three times. Data are
represented as mean ± SEM. * p < 0.05, ** p < 0.01, and *** p < 0.01
proliferation rate after treatment with ATP, whereas towards the commonly used chemotherapeutic drug
H400 and SAS cell lines showed increased proliferation. cisplatin. In the present study, H376 cells treated with 100
This further emphasized that extracellular ATP exhibited µM ATP showed an increased in the viable cell population
different effects even within cells derived from the same (96.5 ± 0.273%) as compared to untreated group (80.4
malignancy. This may possibly be explained by the ± 1.53%; p < 0.001). Treatments of 10µM and 20µM
multiple purinoceptors expressed within each respective of cisplatin both resulted in a reduction of viable cells
cell line (Bellefeuille et al. 2019). The treatment of cells (55.6 ± 1.01% and 30.3 ± 24.3%, respectively; both p
with UTP also did not show similar effects as ATP in the < 0.001). When compared with cells treated with ATP
cell lines studied, which further indicates the involvement alone, it was observed that a combination of ATP and
of a different P2Y receptor subtypes, if not multiple cisplatin increased the percentage of viable cells (81.5
purinoceptors. In addition, the rise in proliferation rate ± 3.80% for 10 µM cisplatin and 38.2 ± 0.851% for 20
may be attributed to degradation products of ATP such as µM cisplatin, respectively; p < 0.001). At the same time,
adenosine. Therefore, experiments involving the use of the population of early apoptotic cells was found to be
specific P2Y agonists should be conducted to determine reduced with a combination of ATP and cisplatin (8.57 ±
the proliferative effects observed. Additionally, further 2.57% for 10 µM cisplatin and 20.4 ± 2.12% for 20 µM
study utilizing short interfering RNA to knockdown the cisplatin; both p < 0.001) compared to cells treated with
expression of P2Y2 may also be considered to ascertain cisplatin alone (27.5 ± 0.491% for 10 µM cisplatin and
its role in proliferation (Li et al. 2013). 34.0 ± 2.25% for 20 µM cisplatin) (Figure 4(A)). The
protective effect of ATP was also observed in a previous
IMPLICATION OF P2Y RECEPTOR ACTIVATION/ study on lung cancer cells (Song et al. 2016). When cells
INHIBITION IN CISPLATIN-MEDIATED APOPTOSIS were treated with suramin in place of ATP, it was found
that combination treatment of 50 µM suramin with 20
As drug resistance poses as a major drawback for patients
µM cisplatin showed a shift in cell population from early
undergoing chemotherapy, this study also looked at the
apoptosis (7.83 ± 1.77%; p < 0.05) to late apoptosis (79.7
possible role of extracellular ATP as a contributing factor
± 1.53%; p < 0.01) compared to cells treated with only
towards drug resistance (Khoo et al. 2019). Due to the
20 µM cisplatin as shown in Figure 4(B).
high concentration of extracellular ATP accumulating at
The results of the present study are consistent with
tumor sites in contrast to healthy sites (Li et al. 2013), its
the findings of a recent study where the addition of ATP
presence may have an impact in OSCC gaining resistance182
FIGURE 4. Cisplatin-mediated apoptosis of OSCC cell lines: (A) H376, (C) H103, and (E) SAS
cells were treated with predetermined cisplatin concentrations or with a combination of 100 µM
ATP and cisplatin. Suramin was used to inhibit P2Y receptors: (B) H376, (D) H103, and (F)
SAS cells were treated with predetermined cisplatin concentrations or with a combination of 50
µM suramin and cisplatin. All experiments were independently repeated three times. Data are
represented as mean ± SEM. * p < 0.05, ** p < 0.01, and *** p < 0.01
increased the chemotherapy resistance of breast cancer in apoptotic cell populations were observed following
cells (Yang et al. 2020). Furthermore, the inhibition of combined treatment with ATP and cisplatin compared
P2Y receptor with antagonist suramin showed decrease with cells treated with cisplatin alone as shown in Figure
in early apoptotic cell population and increase in late 4(C). Nonetheless, treatment with suramin resulted in
apoptotic cell population simultaneously when compared a decrease in viable cell numbers (91.8 ± 0.115%) as
with group treated with only cisplatin. Thus, by blocking compared to untreated cells (94.1 ± 0.551%; p < 0.05). It
P2Y receptors, H376 cells were more sensitive towards was also observed that combined treatment with 50 µM
cisplatin treatment. The possibility of the involvement suramin and 20 µM cisplatin caused a shift in the cell
of P2Y receptors in cisplatin-mediated apoptosis is also population from early apoptotic stage (8.73 ± 1.78%) to
demonstrated in a study on nasopharyngeal carcinoma late apoptotic stage (12.7 ± 0.437%) when compared to
cells, whereby the use of P2Y antagonist elicited an effect group treated with only 20 µM cisplatin (14.2 ± 0.681%
on cisplatin-mediated apoptosis (Yang et al. 2015). for early apoptotic population and 7.83 ± 0.845% for
In H103 cells, similar cisplatin concentrations were late apoptotic population; both p < 0.001, as shown in
used to induce cell death. However, no significant shifts Figure 4(D).183
In H103 cells, combined treatment of cells with C ONCLUSION
ATP and cisplatin did not result in any differences in In conclusion, this study found that OSCC cell lines with
cell populations when compared to groups only treated varied origins and characteristics behaved differently
with cisplatin. When suramin was used in place of ATP, in both the MAPK signaling pathways involved as
a decrease of viable cell population was observed when well as the downstream effects studied. This indicated
compared to the untreated group. It was also observed the possibility of different P2Y subtypes at play in
that a combination of suramin and cisplatin shifted the respective cell lines. Nevertheless, P2Y2 which is often
cells from early to late apoptotic stage. This indicates that associated with proliferation may not be responsible in
by preventing the extracellular purine from activating the purinergic signaling observed in this study, and that
the receptors, suramin may have a synergistic effect in future research is needed to determine the P2Y receptor
the treatment of OSCC when combined with cisplatin subtypes involved in respective cell lines.
(Bhargava et al. 2007).
For SAS cells, the concentrations of cisplatin used
ACKNOWLEDGEMENTS
to induce changes in viable cell population after 24 h
were 80 and 100 µM which were higher compared to the This work was supported by grants from the following:
concentrations used in H376 and H103. When compared Ministry of Science, Technology & Innovation
with the untreated group (87.5 ± 0.808%), cells treated (FRGS/2/2013/SKK03/UKM/03/1) and Toray Research
with 80 µM cisplatin did not show significant changes in Foundation (STRG15/G341). The authors would like to
viable cell population (83.1 ± 0.953%; p > 0.05), while thank OCRCC, University of Malaya, for providing tissue
cells treated with 100 µM cisplatin showed decrease and data from the Malaysian Oral Cancer Database &
in viable cell population (78.7 ± 1.22%; p < 0.001). Tissue Bank System (MOCDTBS).
However, viable cell populations decreased in cells
treated with a combination of ATP and cisplatin (75.3 ± REFERENCES
0.742% for 80 µM cisplatin and 66.5 ± 2.37% for 100 Ab Manan, A., Ibrahim Tamin, N.S., Abdullah, H., Zainal Abidin,
µM cisplatin; both p < 0.001). It was also observed that A. & Wahab, M. 2015. Malaysian National Cancer Registry
the population of necrotic cells increased in group having Report 2007-2011. Putrajaya: Ministry of Health Malaysia.
combination treatment with 100 µM ATP and 100 µM Allard, B., Longhi, M.S., Robson, S.C. & Stagg, J. 2017. The
cisplatin (20.7 ± 3.27%) compared to cells treated with ectonucleotidases CD39 and CD73: Novel checkpoint
only 100 µM cisplatin (10.6 ± 0.984%; p < 0.001, Figure inhibitor targets. Immunological Reviews 276(1): 121-144.
Bellefeuille, S.D., Molle, C.M. & Gendron, F.P. 2019. Reviewing
4(E)). When suramin was used instead of ATP, it was
the role of P2Y receptors in specific gastrointestinal cancers.
noted that treatment of suramin prior to cisplatin reduced
Purinergic Signalling 15(4): 451-463.
the population of early apoptotic cells for both cisplatin Bhargava, S., Hotz, B., Hines, O.J., Reber, H.A., Buhr, H.J. &
concentrations used (6.33 ± 0.219% for 80 µM cisplatin Hotz, H.G. 2007. Suramin inhibits not only tumor growth
and 8.70 ± 0.208% for 100 µM cisplatin) compared to and metastasis but also angiogenesis in experimental
groups only treated with cisplatin (22.0 ± 1.43% for 80 pancreatic cancer. Journal of Gastrointestinal Surgery 11(2):
µM cisplatin and 24.1 ± 1.74% for 100 µM cisplatin, both 171-178.
p < 0.05, as shown in Figure 4(F). Chinn, S.B. & Myers, J.N. 2015. Oral cavity carcinoma: Current
When SAS cells were treated with a combination management, controversies, and future directions. Journal of
of ATP and cisplatin, the viable cell count decreased, Clinical Oncology 33(29): 3269-3276.
Di Virgilio, F. & Adinolfi, E. 2017. Extracellular purines,
whilst the non-selective P2 receptor antagonist,
purinergic receptors and tumor growth. Oncogene 36(3):
suramin, induced an opposite effect. This implied that 293-303.
the presence of extracellular ATP caused the cells to be Elliott, M.R., Chekeni, F.B., Trampont, P.C., Lazarowski, E.R.,
more susceptible to treatment with cisplatin, whereas Kadl, A., Walk, S.F., Park, D., Woodson, R.I., Ostankovich,
blocking of P2Y receptors with suramin reduced the M., Sharma, P., Lysiak, J.J., Harden, T.K., Leitinger, N. &
effectiveness of chemotherapeutic treatment with Ravichandran, K.S. 2009. Nucleotides released by apoptotic
cisplatin. A recent review on the role of P2Y receptors cells act as a find-me signal to promote phagocytic clearance.
in an array of gastrointestinal cancers further implies the Nature 461(7261): 282-286.
use of selective antagonist of P2Y receptor subtype as Falzoni, S., Donvito, G. & Di Virgilio, F. 2013. Detecting
a promising target for the treatment of gastrointestinal adenosine triphosphate in the pericellular space. Interface
Focus 3(3): 20120101.
cancers (Bellefeuille et al. 2019).184
Florea, A.M. & Busselberg, D. 2011. Cisplatin as an anti-tumor Research 63(17): 5454-5461.
drug: Cellular mechanisms of activity, drug resistance and Krysko, D.V., Garg, A.D., Kaczmarek, A., Krysko, O., Agostinis,
induced side effects. Cancers 3(1): 1351-1371. P. & Vandenabeele, P. 2012. Immunogenic cell death and
Ge, X., Fu, Y.M. & Meadows, G.G. 2002. U0126, a mitogen- DAMPs in cancer therapy. Nature Reviews Cancer 12(12):
activated protein kinase kinase inhibitor, inhibits the invasion 860-875.
of human A375 melanoma cells. Cancer Letters 179(2): Krysko, O., Love Aaes, T., Bachert, C., Vandenabeele, P. &
133-140. Krysko, D.V. 2013. Many faces of DAMPs in cancer therapy.
Ghiringhelli, F., Apetoh, L., Tesniere, A., Aymeric, L., Ma, Y., Cell Death & Disease 4(5): e631.
Ortiz, C., Vermaelen, K., Panaretakis, T., Mignot, G., Ullrich, Kuang, Y., Liu, H., Guo, S., Wang, Y., Zhang, H. & Qiao, Y.
E., Perfettini, J.L., Schlemmer, F., Tasdemir, E., Uhl, M., 2019. The antagonist of P2Y11 receptor NF157 ameliorates
Genin, P., Civas, A., Ryffel, B., Kanellopoulos, J., Tschopp, oxidized LDL-induced vascular endothelial inflammation.
J., Andre, F., Lidereau, R., McLaughlin, N.M., Haynes, N.M., Artificial Cells, Nanomedicine, and Biotechnology 47(1):
Smyth, M.J., Kroemer, G. & Zitvogel, L. 2009. Activation 1839-1845.
of the NLRP3 inflammasome in dendritic cells induces IL- Li, W.H., Qiu, Y., Zhang, H.Q., Liu, Y., You, J.F., Tian, X.X. &
1beta-dependent adaptive immunity against tumors. Nature Fang, W.G. 2013. P2Y2 receptor promotes cell invasion and
Medicine 15(10): 1170-1178. metastasis in prostate cancer cells. British Journal of Cancer
Graf, K., Xi, X.P., Yang, D., Fleck, E., Hsueh, W.A. & Law, 109(6): 1666-1675.
R.E. 1997. Mitogen-activated protein kinase activation is Maaser, K., Hopfner, M., Kap, H., Sutter, A.P., Barthel, B., von
involved in platelet-derived growth factor-directed migration Lampe, B., Zeitz, M. & Scherubl, H. 2002. Extracellular
by vascular smooth muscle cells. Hypertension 29(1): nucleotides inhibit growth of human oesophageal cancer
334-339. cells via P2Y(2)-receptors. British Journal of Cancer 86(4):
Gruenbacher, G., Gander, H., Rahm, A., Dobler, G., Drasche, A., 636-644.
Troppmair, J., Nussbaumer, W. & Thurnher, M. 2019. The Markopoulos, A.K. 2012. Current aspects on oral squamous cell
human G protein-coupled ATP receptor P2Y11 is associated carcinoma. The Open Dentistry Journal 6: 126-130.
with IL-10 driven macrophage differentiation. Frontiers in Matsumoto, T., Yokote, K., Tamura, K., Takemoto, M., Ueno,
Immunology 10: 1870. H., Saito, Y. & Mori, S. 1999. Platelet-derived growth
Hopfner, M., Lemmer, K., Jansen, A., Hanski, C., Riecken, E.O., factor activates p38 mitogen-activated protein kinase
Gavish, M., Mann, B., Buhr, H., Glassmeier, G. & Scherubl, through a Ras-dependent pathway that is important for actin
H. 1998. Expression of functional P2-purinergic receptors reorganization and cell migration. Journal of Biological
in primary cultures of human colorectal carcinoma cells. Chemistry 274(20): 13954-13960.
Biochemical and Biophysical Research Communications Pellegatti, P., Raffaghello, L., Bianchi, G., Piccardi, F., Pistoia,
251(3): 811-817. V. & Di Virgilio, F. 2008. Increased level of extracellular
Jacobson, K.A., Costanzi, S., Joshi, B.V., Besada, P., Shin, D.H., ATP at tumor sites: in vivo imaging with plasma membrane
Ko, H., Ivanov, A.A. & Mamedova, L. 2006. Agonists and luciferase. PLoS ONE 3(7): e2599.
antagonists for P2 receptors. Novartis Foundation Symposia Prime, S.S., Nixon, S.V., Crane, I.J., Stone, A., Matthews, J.B.,
276: 58-68. Maitland, N.J., Remnant, L., Powell, S.K., Game, S.M. &
Jacobson, K.A., Ivanov, A.A., de Castro, S., Harden, T.K. & Ko, Scully, C. 1990. The behaviour of human oral squamous
H. 2009. Development of selective agonists and antagonists cell carcinoma in cell culture. The Journal of Pathology
of P2Y receptors. Purinergic Signalling 5(1): 75-89. 160(3): 259-269.
James, G. & Butt, A.M. 2001. P2X and P2Y purinoreceptors Puchalowicz, K., Tarnowski, M., Baranowska-Bosiacka,
mediate ATP-evoked calcium signalling in optic nerve glia I., Chlubek, D. & Dziedziejko, V. 2014. P2X and P2Y
in situ. Cell Calcium 30(4): 251-259. receptors-role in the pathophysiology of the nervous system.
Kauffenstein, G., Hechler, B., Cazenave, J.P. & Gachet, C. 2004. International Journal of Molecular Sciences 15(12): 23672-
Adenine triphosphate nucleotides are antagonists at the P2Y 23704.
receptor. Journal of Thrombosis and Haemostasis 2(11): Rivera, C. 2015. Essentials of oral cancer. International Journal
1980-1988. of Clinical and Experimental Pathology 8(9): 11884-
Khoo, X.H., Paterson, I.C., Goh, B.H. & Lee, W.L. 2019. 11894.
Cisplatin-resistance in oral squamous cell carcinoma: Sacco, A.G. & Cohen, E.E. 2015. Current treatment options
Regulation by tumor cell-derived extracellular vesicles. for recurrent or metastatic head and neck squamous cell
Cancers 11(8): 1166. carcinoma. Journal of Clinical Oncology 33(29): 3305-3313.
Kim, E.K. & Choi, E.J. 2010. Pathological roles of MAPK Song, S., Jacobson, K.N., McDermott, K.M., Reddy, S.P., Cress,
signaling pathways in human diseases. Biochimica et A.E., Tang, H., Dudek, S.M., Black, S.M., Garcia, J.G.,
Biophysica Acta 1802(4): 396-405. Makino, A. & Yuan, J.X. 2016. ATP promotes cell survival
Kim, M.S., Lee, E.J., Kim, H.R. & Moon, A. 2003. p38 kinase is via regulation of cytosolic [Ca2+] and Bcl-2/Bax ratio in lung
a key signaling molecule for H-Ras-induced cell motility and cancer cells. American Journal of Physiology-Cell Physiology
invasive phenotype in human breast epithelial cells. Cancer 310(2): C99-114.185
Stagg, J. & Smyth, M.J. 2010. Extracellular adenosine Yegutkin, G.G. 2014. Enzymes involved in metabolism of
triphosphate and adenosine in cancer. Oncogene 29(39): extracellular nucleotides and nucleosides: functional
5346-5358. implications and measurement of activities. Critical Reviews
Trabanelli, S., Ocadlikova, D., Gulinelli, S., Curti, A., Salvestrini, in Biochemistry and Molecular Biology 49(6): 473-497.
V., Vieira, R.P., Idzko, M., Di Virgilio, F., Ferrari, D. &
Lemoli, R.M. 2012. Extracellular ATP exerts opposite effects Lok Mun Law, Norazrina Azmi & Pei Yuen Ng*
on activated and regulatory CD4+ T cells via purinergic P2 Faculty of Pharmacy
receptor activation. The Journal of Immunology 189(3): Universiti Kebangsaan Malaysia
1303-1310. Jalan Raja Muda Abdul Aziz
Wang, B., Zhang, S., Yue, K. & Wang, X.D. 2013. The recurrence 50300 Kuala Lumpur, Federal Territory
and survival of oral squamous cell carcinoma: A report of 275 Malaysia
cases. Chinese Journal of Cancer 32(11): 614-618.
Wang, Q., Gao, P., Wang, X. & Duan, Y. 2014. The early diagnosis Ian Charles Paterson
and monitoring of squamous cell carcinoma via saliva Department of Oral & Craniofacial Science
metabolomics. Scientific Reports 4(1): 1-9. Faculty of Dentistry
Xie, R., Xu, J., Wen, G., Jin, H., Liu, X., Yang, Y., Ji, B., Jiang, University of Malaya
Y., Song, P., Dong, H. & Tuo, B. 2014. The P2Y2 nucleotide 50603 Kuala Lumpur, Federal Territory
receptor mediates the proliferation and migration of human Malaysia
hepatocellular carcinoma cells induced by ATP. Journal of
Biological Chemistry 289(27): 19137-19149. Ian Charles Paterson
Xu, J., Vilanova, G. & Gomez, H. 2016. A mathematical model Oral Cancer Research and Coordinating Centre
coupling tumor growth and angiogenesis. PLoS ONE 11(2): University of Malaya
e0149422. 50603 Kuala Lumpur, Federal Territory
Yang, H., Geng, Y.H., Wang, P., Yang, H., Zhou, Y.T., Zhang, Malaysia
H.Q., He, H.Y., Fang, W.G. & Tian, X.X. 2020. Extracellular
ATP promotes breast cancer invasion and chemoresistance *Corresponding author; email: pyng@ukm.edu.my
via SOX9 signaling. Oncogene 39(35): 5795-5810.
Yang, X., Zhu, L., Lin, J., Liu, S., Luo, H., Mao, J., Nie, S., Chen, Received: 29 August 2020
L. & Wang, L. 2015. Cisplatin activates volume-sensitive Accepted: 23 April 2021
like chloride channels via purinergic receptor pathways in
nasopharyngeal carcinoma cells. The Journal of Membrane
Biology 248(1): 19-29.
A B
p-ERK p-ERK
p-p38 p-p38
p-JNK p-JNK
p38 p38
- 15 30 1 2 4 6 8 10 24 - 15 30 1 2 4 6 8 10 24
min hour min hour
SUPPLEMENTARY FIGURE S1. Activation of MAPK pathways ERK1/2, p38 MAPK and SAPK/JNK upon treatment
with 10 µM MRS2768 across a period of 24 h in OSCC cell lines (A) H376 and (B) H400. Experiments were
independently conducted once.
Supplementary Figure S1. Activation of MAPK pathways ERK1/2, p38 MAPK and SAPK/JNK upon treatment with 10 µM MRS2768
across a period of 24 h in OSCC cell lines (A) H376 and (B) H400. Experiments were independently conducted once.186
A p-ERK p-p38 p-JNK
Fold activation
p-ERK
p-p38
p-JNK
p38
- 15 30 1 2 4 6 8 10 24 - 15 30 1 2 4 6 8 10 24 - 15 30 1 2 4 6 8 10 24 - 15 30 1 2 4 6 8 10 24
min h min h min h min h
B p-ERK p-p38 p-JNK
Fold activation
p-ERK
p-p38
p-JNK
p38
- 15 30 1 2 4 6 8 10 24 - 15 30 1 2 4 6 8 10 24 - 15 30 1 2 4 6 8 10 24 - 15 30 1 2 4 6 8 10 24
min h min h min h min h
SUPPLEMENTARY FIGURE S2. Activation of MAPK pathways ERK1/2, p38 MAPK and SAPK/JNK
upon treatment with 100 µM ATPγS across a period of 24 h in OSCC cell lines (A) H376 and (B) H400. All
experiments were independently repeated three times. Data are represented as mean ± SEM. * p < 0.05, **
Supplementary Figure S2. Activation of MAPK
p < 0.01, pathways
and *** ERK1/2,
p < 0.01 p38 with
compared MAPK and SAPK/JNK
corresponding uponcontrol
negative treatment with 100 µM ATPγS
across a period of 24 h in OSCC cell lines (A) H376 and (B) H400. All experiments were independently repeated three times. Data are
represented as mean ± SEM. * p < 0.05, ** p < 0.01, and *** p < 0.01 compared with corresponding negative control.You can also read