Our look ahead at 2022: Striking a better balance
←
→
Page content transcription
If your browser does not render page correctly, please read the page content below
01 OVERVIEW
Our look ahead at 2022: Striking a better balance
Although health outcomes will remain important in 2022 given the emergence of the Omicron
variant, the outlook for macroeconomic policy will be more crucial as support and stimulus
packages enacted to combat the pandemic-driven downturn are gradually removed into 2022.
The removal of policy support poses a new challenge for policymakers and a new risk to
financial markets. Central banks will have to maintain the delicate balance between keeping
inflation expectations anchored and allowing for a supportive environment for economic
growth.
Feedback
While the global economic recovery is likely to continue in 2022, we expect the low-hanging
fruit of rebounding activity to give way to slower growth whether supply-chain challenges ease
or not (see figure).
Sources: Vanguard calculations, as of September 30, 2021.
02 INFLATION
Global inflation: Lower but stickier
Inflation has remained high across most economies, driven both by a higher demand as
pandemic restrictions were lifted and by lower supply resulting from global labor and input
shortages.
A return to 1970s-style stagflation—stagnant economic activity amid high unemployment and
inflation—is not in the cards. Vanguard continues to anticipate economic growth and, unlike in
the 1970s, demand for workers is high. We expect inflation to remain elevated across
developed markets as the forces of demand and supply take some time to stabilize (see figure).
Share Page
Although inflation should cool in 2022, its composition should be stickier. More persistent
Vanguard economic
wage-and shelter-based and
inflation market
should outlook:
remain elevated given2022
our employment outlook and
will be the critical determinant in central banks' adjustment of policy.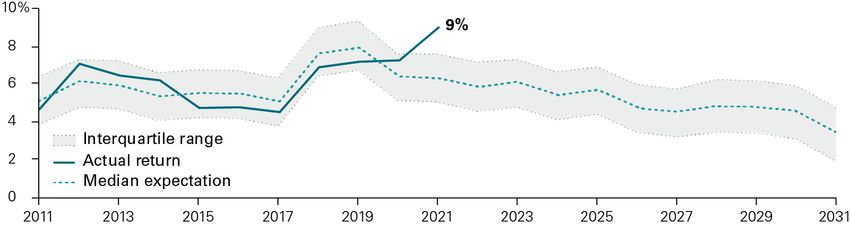
How long will high inflation last?
Notes: Data and Vanguard forecasts are for year-on-year percentage changes in the core Consumer Price
Index, which excludes volatile food and energy prices. Actual inflation is through September 2021 for the
Feedback
U.S. and China and through October 2021 for the euro area. Vanguard forecasts are presented thereafter.
Sources: Vanguard calculations, using data from Bloomberg and Refinitiv.
03 GLOBAL CAPITAL MARKETS OUT LO OK
Stocks: Valuations and projected returns
With valuations that have exceeded pre-pandemic highs, elevated inflation and the prospect of
policy normalization are creating a fragile backdrop for markets. Our long-term outlook for
global asset returns is guarded. This is especially true for equities, where high valuations and
lower economic growth rates mean we expect lower returns over the next decade.
Low expected returns for global equities, but opportunities
exist
Equity market 10-year outlook: Setting reasonable expectations
Share Page
Vanguard economic and market outlook: 2022Notes: The forecast corresponds to the distribution of 10,000 simulations of the Vanguard Capital Markets
Model® for 10-year annualized nominal returns in USD for asset classes highlighted here. Median volatility is
Feedback
the 50th percentile of an asset class's distribution of annualized standard deviation of returns. Asset class
returns do not take into account management fees and expenses, nor do they reflect the effect of taxes.
Returns do reflect reinvestment of dividends and capital gains. Indexes are unmanaged; therefore, direct
investment is not possible.
Source: Vanguard calculations, as of September 30, 2021.
IMPORTANT: The projections and other information generated by the Vanguard Capital Markets Model
regarding the likelihood of various investment outcomes are hypothetical in nature, do not reflect actual
investment results, and are not guarantees of future results.
Valuations drifting higher
Global equity markets valuation relative to fair value
Share Page
Vanguard economic and market outlook: 2022Notes: Developed-market equity valuation measures are the current CAPE percentile relative to the fair-value
CAPE for the local MSCI index. The U.S. valuation measure is the current CAPE percentile relative to fair-
value CAPE for the S&P 500 Index from January 1940 to September 2021. The ex-U.S. developed markets
valuation measure is the weighted average of each region's (Australia, U.K., euro area, Japan, and Canada)
valuation percentile. The emerging markets, U.S. value, and U.S. small-cap relative valuations are based on
the estimated relative percentile rank to fair value. The U.S. growth and large-cap valuations are composite
valuation measures of the style factor to U.S. relative valuations and the current U.S. CAPE percentile
relative to its fair-value CAPE. The relative valuation is the current ratio of the style factor to U.S. price/book
metrics relative to its historical average from January 1979 through September 2021. The estimates cover the
period beginning from January 1940 for the U.S., January 1970 for Australia and the U.K., January 1980 for
other developed markets, and September 1998 for emerging markets, and ended September 30, 2021.
Sources: Vanguard calculations, based on Robert Shiller's website, at aida.wss.yale.edu/~shiller/data.htm,
the U.S. Bureau of Labor Statistics, the Federal Reserve Board, and Refinitiv, as of September 30, 2021.
Feedback
The relative attractiveness of equity market segments
U.S. equities have outperformed our forecast, pushing our future return expectations lower,
while international equities have underperformed, pushing expectations higher. U.S. equities
have not been this overvalued since the dot.com bubble.
Despite the global divergence in health and economic outcomes, we believe that there is a
high probability that international equities will outperform U.S. equities in the coming decades.
The broad emerging-market valuation appears stretched based on its relationships with
aggregate inflation, real U.S. short-term yields, the spread between emerging-market and U.S.
central bank policy rates, economic conditions, and equity market volatility.
We expect value stocks to outperform by as much as the historical equity risk premium over
the next decade, mostly because of a decay in the overvaluation of growth stocks, not because
the "fair value of value" has returned to historical norms.
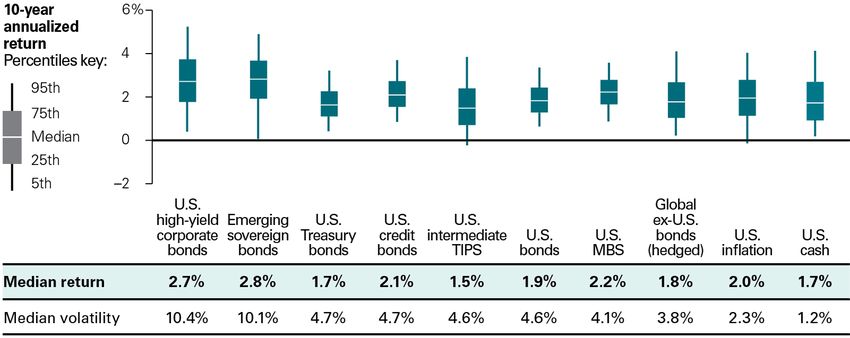
Bonds: Valuations and projected returns
Share Page
For fixed income, low (by historical standards) interest rates mean that investors should expect
Vanguard economic
lower returns. However, and
the fact market
that rates outlook:
have risen modestly2022
since 2020 means that our
outlook is commensurately higher.Against that backdrop of gradually rising rates, the fixed income return outlook in the next
decade has been ticking up from last year's projections.
Valuation expansion has chipped away at investors' sources
of extra yield
Higher rates have pushed expected fixed income returns higher
Feedback
Notes: The forecast corresponds to the distribution of 10,000 VCMM simulations for 10-year annualized
nominal returns in USD for asset classes highlighted here. Median volatility is the 50th percentile of an asset
class's distribution of annualized standard deviation of returns. Asset class returns do not take into account
management fees and expenses, nor do they reflect the effect of taxes. Returns do reflect reinvestment of
dividends and capital gains. Indexes are unmanaged; therefore, direct investment is not possible. U.S.
inflation is the 10-year average of year-over-year U.S. headline CPI.
Source: Vanguard calculations, as of September 30, 2021.
IMPORTANT: The projections and other information generated by the Vanguard Capital Markets Model
regarding the likelihood of various investment outcomes are hypothetical in nature, do not reflect actual
investment results, and are not guarantees of future results.
Share Page
Aggregate fixed income appears to be fairly valued, but
Vanguard economic and market outlook: 2022
pockets are stretchedBond markets valuation percentile relative to fair value
Notes: Valuation percentiles are relative to Year-30 projections from the VCMM. Credit (emerging sovereign,
high yield, and intermediate) and MBS valuations are based on current spreads relative to Year 30. Treasury
valuation is the key rate duration weighted average of the fundamental fair value model outlined. U.S.
aggregate bonds are the weighted average between intermediate-term credit and Treasury valuation
percentiles. TIPS valuation is the 10-year-ahead annualized inflation expectation relative to Years 21–30.
Feedback
Source: Vanguard calculations, as of September 30, 2021.
The relative attractiveness of fixed income market segments
Expected returns for non-U.S. bonds are marginally lower than for those of U.S. bonds, given
the relatively lower yields in non-U.S. developed markets. But the diversification through
exposure to hedged non-U.S. bonds should help offset some risk specific to the U.S. fixed
income markets.
Broad U.S. investment-grade bonds should outperform U.S. Treasury bonds by 50 basis points
on an annualized basis. Importantly, although future returns for fixed income remain at historic
lows, the COVID-19 crisis reaffirmed the role bonds play in a portfolio.
Within the U.S. aggregate bond market, investors are still expected to be compensated for
assuming credit risk, though by about half as much as we suggested in 2020, resulting from
continued tightening in credit spreads.
Treasury Inflation-Protected Securities (TIPS) appear less attractive than last year from a return
perspective amid moderated inflation expectations but could be a valuable inflation hedge for
some sensitive to inflation risk. Share Page
Caution is warranted when reaching for yield. High-yield funds are expected to return only one
Vanguard economic and market outlook: 2022
percentage point over Treasuries, but with volatility that is more than two times higher.With a negative correlation with equities that is similar to Treasuries, mortgage-backed
securities are projected to deliver a higher yield than Treasuries as compensation for bearing
interest-rate volatility risk.
About our forecast: A probabilistic framework
To treat the future with the deference it deserves, Vanguard has long believed that market
forecasts are best viewed in a probabilistic framework. Our primary objectives are to describe
the projected long-term return distributions that contribute to strategic asset allocation
decisions and to present the rationale for the ranges and probabilities of potential outcomes.
In the U.S., valuation changes and, to a lesser extent, earnings growth pushed realized returns
9.4 percentage points higher than our expectations on an annualized basis during the last
Feedback
decade. Low interest rates and inflation, along with higher-than-expected earnings, justify
some, but not all, of the error in our forecast (see figure).
Investor psychology and higher earnings explain most of the
error in our forecast
Share Page
Vanguard economic and market outlook: 2022Notes: The chart decomposes the difference between our 2011 forecast for U.S. equities as of September 30,
2011, and actual returns over the subsequent 10-year period. Returns are based on the MSCI US Broad
Market Index. Changes in valuations are broken down into the 10-year real yield and 10-year annualized
inflation based on our proprietary fair-value cyclically adjusted price/earnings (CAPE) model. "Behavior" is
the estimated level of overvaluation, which is described as the difference between actual CAPE and our
median estimate of fair value as of September 30, 2021. We classify this deviation as "behavioral" because it
is unexplained by the long-term, fundamental drivers of valuations based on our research. The numbers in
the table may not sum perfectly because of rounding.
Source: Vanguard calculations, as of September 30, 2021.
IMPORTANT: The projections and other information generated by the Vanguard Capital Markets Model
regarding the likelihood of various investment outcomes are hypothetical in nature, do not reflect actual
investment results, and are not guarantees of future results.
Feedback
Past performance is no guarantee of future returns. The performance of an index is not an exact
representation of any particular investment, as you cannot invest directly in an index.
In order for the gap that defined the last decade to persist into the next, one would have to
believe that economic growth will not be broad-based (that is, concentrated in a few sectors),
that interest rates will decline further, that inflation pressures will completely subside, and that
risk-seeking behavior will continue to push valuations away from fair value. These
assumptions are inconsistent with our economic analysis and the market-based expectations
that serve as inputs to our Vanguard Capital Markets Model (VCMM).
Although our economic outlook calls for modestly higher inflation and a normalization in
interest rates over the next decade, it will not be enough to raise our returns forecast to
historical averages. Achieving such returns will require a shift in the underlying secular forces
that have kept rates low across developed economies since the late 2000s. For this reason, our
confidence in our low-return outlook has only grown stronger (see figure), and we continue to
caution investors against extrapolating future results from the past.
Returns on a 60/40 balanced portfolio are expected to be
roughly half of what investors realized over the last decade
Share Page
10-year annualized returns
Vanguard economic and market outlook: 2022Notes: The chart shows the actual 10-year annualized return of a 60/40 stock/bond portfolio compared with
the VCMM forecast for the same portfolio made 10 years earlier. For example, the 2011 data point at the
beginning of the chart shows the actual return for the 10-year period between 2001–2011 (solid line)
compared with the 10-year return forecast made in 2001 (dotted line). After 2021 the dotted line is extended
to show how our forecasts made between 2012 and 2021 (ending between 2022 and 2031) are evolving. The
Feedback
interquartile range represents the area between the 25th and 75th percentile of the return distribution. The
portfolio is 36% U.S. stocks, 24% international stocks, 28% U.S. bonds, and 12% international bonds.
Source: Vanguard calculations, as of September 30, 2021.
IMPORTANT: The projections and other information generated by the Vanguard Capital Markets Model
regarding the likelihood of various investment outcomes are hypothetical in nature, do not reflect actual
investment results, and are not guarantees of future results.
Past performance is no guarantee of future returns. The performance of an index is not an exact
representation of any particular investment, as you cannot invest directly in an index.
04 NEXT STEPS
Portfolio implications for Vanguard’s 2022 market and
Share Page
Vanguard economic and economic outlook 2022
market outlook:Contact your sales representative to reserve your copy of our forthcoming guide on addressing
your clients' portfolio construction needs based on the market environment.
800-997-2798
Notes:
All investing is subject to risk, including the possible loss of the money you invest. Be aware
Feedback
that fluctuations in the financial markets and other factors may cause declines in the value of
your account. There is no guarantee that any particular asset allocation or mix of funds will
meet your investment objectives or provide you with a given level of income.
Diversification does not ensure a profit or protect against a loss.
Investments in stocks or bonds issued by non-U.S. companies are subject to risks including
country/regional risk and currency risk. These risks are especially high in emerging markets.
Bond funds are subject to the risk that an issuer will fail to make payments on time, and that
bond prices will decline because of rising interest rates or negative perceptions of an issuer's
ability to make payments.
U.S. government backing of Treasury or agency securities applies only to the underlying
securities and does not prevent share-price fluctuations. Unlike stocks and bonds, U.S.
Treasury bills are guaranteed as to the timely payment of principal and interest.
High-yield bonds generally have medium- and lower-range credit-quality ratings and are
therefore subject to a higher level of credit risk than bonds with higher credit-quality ratings.
IMPORTANT: The projections and other information generated by the Vanguard Capital
Markets Model regarding the likelihood of various investment outcomes are hypothetical in
nature, do not reflect actual investment results, and are not guarantees of future results.
VCMM results will vary with each use and over time.
Share Page
The VCMM projections are based on a statistical analysis of historical data. Future returns may
behave differently from the historical patterns captured in the VCMM. More important, the
Vanguard
VCMM may be economic
underestimatingand market
extreme negativeoutlook: 2022 in the historical
scenarios unobserved
period on which the model estimation is based.The Vanguard Capital Markets Model is a proprietary financial simulation tool developed and
maintained by Vanguard's primary investment research and advice teams. The model forecasts
distributions of future returns for a wide array of broad asset classes. Those asset classes
include U.S. and international equity markets, several maturities of the U.S. Treasury and
corporate fixed income markets, international fixed income markets, U.S. money markets,
commodities, and certain alternative investment strategies. The theoretical and empirical
foundation for the Vanguard Capital Markets Model is that the returns of various asset classes
reflect the compensation investors require for bearing different types of systematic risk (beta).
At the core of the model are estimates of the dynamic statistical relationship between risk
factors and asset returns, obtained from statistical analysis based on available monthly
financial and economic data from as early as 1960. Using a system of estimated equations, the
model then applies a Monte Carlo simulation method to project the estimated
interrelationships among risk factors and asset classes as well as uncertainty and randomness
over time. The model generates a large set of simulated outcomes for each asset class over
Feedback
several time horizons. Forecasts are obtained by computing measures of central tendency in
these simulations. Results produced by the tool will vary with each use and over time.You can also read