NTG Morning Comments www.nesvick.com - Friday, January 7, 2022 - Nesvick Trading Group
←
→
Page content transcription
If your browser does not render page correctly, please read the page content below
Friday, January 7, 2022
NTG Morning Comments
www.nesvick.com
Weather
No changes. Virtually the same conditions for all of
South America for the next 8-9 days. Active showers
in northern Brazil with mostly dry conditions
elsewhere. In Argentina, the key story of the next
week will be extreme heat. The Jan 10-16 timeframe
should see widespread 100+ daily highs with some
areas potentially posting 105-110F. However,
consistent with the past few days we’re still looking at
a pattern change at the end of the 6-10 day period
into the 11-15 day period. This will improve rainfall
chances for Argentina and southern Brazil, while
northern Brazil should see below normal precipitation
amounts. The improvement in rainfall will also help
bring temperatures down in Argentina.
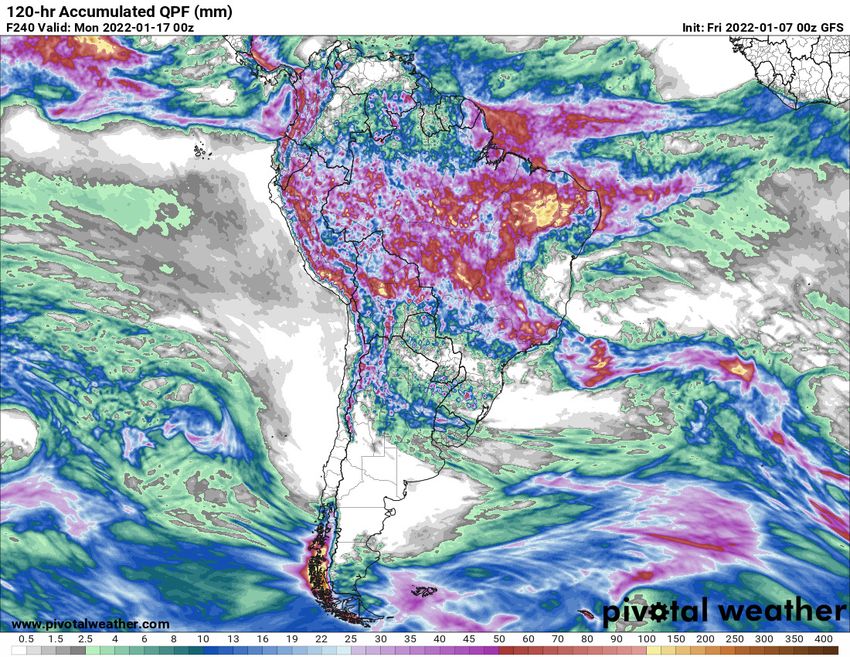
The maps at the right show the GFS model’s
precipitation forecast in roughly 5-day increments.
You can see the top two maps mostly sticking with the
pattern we’ve had recently, though some showers are
starting to work into Argentina late in that period.
The map at the bottom right shows a lot of rainfall
through Argentina and southern Brazil, with lighter
amounts to the north.
Nothing new for the US forecast. Active precipitation
in the southeastern US with limited precipitation
expected in the Southern Plains. There are hints of
some snow chances for the Southern Plains in the 11-
15 day period, but model inconsistency on this does
not allow for any confidence at this point in time.
Crops
Wrapping up our look at Dec 1 stocks this week with
corn. Quarterly stocks reports are notoriously difficult
to analyze in general, but for corn it is virtually
impossible. One thing we’ve learned over the past
few years is that corn stocks can be whatever NASS
wants them to be…so no reason to take any of this as
gospel.
Obviously the key to determining corn stocks is feed and residual and the first thing I look at for F&R is total corn
production. Earlier this week I noted expectations for a very slight reduction in the corn yield by 0.5 bpa.
Keeping acreage unchanged, this would result in a production reduction of 42 mb to a total of 15,020 mb. On its
1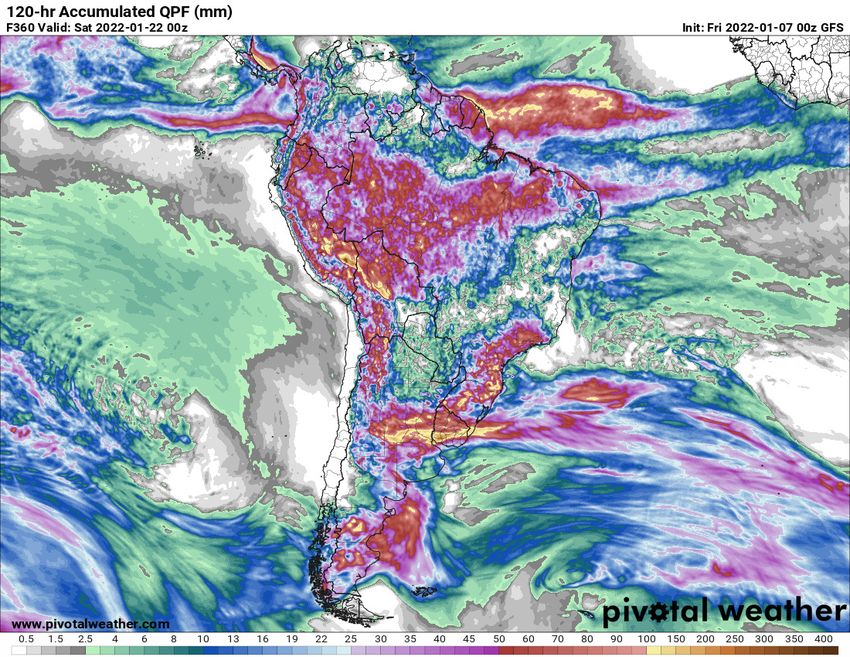
Friday, January 7, 2022
                                                                                                     NTG Morning Comments
                                                                                                          www.nesvick.com

own, that should hardly be a market mover, but crop size is a key variable in WASDE’s F&R model. I don’t think
the production adjustment, assuming I’m close to correct, would be enough to prompt a meaningful shift in
WASDE’s annual F&R projection. The chart below plots WASDE annual F&R figures vs. total production. While it
is far from a perfect relationship for reasons that should be obvious, I do think it illustrates that the current F&R
should be considered “in the ballpark” of a reasonable estimate for now.

                                                      US Corn Production vs. WASDE F&R Estimate
                              6,000                                                 07/08 19/20
                              5,800                                                                         21/22
                                                                                                  20/21
                                            06/07
                              5,600
                                                                                                    18/19     16/17
                              5,400                                                                14/1517/18
        Annual F&R Estimate

                              5,200
                                                                08/09               09/10 15/16
                                                                                             13/14
                              5,000
                                                                        10/11
                              4,800

                              4,600                                11/12

                              4,400           12/13

                              4,200
                                                                                                                     R² = 0.239
                              4,000
                                   10,000           11,000     12,000               13,000     14,000       15,000           16,000
                                                                         US Corn Production

So if the WASDE annual projection is reasonable under our assumptions, what would be a reasonable
corresponding SON F&R figure? The chart below is an attempt to determine this. It shows the absolute level of
SON F&R over the past several years along with the percentage it represents of the final annual total. At the
right you can see where my current leaning on 21/22 SON F&R lies. My current guesstimate calls for a little
more than 43% of the annual total to be seen in Q1. As you can see, this would be slightly above an “average”
level, but well below some years…like last year for example.

                                                                                2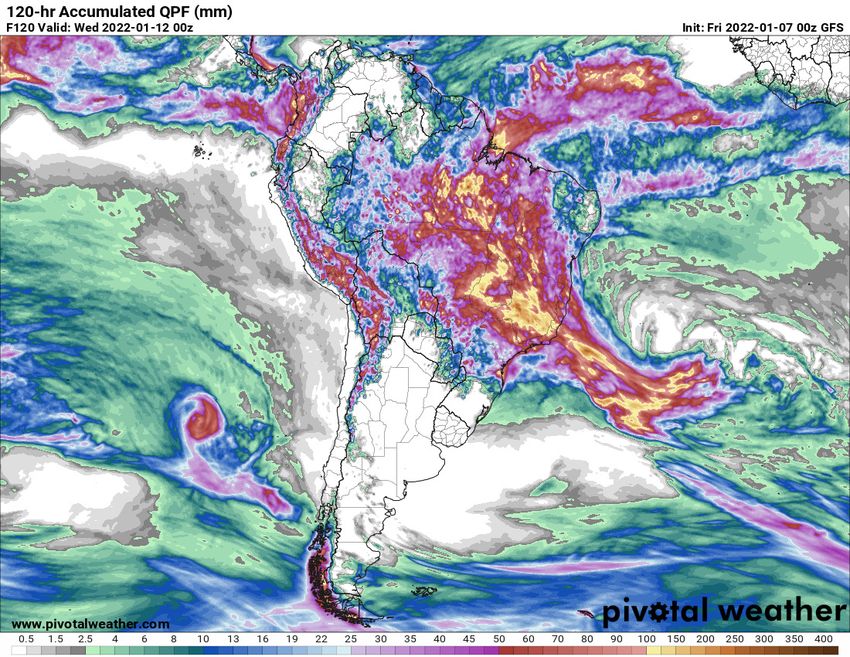
Friday, January 7, 2022
                                                                                      NTG Morning Comments
                                                                                           www.nesvick.com

                                         Sep-Nov Corn Feed & Residual
                      49%                                                                               2,900
                      48%                                          DZ Guess Implication-
                      47%                                                                               2,700
                      46%
                                                                                                        2,500

                                                                                                                Q1 Revised Feed/Res
                      45%
                      44%
         % of Final

                                                                                                        2,300
                      43%
                      42%
                                                                                                        2,100
                      41%
                      40%                                                                               1,900
                      39%
                      38%                                                                               1,700
                      37%
                      36%                                                                               1,500

                                                   Q1 F&R          % of Final

Is there a chance I could be understating SON F&R as a
percent of the total? Well, the short answer is – of course                      Sep 1 Stocks Report (Unrevised)
there is. I spent a little time trying to determine if there was                        Actual     Guess      Miss
any sort of clue in the years where SON F&R was a larger                        2012     988       1,126      (138)
percentage of the annual total. I’m not fully convinced, but                    2013     824        681        143
here is something I’ve found. As shown to the right, 3 out of                   2014 1,236         1,185        51
the 4 years we’ve seen elevated SON F&R as a percentage of
                                                                                2015 1,731         1,739        (8)
the annual total have followed Sep 1 stocks report that were
significantly smaller than expected. Admittedly, I can’t                        2016 1,738         1,754       (16)
explain why that should necessarily matter and I’ll also                        2017 2,295         2,346       (51)
concede that correlation is not causation, but I found it                       2018 2,140         2,010       130
somewhat interesting. And of course 2013 was a notable                          2019 2,114         2,418      (304)
exception, though clearly we dealing with a much smaller
                                                                                2020 1,995         2,266      (271)
F&R annual total. Anyway, this is partly why I’ve decided to
keep my SON percentage elevated but not “big”.                                  2021 1,237         1,153        84

My rundown of expectations follows in the breakdown below. My estimate is higher than the average guess.
Thoughts appreciated.

                                                            3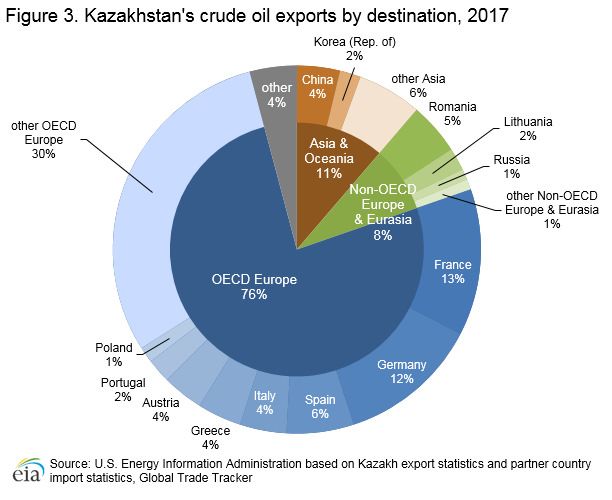
Friday, January 7, 2022
                                                                               NTG Morning Comments
                                                                                    www.nesvick.com

US Corn Quarterly Supply and Demand

                       14/15        15/16       16/17          17/18     18/19     19/20      20/21      21/22
Carryin (Sep 1)          1,232        1,731       1,737          2,293     2,140     2,221      1,919      1,236
Production              14,216       13,602      15,148         14,609    14,340    13,620     14,111     15,020
Sep-Nov Imports              5           13          14             11         6        18          6          6
 Total Supply           15,453       15,346      16,899         16,914    16,487    15,859     16,036     16,262
Sep-Nov
Feed & Residual          2,225        2,178       2,279          2,256     2,208     2,632      2,682      2,450
Food/Seed/Ind            1,615        1,631       1,689          1,743     1,710     1,628      1,612      1,684
Exports                    401          301         548            349       632       271        449        430
Total Use                4,241        4,111       4,516          4,347     4,550     4,531      4,743      4,564
 Stocks (Dec 1)         11,212       11,235      12,383         12,567    11,937    11,327     11,294     11,698

Livestock
We’ll take a quick look at Census beef trade numbers for November this morning. We’ll look at the pork
numbers on Monday. Total US exports in Nov were 98k mt, up from 93k in Oct and from 91k in Nov 2020. As
you can see in the chart below, this is yet another fairly solid export total.

                                              US Total Beef Exports
      110,000

      100,000

       90,000

       80,000

       70,000

       60,000

       50,000

                             2016        2017       2018          2019      2020     2021

The bigger story, I think, is the pace of US beef imports. Total imports are shown in the chart below, and you
can see we have not had the normal seasonal decline in US beef imports into the fall. There are a couple of

                                                           4
Friday, January 7, 2022
                                                                                              NTG Morning Comments
                                                                                                   www.nesvick.com

causes, but one that really sticks out is the increase in imports of Brazilian beef…which we’ve talked about
before. Brazilian beef imports hit a new record in Nov totaling over 12k mt, up from under 6k mt during Nov
2020. Brazilian beef represents 12% of total US imports now compared to 7% at this time last year and only 2-
3% to start 2020. Normally at this time of year the US is a net exporter of beef, but in part due to the surge in
Brazilian imports, we remain a net importer.
                                                US Total Beef Imports
          140,000
          130,000
          120,000
          110,000
          100,000
           90,000
           80,000
           70,000
           60,000
           50,000
           40,000

                        2015          2016          2017              2018          2019          2020          2021

                                                    US Beef Net Imports
          50,000

          40,000

          30,000

          20,000

          10,000

               0

         (10,000)

         (20,000)

         (30,000)

                               2016          2017          2018              2019          2020          2021

                                                                  5
Friday, January 7, 2022
NTG Morning Comments
www.nesvick.com
Financials
The big item on tap today is the NFP release first thing this morning. I have no expertise in predicting a precise
number, but I will reiterate what I said on Wednesday ahead of the ADP release – every recent labor-related
piece of data has been indicative of a strong labor market. I would expect today’s release to reflect that. The
chart below shows one such supportive bit of data. The Conference Board’s Jobs-Hard-To-Get index has long
been strongly correlated with the unemployment rate. That correlation broke down a bit during the pandemic
(all the dots well above the trendline) but it is starting to line-up again. The red line shown on the chart shows
the latest Jobs-Hard-To-Get reading. Pre-pandemic this was an area to expect a sub-4% unemployment rate. Is
it possible we could be below 4% today? The consensus expectation for today’s unemployment rate is 4.1%, but
I’d be on the lookout for a lower number.
16
14
12
U3 Unemployment Rate
10
8
6
4
y = 0.1583x + 1.8106
R² = 0.7148
2
8 10 12 14 16 18 20 22 24 26 28 30 32 34 36 38 40 42 44 46 48 50
Conference Board Jobs Hard to Get
Energy
Crude oil prices continue to keep grinding higher. As of yesterday’s rally, WTI prices have completely erased the
“coordinated SPR release” break. I wonder what our all-knowing politicians will throw at the market next?
Along those lines, I found these comments from CEO of Hess yesterday somewhat interesting:
*HESS SEES CURRENT GLOBAL OIL DEMAND AT ABOUT 99M BBLS A DAY
*HESS SEES OIL DEMAND IN RANGE 102M-103M BBLS/DAY BY END OF '22
*HESS SEES OIL DEMAND BY 2030 IN RANGE OF 105M-106M BBLS A DAY
*HESS SEES GLOBAL OIL GOING INTO STRUCTURAL SUPPLY DEFIFICIT
So Hess sees current global oil demand basically back to pre-pandemic norms and they see it continuing to grow
over the next several years. Where is the production growth coming from? OPEC continues to show an inability
6Friday, January 7, 2022
NTG Morning Comments
www.nesvick.com
to hit their increased production quotas. Perhaps the articles suggesting OPEC doesn’t have the spare capacity
they claim to have are correct. US production is gradually increasing, but hard to imagine it getting back to pre-
pandemic levels any time soon.
Quick chart on Kazakhstan oil exports. Looks like Europe is the area that could be cut short if oil export
disruptions persist.
Today’s Calendar (all times Central)
• NFP – 7:30am
Thanks for reading.
David Zelinski
dzelinski@nesvick.com
901-766-4684
Trillian IM: dzelinski@nesvick.com
DISCLAIMER:
This communication is a solicitation for entering into derivatives transactions. It is for clients, affiliates, and
associates of Nesvick Trading Group, LLC only. The information contained herein has been taken from trade and
statistical services and other sources we believe are reliable. Opinions expressed reflect judgments at this date
and are subject to change without notice. These materials represent the opinions and viewpoints of the
7Friday, January 7, 2022
NTG Morning Comments
www.nesvick.com
author and do not necessarily reflect the opinions or trading strategies of Nesvick Trading Group LLC and its
subsidiaries. Nesvick Trading Group, LLC does not guarantee that such information is accurate or complete and it
should not be relied upon as such.
Officers, employees, and affiliates of Nesvick Trading Group, LLC may or may not, from time to time, have long
or short positions in, and buy or sell, the securities and derivatives (for their own account or others), if any,
referred to in this commentary.
There is risk of loss in trading futures and options and it is not suitable for all investors. PAST RESULTS ARE NOT
NECESSARILY INDICATIVE OF FUTURE RETURNS. Nesvick Trading Group LLC is not responsible for any
redistribution of this material by third parties or any trading decision taken by persons not intended to view this
material.
8You can also read