Nomura ASEAN Virtual Conference 2021 - Singapore Exchange Limited - A multi-asset market platform - Singapore ...

Page created by Franklin Guzman
 
CONTINUE READING
Nomura ASEAN Virtual Conference 2021 - Singapore Exchange Limited - A multi-asset market platform - Singapore ...
Nomura ASEAN Virtual Conference 2021
Singapore Exchange Limited –
A multi-asset market platform
2 March 2021

Singapore Exchange
Nomura ASEAN Virtual Conference 2021 - Singapore Exchange Limited - A multi-asset market platform - Singapore ...
Contents
1   Who we are                                          2
    -   Our background
    -   International footprint
    -   Trends and strategy, organizational structure
    -   Investments for growth
    -   Key Financials
    -   Outlook

2   Fixed Income, Currencies & Commodities              12

3   Equities (Derivatives and Cash)                     20

4   Data, Connectivity and Indices                      24

5   Other Information                                   30

6   Appendix                                            34
Who we are

             2
Award-winning diversified exchange group
A diversified exchange group that runs key market infrastructure including the Singapore
securities market and a pan-Asian derivatives exchange covering all major asset classes.

           Exchange of the Year
   FOW Asia Capital Markets Awards 2020
                                                 • High operating margin of 54% in FY2020

 Asia-Pacific Derivatives Exchange of the Year
                                                 • High ROE of 40% and Operating cash flow of 58 cents per
 GlobalCapital Global Derivatives Awards 2020      share
          Best FX Exchange in Asia               • Dividend of 30.5 cents per share in FY2020, going forward,
        FX Markets Asia Awards 2020                annualised quarterly dividend will be 32 cents per share
            Best Exchange for FX                 • Most liquid international market for pan-Asian listed
        FX Markets e-FX Awards 2020
                                                   derivatives
            Exchange of the Year
  Regulation Asia Awards for Excellence 2020
                                                 • Most international exchange in Asia with 46% cross-border
                                                   listings
 Financial Metals Service Provider of the Year
  Standard & Poor Global Platts Awards 2019
                                                      Anchored in Singapore, Asia’s only AAA-rated economy
       Derivatives Exchange of the Year
                                                      Reputation for good corporate governance, infrastructure, regulation
            Asia Risk Awards 2019
                                                      and strength of the broader advisory ecosystem

                                                                                                                             3
Our international footprint
 Anchored in Singapore with global reach, serving a diverse set of international clients seeking
 Asian opportunities.
                                                                    Key roles of our International offices

                                                                ▪    Our key clients include: Sell-side
                                                                     participants, Interdealer brokers, Corporate
                                                                     trade clients, Institutional investors, Asset
                                                                     managers and Proprietary Trading Groups.
                                                                     T+1 volumes increased 28% y-o-y in
                                                                     FY2020.
                                                                ▪    Engage existing clients and acquire new
                                                                     clients to improve liquidity (Fixed Income,
                                                                     Currencies, Commodities, Equities and
                                                                     Data, Connectivity and Indices).
                                                                ▪    Increase memberships and listing of equity
Our offices:                                                         and debt instruments.

    Beijing      Chicago       Hong Kong    London     Mumbai

   New York    San Francisco   Shanghai    Singapore   Tokyo

                                                                                                                     4
Diversified and growing business
•   Diversified revenue streams from cash equities, pan-Asian derivatives and market data / connectivity
•   Growth largely driven by derivatives1 with revenue contribution increasing from 40% to 49% between
    FY2016 and FY2020
•   Net profit grew 8% per annum over same period
•   FICC and DCI contribution increased from 21% in FY2016 to 33% in 1H FY2021
                                                                 Revenue Breakdown
           Revenue $818 million                                      Revenue $1,053 million                                   Revenue $521 million

           Net Profit: $349 million                                  Net Profit: $472 million                           Adjusted Net Profit: $228 million

                     31%                                                       37%                                                     28%

                                                                                                   Equities: 73%                                          Equities: 67%
                                        Equities: 79%
                                                                                                                                       39%
                     49%                                                       37%

                                                                               11%                                                     14%
                     11%                                                                           FICC + DCI: 27%                                        FICC + DCI: 33%
                     10%
                                        FICC + DCI: 21%                        16%                                                     19%

                   FY2016 2                                                FY2020                                                 1H FY2021
                                        FICC            DCI          Equities - Cash            Equities - Derivatives

             Note: Figures may be subject to rounding   1   Derivatives include equity, currency and commodity futures and options 2 Internal determination
                                                                                                                                                                     5
Macro and investor trends shaping markets today

                                                                                              Investment and
                             Region /               Asset Class
        Macro                                                            Platform                   Risk
                              Country
     environment                                     Selection           Selection             Management
                             Selection
                                                                                                 Solutions

      Prolonged low     Asia leads in global        Multi-asset          Regulatory
                                                                                            Cross-border solutions
      interest rates           growth                strategy              impact

     Global economic   Internationalisation of   Growth of passive   Electronification of       Single-point
        slowdown           Asian markets            investing           OTC markets                access

                                                                                                                     6
Executing our strategic priorities

  Market
  trends
            Prolonged low     Asia leads in global         Multi-asset          Regulatory         Cross-border solutions
            interest rates           growth                 strategy              impact

           Global economic                              Growth of passive   Electronification of       Single-point
                             Internationalisation of
              slowdown                                     investing           OTC markets                access
                                 Asian markets

                Build a                                    Grow                            Widen
               multi-asset                             international                    partnerships
               exchange                                  presence                       and networks

                                                                                                                            7
Four business and client units (from 1 July 2019)
Four business and client units covering the entire exchange value chain, resulting in diversified
and resilient revenue streams.

  Fixed Income, Currencies and                                                                       Data, Connectivity
                                                                 Equities
       Commodities (FICC)                                                                             and Indices (DCI)

▪ Fixed Income Listing & Trading                 ▪ Equity Listings                           ▪ FICC and Equities market data
▪ Trading & Clearing of Pan-Asian currency       ▪ Trading & Clearing of Pan-Asian equity    ▪ API and Co-location connectivity
  and commodity derivatives                        index derivatives, cash equities, ETFs,   ▪ Development and bespoke calculation of
                                                   Structured Warrants, REITs, DLCs, etc.      indices
                                                 ▪ Delivery, Settlement and Custody of
                                                   securities

                                                Global Sales and Origination (GSO)

  ▪   Nine international offices and specialist sales teams

                                                                                                                                        8
Our strengths as a multi-asset marketplace

    Wide range of Asian portfolio risk           Capital Efficiency through
    management and access solutions              Margin-Offsets, creating
                                                 customer stickiness
    Liquid futures & options products in key
    asset classes such as equities, currencies   Cross-asset margin offsets resulting in
    and commodities                              savings of 30% to 90%

    Round-the-clock trading covering             Trusted clearing house and
    Asian & Western time zones                   high skin in the game

    Ability for global participants to manage    Committed to the safety of the market by
    their portfolio risk 22.5 hours a day        contributing 25% to the clearing fund

                                                                                            9
Robust financials
▪ High EBITDA margin, operating profit margin and ROE of 62%, 54% and 40% respectively
▪ Dividend of 30.5 cents per share
                                                       FY2016                    FY2017                  FY2018                   FY2019                   FY2020
  Revenue ($ million)                                     818                      801                     845                      910                     1,053
  EBITDA ($ million)                                      469                      460                     486                      524                      6561
  EBITDA margin                                           57%                      57%                     58%                      58%                      62%
  Operating profit ($ million)                            409                      402                     425                      461                      566
  Operating profit margin                                 50%                      50%                     50%                      51%                      54%
  Net profit ($ million)                                  349                      340                     363                      391                      472
  attributable to SGX
  Return on equity                                        36%                      34%                     34%                      36%                      40%

      Operating cash flow per share (cents)                            Earnings per share (cents)                                Dividend per share (cents)
                                       58.4
                                                                                                         44.1
                                                                                     33.9     36.5                                            30.0       30.0         30.5
   39.6                  39.9       39.0                      32.6        31.7                                          28.0       28.0
              35.3

 FY2016     FY2017      FY2018     FY2019     FY2020         FY2016     FY2017     FY2018    FY2019     FY2020         FY2016    FY2017     FY2018     FY2019        FY2020
Note: All figures in $ millions unless otherwise stated and may be subject to rounding
                   1Adoption of SFRS(I) 16 Leases: Rental expenses relating operating leases for data centers and office premises are now recorded as depreciation
                   expense and finance charges.                                                                                                                              10
Advancing to the next phase of our growth strategy with
our customers
• Well-placed to meet investment and risk management needs of our customers through our
  multi asset strategy
• Investments into cash equities is anticipated to grow, while portfolio risk management
  activities may rise due to shifts in US policies under its new administration.

   Fixed Income, Currencies               Equities                            Data, Connectivity &             Global Sales &
     & Commodities (FICC)                                                        Indices (DCI)                Origination (GSO)

  ▪ Platform for OTC and on-      ▪ Expand suite of Equity                  ▪ New indices in sustainable   ▪ New customer acquisition
    exchange FX through BidFX       Derivatives                               capital and finance            and cross-selling
  ▪ Build Asian NDF volume and    ▪ Develop ESG-related                     ▪ Expand range of iEdge and    ▪ Grow distribution through
    G10 Spot and Swaps              investment opportunities                  Scientific Beta thematic       partnerships
  ▪ Financialisation of our       ▪ More single stock futures                 indices
                                                                                                           ▪ Targeted sales strategy
    commodities suite               and structured products

                                                      Sustainability
       We launched SGX FIRST, Asia's only multi-partner, multi-asset exchange-led sustainability platform, facilitating
            collaboration within our ecosystem to catalyse change and deliver growth in a sustainable manner

                                                             Confidential                                                                11
Fixed Income, Currencies and Commodities (FICC)
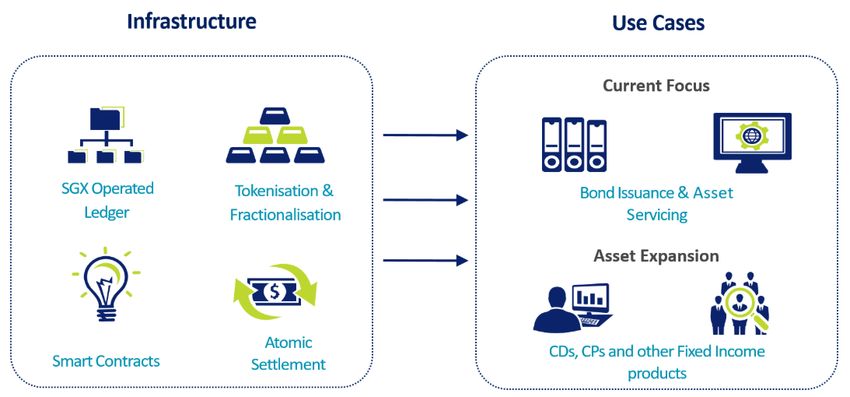
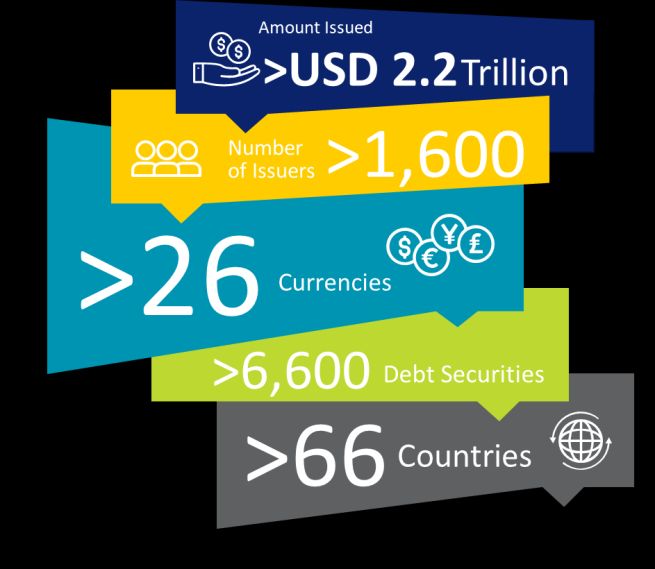
                                                  12
We are driving the digitalisation of fixed income capital
markets across issuance, custody, depository and trading
Asia’s most global and diversified listing venue   Advancing digital asset infrastructure in capital markets

                                                    Marketnode

                                                    Enhancing liquidity and execution in the Asian bond market for global clients

                                                    XinTru
                                                     •   Diverse participant base across Asia Pacific, UK, Switzerland and the Middle East
                                                     •   Advanced technology and rich analytics
                                                     •   General Counterparty solution for competitive trade execution and increased
                                                         operational efficiency

                                                                                                                                             13
Largest and fastest growing currency futures exchange in Asia
                        Size of Market                     Singapore                          SGX
                        ▪      Largest financial market    ▪     Largest FX center in Asia    ▪   Diverse Asian currency suite
                               globally with US$6.6              Pacific, third largest           of 23 currency futures and 2
                               trillion traded OTC daily         globally                         options contracts
                        ▪      Asian NDFs is a US$153      ▪     US$633 billion traded        ▪   >80% market share in
        Currencies

                               billion market that has           OTC daily                        USD/CNH and > 60% market
                               potential to be futurised   ▪     Leading global trading           share in INR/USD
                        ▪      Regulatory trends favour          venue for key Asian          ▪   Notional on-exchange FX
                               shift to on-exchange              currencies                       ADV of US$5.9B in FY20
                               clearing                                                       ▪   Innovative FlexC FX futures
                                                                                                  feature
                                                               Key SGX Highlights             ▪   Acquisition of BidFX

  23 2
  Futures            Options
                                       124% US$10.08Bn ~US$1.4T
                                      Total Volume –       Open Interest value         Notional value traded in
   Diverse Asian
                                           CAGR               (Dec 2020)                        2020
      FX suite
                                      Nov 13 – Dec 20                                       up 8.9% y-o-y       Expanding Network

                                                                                                                                 14
Note:
                                                                                                                          Volume ('000 Contracts)

                                                                                                                      -
                                                                                                                                 100
                                                                                                                                             200
                                                                                                                                                            250

                                                                                                                           50
                                                                                                                                       150
                                                                                                           Nov-13
                                                                                                            Jan-14
                                                                                                           Mar-14
                                                                                                           May-14
                                                                                                             Jul-14
                                                                                                           Sep-14

     Data as at 30 November 2020
                                                                                                           Nov-14
                                                                                                                                                   Volume

                                                                                                            Jan-15
                                                                                                           Mar-15
                                                                                                                                                   Open Interest

                                                                                                           May-15
                                                                                                             Jul-15
                                                                                                           Sep-15
                                                                                                           Nov-15
                                                                                                            Jan-16
                                                                                                           Mar-16
                                                                                                           May-16
                                                                                                             Jul-16
                                                                                                                                                                                                                               133% volume CAGR since November 2013

                                                                                                           Sep-16
                                                                                                           Nov-16
                                                                                                            Jan-17
                                                                                                           Mar-17
                                                                                                           May-17
                                                                                                             Jul-17
                                                                                                           Sep-17
                                                                                                           Nov-17
                                                                                                            Jan-18
                                                                                                           Mar-18
                                                                                                           May-18
                                                                                                                                                                                                                                                                      Currency Futures as a growth driver

                                                                                                             Jul-18
                                                                                                           Sep-18
                                                                                                           Nov-18
                                                                                                            Jan-19
                                                                                                           Mar-19
                                                                                                           May-19
                                                                                                             Jul-19
                                                                                                           Sep-19
                                                                                                           Nov-19
                                   Asia’s Best FX Exchange & Clearing House – by FX Week (2018 and 2019)

                                                                                                            Jan-20
                                                                                                                                                                   SGX Currency Futures – Total Daily Volume & Open Interest

                                                                                                           Mar-20
                                                                                                           May-20
                                                                                                             Jul-20
                                                                                                           Sep-20
                                                                                                           Nov-20
                                                                                                                      -
                                                                                                                           50
                                                                                                                                 100
                                                                                                                                             200
                                                                                                                                                            250

                                                                                                                                       150

                                                                                                                      Open Interest ('000 Contracts)
15
BidFX provides SGX opportunity to target a larger OTC FX
market
 OTC FX Trading in 2019: US$6.6 trillion traded daily                                                             Synergistic opportunities from BidFx’s strengths:
 Exchange-traded FX derivatives 2019: US$0.16 trillion traded
                                                                                                                  •      Asian NDF
Global OTC FX Trading in 2019 – by instrument type
                                                                                                                  •      G10 Spot & Swaps
               OTC Options
                   4%
     OTC Currency                                                                                                 •      International footprint
      Swaps 2%

                                                                                                                  OTC FX: Increasing growth of EM currencies1
                    OTC Outright                                                                                          US$ Trillion ADV, 2001-2019
                     Forwards                                                                                                1.2                  4.0                 6.6
                                                    OTC Spot
                        15%                                                                                                   6%                  12%
                                                      30%                                                                                                             22%                     EM
                                                                                                                                                                                              G10
                                                                                                                            94%                  88%
                       OTC Swaps, 49%                                                                                                                                78%

                                                                                                                            2001                2010                 2019

Source: BIS Triennial Central Bank Survey 2019 and SGX estimates
                 1. EM currencies are defined by BIS as EME currencies, which include non-EM currencies such as SGD and HKD even though these are not classified as “emerging” economies Adjusted for
                    local and cross-border inter-dealer double counting (i.e. net-net basis). Excludes exchange-traded derivatives.
                                                                                                                                                                                                        16
Potential to capture greater electronification of FX market
BidFX is positioned as a buyside Multi-Dealer Platform (MDP), which has gained 6% share since 2016

                                                   Breakdown of FX volumes by Execution Methods
                                                                      Percentage shares in total turnover

             Broad voice and electronic execution methods (%)                                  Breakdown of electronic execution methods (%)
                              Voice
                             indirect
                                                              Electronic
                                                                                                                     Single-bank platforms
                                                                direct
                                                                                  Direct Bank                              (SDP), 15%
                                      13 (-2)
                                                    28 (-5)                       Platform
                Voice                                                                                                     Others, 13%
                direct                                                                                       (e.g. Direct electronic price streams)
                             27 (0)
                                                                                                                 Disclosed venues (MDP), 13%
                                                29 (+6)                           Multi Dealer
                                                                                  Platform
                                                              Electronic                                        Anonymous venues (ECN), 16%
                     Undistributed                             indirect
                        3 (+1)
                                           () – Growth from 2016 to 2019

                         100%= ADV US$6.6 Trillion

 SDP: Single Dealer Platform, individual bank proprietary trading which only allows clients to trade with the bank
 MDP: Multi-Dealer Platform, electronic venue (usually 3rd party) for clients to access liquidity from many banks
 ECN: “Electronic Communication Network” that automatically matches buy and sell orders on a anonymous basis and provides direct access to market participants. It
 resembles the ‘exchange’ trading model

                                                                                                                                                                     17
Extensive Suite Of Commodities Products
                                ▪ Complements Singapore’s commodities hub status
                                ▪ Demand for industrial commodities set to continue amid sustained urbanisation
                                                                                                                                                                      Price-Discovery Centre For The Steel Value Chain
                                                        Urbanisation and Steel Production
                                1.2                                                                                    2.5                                                         Coking Coal                 Iron Ore
                                                                                                                                                                                    FOB Australia,              CFR China

                                                                                                                             World Steel Production, in billions MT
                                1.0                                                                                                                                                   CFR China
Urban Population, in Billions

                                                                                                                       2.0
                                                                                                        2.3%
                                0.8                                                                     CAGR
                                                                                          3.1%
                                                                                                                       1.5
                                                                                          CAGR
                                0.6                                         3.7%
                                                                                                                                                                                                      Steel
                                                                            CAGR                                                                                                             HRC Steel (CFR ASEAN)
                                                              4.5%                                                     1.0
                                0.4                           CAGR
                                                5.1%
                                               CAGR1                                                                   0.5
                                0.2
                                                                                                                                                                                                     Freight
                                                                                                                                                                                                Time Charter FFA
                                    -                                                                                  0.0
                                        2000           2005          2010          2015          2020          2025e                                                                 (Cape, Panamax, Supramax, Handysize)
                                                                            Year                                                                                                            Single Routes (C5, 2A, 3A)
                                                  China Urban Population                   World Steel Production

                                Source :
                                UN Population Division, https://population.un.org/wup/DataQuery/
                                                                                                                                                                                             Maritime Indices
                                Steel production statistics: World Steel Association

                                1   CAGR in chart relates to growth of China’s Urban Population

                                                                                                                                                                                                                            18
The leading offshore Iron Ore risk management hub
          Size of Market                      Singapore                         SGX
          ▪   Largest in the metal market     ▪    Leading merchant hub for     ▪    Global pricing and risk
              by tonnage                           commodities houses with           management centre
          ▪   Notional value of >US$115B           ~140 metals and mineral      ▪    Cleared 2.1 billion MT of iron
              traded annually in the               companies                         ore in 2020
   Iron       physical market                 ▪    Include top iron producers   ▪    Offers a complete iron ore
   Ore    ▪   Asia’s first truly global            e.g. Vale, Rio Tinto, BHP         suite: 58% Fe, 62% Fe, 65%
              commodity, with China a              Billiton                          Fe, lump Fe
              major consumer                                                    ▪    Steel value chain incorporating
          ▪   Increasing financialisation                                            coking coal and freight
              of Iron Ore

                                                  Key SGX Highlights

  2.1 billion MT                      > 99%                            Fe 65%                       1.5x
      cleared in CY2020             market share of              New high-grade Fe                of paper to
                                   international iron             futures contract               physical ratio
                                      ore volumes                                              Potential to grow
                                        cleared

                                                                                                                       19
Equities (Derivatives and Cash)

                                  20
Rapidly growing offshore market for Asian Equity Derivatives
Multi-asset exchange, offering a broad range of Asian access and risk management solutions

                                                   Volumes and open interest, in millions
                                                                                                                  3.89              4.37
                                                                                                                                                3.79
                                      3.08             2.94                                           2.73
                                                                        2.39           2.41
  1.11                1.48

                                                                                                 Volume +88%                    199
                                                                                                                                              192
                                                                                                                                19
                                                                                                                 167                           21      Others*
                                                                                       163                                      10
                                                                        153                                                                    11      Nikkei Options
                                                                                        8                        15             21
                                                                         5              6            140                                       23      MSCI Taiwan
                                                                         6              17                       12
                Volume +56%                                             17                            10                        21
                                                                                                      5          20                            24      Nifty 50
                                                                                       21                                       23
                                       102             101               21                           19         22                                    Nikkei Futures
                                        7               4                              27                                                      26
                                                        1                27                           20
                       77               8                                                                        23
   66                                  18              18                                             21
                       6 3
    5     1            18               15               17
   16                                                                                                                          106
                       15                                28              78            84                                                      88      China A50
   13                                  37                                                             64         75
   29                  29
                             6               17          24
          2
 FY2011             FY2012          FY2013           FY2014            FY2015        FY2016         FY2017      FY2018        FY2019         FY2020
         China A50 Futures              Nikkei Futures              Nifty Futures         MSCI Taiwan Futures      Nikkei Options          Others
                                                                       Year-End Open Interest (M contracts)

                *
                    Others comprise mainly MSCI Singapore Futures
                                                                                                                                                           21
SGX is the Most International Exchange
    More than 40% of total market cap of companies listed on SGX are overseas companies
                                                                                                                                             Others,
                                                                                                                                               1%

                                                                                                                                                              Southeast Asia,
                                                                                                                   Greater China,
                                                                                                                                                                   31%
                                                                                                                       38%

         Singapore Exchange                                                                          Non-
             695 Listed Companies                                                                 Singapore
             Market Capitalization                             Singapore                             45%
                US$655 billion                                    55%
                                                                                                                                                             Europe & US,
                                                                                                                        Japan & Korea,
                                                                                                                                                                 16%
                                                                                                                             13%
                                                                                                                                             Australia, 2%

Australia Securities      Hong Kong Stock Exchange London Stock Exchange                                NASDAQ            New York Stock Exchange Tokyo Stock Exchange
     Exchange
                                                                      Non-                            Non-                          Non-                              Non-
                                                                      UK,                              US                            US,                             Japan
  Non-                                                                                                18%                                                             0.1%
                                 Non-                                 16%                                                           18%
   AU
  7.2%                           China
                                 7.3%

           AU                             China*                                UK,                           US                           US,
                                                                                                                                                                 Japan
          92.8%                           92.7%                                 84%                          82%                           82%
                                                                                                                                                                 99.9%

  *Note: Greater China includes Hong Kong,Taiwan and Mainland China companies
                       Source:   Bloomberg (January 2021) , Singapore Exchange (January 2021), Exchange Websites
                                                                                                                                                                             22
Top Sectors on SGX
Consumer                                                              Technology                                                                     Healthcare

 PE: 24x                                                              PE: 23x^                                                                       PE: 53x

  ▪ Includes food & beverage,                                         ▪ Includes technology hardware &                                            ▪ Full range of companies from
    retail and others                                                   equipment, digital, semiconductor and                                       pharmaceuticals, healthcare
                                                                        telecommunications services
  ▪ 136 companies with market                                                                                                                       services to medical devices
                                                                        companies. Other businesses include
    cap of US$58 billion                                                media, clean tech and engineering.                                          technology
                                                                      ▪ 81 companies with market cap of                                           ▪ 35 companies with market cap of
                                                                        US$59 billion                                                               US$82 billion

 Maritime, Offshore                                                    Commodities                                                               Real Estate
 Services & Energy
  PE: 15x                                                              PE: 17x                                                                       PB: 0.9x

  ▪ Asia’s largest cluster of listed                                                                                                             ▪ Asia’s broadest range of real estate
                                                                      ▪ Includes Agri-commodities,
    companies                                                                                                                                      companies and property trusts
                                                                        Mineral & Oil & Gas Companies
  ▪ 61 companies and 2 business                                                                                                                    covering global real estate assets
                                                                      ▪ 35 companies with market cap of
    trusts with market cap of US$17                                                                                                              ▪ 105 real estate companies and
                                                                        US$37 billion                                                              property trusts with market cap of
    billion
                                                                                                                                                   US$135 billion
Source:   Bloomberg & Singapore Exchange (January 2021)

                 Note:      ^ Excludes the PE of telecommunication services companies by GICS sub-industry classification
                            Calculated using Market Capitalization Weighted PE Ratio, Companies with PE >100 excluded from the PE calculations for all sectors.                      23
Data, Connectivity and Indices (DCI)

                                       24
Overview
Data, Connectivity and Indices

                                                                      ▪ Market infrastructure business driven by
                                                                        increased use of technology in trading

                                              121
                                                                      ▪ Supports Securities and Derivatives
                                                                        Trading:
          98                     103
                                                                        Data:           Price data, Company
                                                       Connectivity                     Announcements,
                                               62
            56                    60                                                    Financial Indices

                                                                        Connectivity:   Trading system
                                                        Market                          connections,
                                               59       Data
            42                    43                                                    Network linkages and
                                                                                        Data center co-location
         FY2018                FY2019         FY2020

Note:   Numbers may be subject to rounding.

                                                                                                                   25
Index Business
▪ Global Exchange Traded Products (index-based) have AUM of > US$4tn
▪ Index funds (unlisted) has grown >230% to > US$ 6tn since 2007
▪ Acquisition of Scientific Beta (SB) in February 2020

             Index Calculation Service                          Proprietary Indices

       ▪ Calculating for leading investment banks and     ▪ SGX iEdge Domestic Indices
         asset managers                                     - SGX Thematic indices e.g. S-REIT 20
                                                            - SGX Sustainability index
       ▪ Flexible index engine for calculating and
         disseminating wide variety of indices            ▪ SGX iEdge Regional Indices
                                                            - SGX Developed Asia Quality Dividend Index
       ▪ Strong governance framework to meet regulatory     - SGX APAC Dividend REIT
         requirements                                     ▪ Smart Beta Indices
       ▪ Established capabilities in Europe                 - Developed by Scientific Beta

                                                                                                          26
Index investing and the ‘Smart Beta’ market
Factor investing has seen significant growth in recent years, with assets using smart beta and factor-based
strategies forecast to reach US$2.7 trillion by 20201, and there is further room for growth.
 Prolonged low interest
         rates                                                                       Global Factor & Smart Beta AUM (USD billion)1
                                                                                                                             3,428
                                   Asia leads global growth

                                                                                                                  2,726

                                                                                                        1,940
                                                                Growth of passive
                                                                   investing
                                                                                             1,347

                                                                                    643

                                       Internationalisation
                                         of Asian markets
    Regulatory impact                                                               2011     2014       2017       2020F      2023F

            1Source:   Blackrock’s Factor Investing: 2018 Landscape.
                                                                                                                                      27
Scientific Beta broadens SGX’s index offering through the fast-growing
‘Smart Beta’ index space

 • Established in 2012 by EDHEC-Risk Institute Asia
 • Award winning ‘Smart Beta’ index firm which develops,
   produces and promotes multi- and single-factor indices
                                                                  High priority growth area for SGX
 • HQ in Singapore; offices in France, UK and US
 • Asset owner-focused client base
                                                                  Well-positioned in a high-growth market

     Scientific Beta Assets Under Replication (US$ bn)            Financially attractive

60
                    More than 9x in
                       5 years                            56
                                                                  Brings unique capabilities to our Index business
50
40
                                                                  Exciting product innovation opportunities
30
                                                                  Strong potential linkages with SGX’s product
20
                                                                    platform
10
 0
       Dec-15   Dec-16   Dec-17       Dec-18   Dec-19   Dec-20

                                                                                                                      28
Strategically elevates SGX’s Index business

                   1 Broad index offering, with (a) strong research-based index
                     construction capabilities, (b) index calculation services, and
                     (c) expansion into smart ESG and green investing

2 Develop wider suite of                                          3 Service wider range of
  products, leveraging SGX’s                                        clients, across geographies
  product capabilities and                                          and client type (asset
  Scientific Beta’s academic rigor                                  owners, asset managers
                                                                    and investment banks)

                                                                                              29
Other Information

                    30
SGX’s investment portfolio in financial technology, data
and platforms augments our multi-asset class exchange
                        Equities                                   Fixed Income                       FX                Commodities                       Freight

 Private Markets – Pre-             Investment network           Fast-growing electronic    Provides an FX post       Physical commodity           Operates as a price
 IPO funding raising help           offering equity and          fixed income trading       trade platform as a       electronic marketplace to    discovery platform for
 create a pipeline for              credit research and          platform in the US,        middle and back office    produce Asia-centric         container, sea and
 public market capital              investor relations           specialised in corporate   utility based on          commodity indices and        airfreight with potential
 raising on SGX                     services, linking            bonds.                     Distributed Ledger        derivatives in partnership   to be a global spot trade
                                    institutional investors                                 Technology (DLT)          with the Zall Group and      execution venue and
                                    with research analysts                                                            GeTS                         index provider (FBX)
                                    and corporates
                                                                                                                                                            Index

 Regulated tokenised                Marketnode JV - APAC         XinTru JV - Trumid XT,     FX electronic trading     JV to develop indices for    Independent index
 fundraising and trading            first exchange-led digital   an electronic bond         solution which serves     onshore China steel          provider specialising in
 venue for digital assets,          asset venture focused        trading platform to        institutional investors   pricing with a leading       smart beta strategies,
 including asset-backed             on capital markets           enhance liquidity and      with single point of      domestic online pricing      with expertise in factor-
 security tokens                    workflows through            execution in the Asian     access to global OTC FX   and intelligence service.    based and risk-managed
                                    smart contracts and DLT      bond market                network. SGX building     Support SGX’s expansion      solutions
                                                                                            Futures distribution.     of iron ore complex

Joint-venture         Acquisition

                                                                                                                                                                               31
Technology investments have enabled higher capacity for growth
▪ Past investments advanced SGX’s technology capabilities and enables higher capacity for growth
▪ FY2020 CAPEX of $41M below guidance of $45M to $50M. Enhanced key technology infrastructure,
  digitalised retail investor services, and upgraded Titan OTC commodities trade reporting system.
▪ FY2021 CAPEX Guidance: $55M to $60M

                                                          Technology – CAPEX and Depreciation
                                                                      (S$ Million)
                                    73
                                                          66                     65
                                          52                                                         55                   55
                                                                 48                     50                51
                                                                                                                     41

                                    FY2016                FY2017                 FY2018              FY2019          FY2020 1
                                                  Technology Capital Expenditure ($M)            Depreciation ($M)
Note: All figures in $ millions unless otherwise stated and may be subject to rounding
1FY2020 Technology Depreciation excludes the impact of adoption of SFRS (I)16 Leases of $7.7M.

                                                                                                                                32
Disciplined in our expenditure
▪ Investments in building capabilities to support multi-asset strategy
▪ FY2020 expense of $487M, up 8% from a year ago, CAGR of 4% from FY2016-FY2020
▪ FY2021 Operating Expense Guidance: $535M to $545M

                  FY2020 Expense Breakdown

                       Discretionary                            ▪ Fixed costs – 65%
                           $38M
                            8%                                  ▪ Variable costs – 27%
                                                  Fixed Staff
            Variable Staff                           costs          ▪ Variable staff cost increase in line with
                Costs                                 28%             profitability
                16%
                     Variable                                       ▪ Processing & Royalties expenses are
                     $131M Expenses                                   volume-related
                       27%           Fixed
         Processing           $487M
                                    $318M                           ▪ Royalties are recovered as revenues under
         & Royalties                  65%
            11%                                                       licence fees
                                                   Technology   ▪   Discretionary costs – 8%
                                                      14%
                       Depreciation
                           and                Premises
                      Amortisation &             2%
                       Others, 21%

Note:   Numbers may be subject to rounding.

                                                                                                                  33
Appendix
-   Sustainability
-   Cross margining example
-   Shareholder profile
-   Dividend history
-   1H FY2021 Performance

                              34
Sustainability at SGX
Ensuring long-term value for our stakeholders and creating a positive, lasting impact on society
Sustainability factors that are important to SGX:

1.   Economic Performance : Our financial performance, economic value creation, distribution, and retention for shareholders
2.   Socioeconomic Impacts : Our external impacts through our role as a market operator and regulator
3.   Governance : Our governance structure, ethics and integrity, anti-corruption and compliance policies
4.   People : Our talent management and responsible employment practices
5.   Environment : Our role in mitigating climate change

                                                                       Our Focus
            Equities                                                                               Fixed Income
            Develop ESG-related risk management and trading solutions;                             Aim to be the preeminent Asian platform for green, social
            publish ESG ratings for SGX-listed companies                                           and sustainability fixed income securities.

             Commodities                                                                            Indices
             Develop more ESG-related derivatives to support the                                    Develop more sustainability benchmarks, ratings and
             production of essential materials such as higher grade iron                            products to facilitate shift towards sustainable investing.
             ore, low sulphur FFA and sustainable rubber                                            These include custom ESG thematic indices such as low
                                                                                                    carbon and climate change risk.
            Regulation                                                                             Corporate
            Partner ESG experts and consultants to provide resources                               Identify and assess ESG risks and opportunities through
            and training to help listed companies produce sustainability                           robust enterprise risk management system. SGX is a
            reports that are in line with globally-recognised frameworks.                          component of FTSE4Good Index, Bloomberg ESG Data
            SGX has also been leading in the advocacy for Women on                                 Index and MSCI World ESG Leaders Index.
            Boards in Singapore since 2012.

      Awarded Asia’s Best Sustainability Report (within Annual Report) in 2020
      Ranked within the top 5 among listed companies in the NUS Governance and Transparency Index* in the last 5 years.

               * https://bschool.nus.edu.sg/cgio/research/singapore-governance-and-transparency-index/
                                                                                                                                                                  35
Cross margining efficiencies
Correlated products, margin netting efficiencies
                                                                                                        Note:
                                                                                                                                Long – Short
                                                                           33%                                + correlation       spread
                                               INR/USD
                                                FX futures
                                                                         Margin
                                                                         offset                               -   correlation
                                                                                                                                Long – Long
                                                                                                                                  spread

                                                                           Nifty 50
                                                                        Index Futures

                                   46%                                                                               31%
    Nikkei 225                   Margin                                                          USD/CNH            Margin
    Index Futures                                                                                FX futures
                                 offset                                                                             offset

                                China A50                                                                         Nikkei 225
                               Index Futures                                                                       Index Futures

Note:   Based on Margin Schedule as of 3 February 2020, full schedule available on SGX website

                                                                                                                                               36
Cross margining example
More exposure with the same amount of margins

                                              US$100k                                          US$100k
                                                 USD/CNH                                         Nikkei 225       Margins
          Exposure                               FX futures                                    Index Futures

        Issuer Services                     ~US$1,400*                                         ~US$4,100*        US$5,500
    Outright Margin

             31%                          US$1,400* x 69%                                      US$4,100* x 69%
                                                                                                                 US$3,800
                                            ≈ US$1,000                                         ≈ US$2,800
      Cross product
      margin offset
                                                                            US$1,700 Margin savings
                                                                            More efficient use of capital
Note: Based on exchange rate as of 3 February 2020
      Based on Margin Schedule as of 3 February 2020, full schedule available on SGX website

                                                                                                                            37
SGX shareholders’ profile
Broad shareholding base with domestic retail shareholders, as well as domestic and
international institutions

                    SGX Shareholder Composition1
                                                                        Institutional Shareholding by Geography
                SEL Holdings                                                                 Others
                    23%                                                                       2%
                                                                            Rest of Europe
                                                                                 16%

                                                                                                              US
                                                                                                             45%
                                                                   United Kingdom
                                                                        13%
                                                   Institutional
                                                       53%

       Retail
                                                                                    Asia
        24%                                                                         13%
                                                                                             Singapore
                                                                                                10%

Note: Numbers may be subject to rounding.
1 As
   at 31 December 2020

                                                                                                                   38
Dividend history
Committed to returning value to our shareholders

                                   Dividend per Share (cents)
                                                                                     30.5

                                                                        30     30

                             28      28        28       28       28

    27      27      27

   FY10    FY11    FY12     FY13    FY14     FY15      FY16     FY17   FY18   FY19   FY20

                                                                                            39
Recent 1H FY2021 Performance
            Fixed Income, Currencies                                                              Data, Connectivity & Indices (DCI)
                                                                                  Equities
              & Commodities (FICC)
                      19%                                                                                             14%

                         Revenue:                                                Revenue:                     Revenue:
                         $99M                                                 $351M                          $71M
                          (up 17%)                                                 (up 3%)                    (up 35%)
                                                                                     67%

   ▪ Solid performance in an uncertain environment – all business segments recorded growth
   ▪ We deepened our partnership with FTSE Russell to refresh and grow our equity derivative suite;
     achieved success in retaining liquidity in our offshore Taiwan futures suite, demonstrating the
     strength of our ecosystem

Note: All figures in $ millions unless otherwise stated and may be subject to rounding

                                                                                   Confidential                                        40
FICC – Fixed Income
                                                  ▪ Number of new bond listings at 358; Amount issued $170B
           FICC                                   ▪ Listing revenue up 4% to $5.1M
    $99M, up 17% y-o-y                            ▪ We will continue to establish partnerships to expedite the
                                                    development and growth of our Fixed Income business

                           No. of New Bond listings                                             Total Bonds Amount Issued ($B)

                 585
                                          447                                             258
                                                                  358                                        194             170

               1H FY20                 2H FY20                  1H FY21                  1H FY20           2H FY20          1H FY21

Note: All figures in $ millions unless otherwise stated and may be subject to rounding

                                                                                                                                      41
FICC – Currencies
                                                  ▪ Currencies futures volume down 8% to 11.8M contracts
          FICC                                    ▪ INR/USD volumes declined 13% due to impact from COVID-19
   $99M, up 17% y-o-y                             ▪ Market share: INR/USD +10%-pts to 65%; USD/CNH comparable

                 USD/ CNH Volume (‘000 contracts)                                           INR/ USD Volume (‘000 contracts)
                                                                                                       -13% y-o-y
                                -2% y-o-y

                                                                                          7,716          7,982           6,694
           4,806                      5,315                     4,719

         1H FY20                    2H FY20                    1H FY21                   1H FY20        2H FY20          1H FY21

Note: All figures in $ millions unless otherwise stated and may be subject to rounding

                                                                                                                                   42
FICC – Commodities
                                                   ▪ Iron ore volumes up 3% y-o-y to 10.2M contracts
            FICC
                                                   ▪ Iron Ore retains > 95% offshore market share; FFA > 60% market share
     $99M, up 17% y-o-y                            ▪ Adding to our suite of ferrous products

         Iron Ore Derivatives Volume                                 Freight Derivatives Volume              Rubber Futures Volume
               (‘000 contracts)                                            (‘000 contracts)                     (‘000 contracts)

                       +3% y-o-y

                                                                                                                   +4% y-o-y
                                                                                +14% y-o-y

       9,928             11,041             10,194
                                                                                                          856         965        891
                                                                   450                   582    515

      1H FY20            2H FY20            1H FY21              1H FY20           2H FY20     1H FY21   1H FY20    2H FY20    1H FY21

Note: All figures in $ millions unless otherwise stated and may be subject to rounding

                                                                                                                                         43
Equities – Equity Derivatives
                                                 ▪ Higher trading volumes in equity derivatives, up 4% y-o-y
         Equities
                                                 ▪ FTSE CN A50 futures volumes up 20%; Nifty 50 futures volumes up 17%
    $351M, up 3% y-o-y                           ▪ Launch of ESG index futures contracts

                                                          Equity Derivatives Volume (M contracts)
                                                                          103
                                                                           7                          93
                                 89                                        2                                  Others1
                                                                           6                           5
                                                                                                       1      MSCI NTR
                                  7                                                                    6      MSCI SG
                                  3                                               12                   6
                                  5                                                                           FTSE TW2
                                                                                                       6      MSCI TW3
                                 11                                               15                   9      Nikkei 225
                                 11                                               13                  12      Nifty 50
                                 11

                                                                                                              FTSE CN A50
                                  41                                              48                  49

                             1H FY20                                           2H FY20              1H FY21
Note: All figures in $ millions unless otherwise stated and may be subject to rounding
                   1
                    Others comprise mainly Nikkei 225 Index Options and Single Stock Futures
                   2Commenced    trading on 20 July 2020                                                                    44
                   3Ceased trading on SGX on 1 November 2020
Equities – Equity Derivatives (FTSE Taiwan update)
                                                     ▪ Volume of Aggregate SGX MSCI/FTSE Taiwan contracts increased 5%
          Equities                                     y-o-y
                                                     ▪ Open interest and volume market share of the SGX FTSE Taiwan
     $351M, up 3% y-o-y
                                                       futures contract remain >80% and >90% respectively
                                                     ▪ Exchange venue plays a significant role in determining liquidity flows

  ▪ We attribute our success in retaining liquidity in the SGX FTSE Taiwan futures contract to:
       −    The trust we have built with our customers;
       −    The value that our multi-asset offering brings to them; and
       −    The significant benefits the SGX ecosystem offers to the investment community

  ▪ Impact to average fee per contract:
       −    Our derivatives average fee per contract was lower by 15% q-o-q to $1.16, mainly due to the offering of an
            introductory fee for the new SGX FTSE Asia expansion suite
       −    We expect our average fee per contract to improve as our FTSE Taiwan and new contracts run-in over the next
            two quarters

Note: All figures in $ millions unless otherwise stated and may be subject to rounding

                                                                                                                                45
Equities – Cash Equities Listings

           Equities                                    ▪ Listing revenue at $17M, down 5%
                                                       ▪ Total funds raised $7.2B
      $351M, up 3% y-o-y
                                                       ▪ Listing of companies from a wide range of sectors

                          No. of New Equity Listings                                            Total Equity Funds Raised ($B)

                                                                                                         -17% y-o-y

                                                                                                            10.1
                                                                                          8.7
                                        6                                                                                        7.2
                                                                5
               3

           1H FY20                  2H FY20                 1H FY21                      1H FY20          2H FY20           1H FY21
Note: All figures in $ millions unless otherwise stated and may be subject to rounding

                                                                                                                                       46
Equities – Cash Equities Trading & Clearing
                                                       ▪ Total traded value increased by 19% to $161.8B
            Equities                                   ▪ Average Clearing Fee for Securities increased from 2.63 bps to
       $351M, up 3% y-o-y                                2.71 bps, y-o-y
                                                       ▪ Wider spread of participation by different market segments

                       Securities Total Value Traded ($B)                                                  Average Clearing Fee by Products (bps)
Total Traded                                                                              Average
   Value              136.0                  196.2                   161.8                 Yield              2.63                    2.73               2.71

                      5.0                      7.6                     5.5                                                            1.17
                                                                                                              0.69                                       0.99

                     131.0                   188.6                   156.3
                                                                                                              2.70                    2.79               2.77

                    1H FY20                 2H FY20                  1H FY21                                1H FY20                  2H FY20            1H FY21
                                Equities1      Other Products 2                                                         Equities 1        Other Products 2

Note: All figures in $ millions unless otherwise stated and may be subject to rounding
1 Equities include ordinary shares, real-estate investment trusts and business trusts
2 Other products include structured warrants, exchange-traded funds, daily leverage certificates, debt securities, and American depository receipts

                                                                                                                                                                  47
Data, Connectivity & Indices
      Data, Connectivity &                          ▪ Market data and Indices revenue up 85% to $40M
             Indices                                ▪ Connectivity revenue comparable at $31M
      $71M, up 35% y-o-y                            ▪ Scientific Beta to launch Smart Green offering in 3Q FY21

            Market Data and Indices Revenue ($M)                                                   Connectivity Revenue ($M)

                                                                                                          +1% y-o-y

                                +85% y-o-y

                                                                                          30.9               31.3               31.2
                                     37.9                      39.6

           21.4

         1H FY20                   2H FY20                   1H FY21                     1H FY20            2H FY20            1H FY21
Note: All figures in $ millions unless otherwise stated and may be subject to rounding

                                                                                                                                         48
Looking ahead …
            We expect global economies to recover as COVID-19 vaccines become more
            widely available.

            Investments into cash equities is anticipated to grow, while portfolio risk
            management activities may rise due to shifts in US policies under its new
            administration.

            We expect the medium-term revenue contribution of our recently acquired
            subsidiaries Scientific Beta and BidFX to grow beyond their current 6%, as they tap
            on an enlarged network of resources within the SGX group to execute their growth
            plans.

            We launched SGX FIRST (Future In Reshaping Sustainability Together) to
            expand our sustainability capabilities and drive sustainable practices in our
            financial ecosystem.

            Our total expenses and capital expenditure for FY2021 remain between $535-
            $545 million and between $55-$60 million respectively.

                                                                                                  49
Thank You
 SGX Investor Relations Contact:

 Dominic Lim, Head of Investor Relations                                                                  Joyce Koh, Associate Director, Investor Relations
 Tel: (65) 6236 5395, Email: dominic.lim@sgx.com                                                          Tel: (65) 6236 8356, Email: joyce.koh@sgx.com

Singapore Exchange
Beijing  Hong Kong  London  Mumbai  New York  San Francisco  Shanghai  Tokyo  Chicago

sgx.com

Forward Looking Statements
This presentation may contain forward-looking statements that involve assumptions, risks and uncertainties. Statements in this presentation that are not historical facts are statements of future expectations with respect to the financial
conditions, results of operations and businesses, and related plans and objectives. These forward-looking statements are based on SGX’s current intentions, plans, expectations, assumptions and views about future events and are subject
to risks, uncertainties and other factors, many of which are outside SGX’s control. Because actual results, performance or events could differ materially from SGX’s current intentions, plans, expectations, views and assumptions about the
future, such forward-looking statements are not, and should not be construed as a representation as to future performance of SGX. It should be noted that the actual performance of SGX may vary significantly from such statements.

This presentation is being made available to certain authorised recipients for their general information only.
While SGX and its affiliates have taken reasonable care to ensure the accuracy and completeness of the information provided in this presentation, they will not be liable for any loss or damage of any kind (whether direct, indirect or
consequential losses or other economic loss of any kind) suffered due to any omission, error, inaccuracy, incompleteness, or otherwise, any reliance on such information. Neither SGX nor any of its affiliates shall be liable for the content of
information provided by or quoted from third parties. Examples provided are for illustrative purposes only. The information in this presentation is subject to change without notice.
Any recirculation, transmission or distribution of this presentation or any part thereof by any third party requires the prior written permission of SGX. SGX and its affiliates disclaim all responsibility and liability arising in connection with any
unauthorised recirculation, transmission or distribution of this presentation or any part thereof.
© Singapore Exchange Limited
You can also read