Midsona Presentation, Q3 2021 - Company presentation CEO Peter Åsberg and CFO Max Bokander
←
→
Page content transcription
If your browser does not render page correctly, please read the page content below
Midsona Presentation, Q3 2021
Company presentation
CEO Peter Åsberg and CFO Max Bokander
Key developments Q3

    Summary
● Increased net sales and improved margins
                                                                                      Nordic
● Negative organic growth but own brands                                              - Growth in pharmacy and
                                                                                        food service
  do comparatively better
                                                                                      - Supply issues effecting System
                                                                                        Frugt Christmas in-selling
● Key issue: disruptions in the supply chain
                                                                   Division Nordic
  – Bad crops effect raw materials availability
  – Delays in deliveries of pack materials                                           North
                                                                                     - Growth in grocery trade and food
  – Transport delays                                                                   service
                                                  Division North                     - Weak sales in health food stores
● Sales increases in pharmacy trade and
  food service could not
  compensate for severe drop
  in health food stores.                                                             South
                                                                                     - Significant growth in grocery trade
● First signs of price inflation                                                     - Weak sales in health food stores
                                                   Division South

2
Q3 highlights

    Net sales amounted to:        893 MSEK (821)

    EBITDA before one off items   80 MSEK (72)
    amounted to:
    Corresponding EBITDA-margin   9,0% (8,8%)
    amounted to:

    Net result amounted to        31 MSEK (34)

    Free Cashflow amounted to:    -8 MSEK (64)

3
Organic growth by channel

                             Q3 - 2021                    % of NS   Highlights Q3
                                                                    ● Branded business grows in grocery trade,
         Grocery trade *                          -2,4%    68%        but private label is down
                                                                    ● Major market decline in health food stores
    Health food stores                   -20,4%             13%
                                                                    ● Pharmacies and food service benefit from
                                                                      societies reopening
           Pharmacies                             7,5%      10%

          Food service                             5,5%      9%

    * Includes other sales channels

4
Narcissa
    A new skin care routine for a younger target group

     • Detox and Glow is a complete vegan face
       care routine for the conscious and younger
       target group

     • Recyclable plastic in all packaging

     • All packaging raw materials are produced in
       EU – no long shipment

     • Great results and functionality in a beautiful,
       playful packaging – what the consumer             Detox & Glow    Detox & Glow     Detox & Glow Detox & Glow Detox & Glow

       wants
                                                         Cleansing Gel   Micellar Water   Essence     Day Cream     Night Mask

5
Kung Markatta
New design and product innovation for Sweden’s greenest brands
Roll-out in the grocery trade in Europe continued
    Continued investment and roll-out for Davert and Happy Bio in the grocery trade

7
Recent directed new share issue to drive M&A-agenda

    ● Raised approximately SEK 500 million

    ● Largest shareholder, Stena Adactum, and other large shareholders participated

    ● New Swedish and international institutional investors

    ● Fund M&A agenda
      – Recent Vitality acquisition
      – Future M&A-activities

8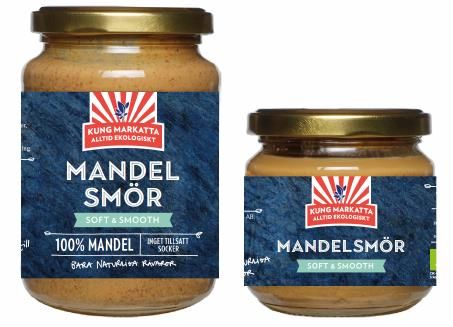
Vitality
    Taking Midsona Finland to the next level

    ● With the acquisition of Vitality and OY Midsona takes an important step to gain
      desired size and win scale in Finland.
    ● Further it will provide Midsona Finland with stronger position and muscles within
      Pharmacy channel specifically.
    ● The acquisition of Vitality and OY builds size and strengthens the total Consumer
      Health business in Nordics.
    ● Provides greater capabilities for innovation within Vitamins & Minerals across
      Nordic.
    ● By taking the best from two worlds we believe that we together will become one
      stronger and better company.
    ● We believe that there are growth potential for us to build an even stronger
      Consumer Health business in both Finland and Nordics in the future.

9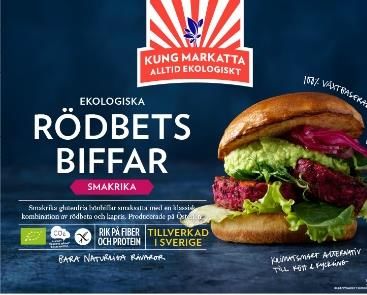
Financial review
CFO Max Bokander
Financial executive summary
Structural growth with improved margins

MSEK                         Q3 2021            Q3 2020   YTD 2021 YTD 2020   Highlights – Q3
Net Sales                           893             821     2 761     2 626
                                                                              ● Net Sales growth of 8,8%,
GP%*                                27,5           27,2       28,1     28,1
                                                                                o but with 3,9% organic decline
EBITDA*                               80             72       252      276
EBITDA%*                             9,0            8,8        9,1     10,5
                                                                              ● Improved Gross Margin mainly from favorable mix

D&A*                                 -38            -35       -115     -106   ● Improved EBITDA vs. LY; driven by structural growth,
IAC                                     6            10         7       21
                                                                                improved margins and synergies
Net financing costs                  -12             -7        -35      -38   ● Free Cashflow impacted by seasonal build of inventory
Net tax costs                          -5            -6        -21      -32     and timing of payments
Net result                            31             34        88      121
Earnings per share                  0,45           0,52       1,33     1,85

Free Cashflow                         -8             64       -69      150

 * Before Items Affecting Comparability (IAC)

11
Net sales development vs LY
Structural growth
Highlights Q3
Q3
MSEK
● Structural growth
+13,3%
o System Frugt added
-3,9% -0,6%
● Organic decline
+8,8% o limited availability of certain raw materials
o Consumers prioritizing restaurant visits at the expense of
lower household consumption
Structural effects
System Frugt included from Q4-20
1270%
Net Sales development Q1 2020 to Q3 2021 * Q3-2021
Own Brands Other
Net Sales of products from own brands continue to develop better
15%
13%
12%
10%
10%
5%
5%
3% 3%
0% 0%
0%
-1%
Q1 2020 Q2 2020 Q3 2020 Q4 2020 Q1 2021 Q2 2021 Q3 2021
-2%
-2%
-5% -4% -4%
-6%
-10%
Organic Growth Organic growth - own brands
13GP and EBITDA development - Q3
MSEK GP/GP%
Highlights
GP% improved with 1,4 p.p. vs LY Proforma
27,2%
27,5%
o driven by favorable mix, selective price increases and a
26,1% favorable transactional exchange rate effects
MSEK EBITDA / EBITDA%
EBITDA vs LY Proforma
o Improved EBITDA margin and despite 62M lower sales than
8,8% 9,0%
Proforma LY, the EBITDA almost came in on same level as
8,5%
Proforma LY
Note! numbers presented on this slide are excluding IAC
14Nordics
EBITDA increased with 11% vs Q3 LY
MSEK Q3 2021 Q3 2020 YTD 2021 YTD 2020
Net Sales 620 537 1 885 1 667 Highlights – Q3
GM%* 31,1 31,9 31,7 31,5 ● Net Sales growth of 15,5%
o Currency; -0,3% Structural; +20,3%
EBITDA* 69 62 198 198
o Organic growth -4,5%
EBITDA%* 11,1 11,6 10,5 11,9 o Approx. 2 p.p. negative effect from exited low margin contract for a
licensed brand
Q3 - 2021 % of NS o Global supply chain constraints impacting deliveries mainly to Grocery
Trade and Food service where demand was higher than actual
Grocery trade** deliveries
-6,2% 76%
Health food stores
● EBITDA vs LY
-17,6% 6%
o Improved with 7M, driven by System Frugt addition, and
realized synergies, substantially offsetting 4M negative
Pharmacies 7,5%
15% variance from difference in x-rate revaluation
Food service -0,6% 3%
* Before IAC
** Includes other sales channels
15North Europe
Good growth for sales of own brand products
MSEK Q3 2021 Q3 2020 YTD 2021 YTD 2020
Highlights – Q3
Net Sales 195 197 623 668
GM%* 18,5 15,8 18,8 19,0 ● Net Sales decline of 0,8%
o Currency translation -1,2%
EBITDA* 13 8 50 58
o Organic growth of 0,4%
EBITDA%* 6,5 4,2 8,0 8,7 o And despite constraints in global supply chain, sales of product from
own brands demonstrated a strong growth of 4,7%
Q3 - 2021 % of NS
Grocery trade** 3,8% 50%
● EBITDA vs LY
o Driven by improved gross margin,
Health food stores -27,4% 21% o However, it can be noted that Q3 during LY included extra
temporary production costs
Pharmacies NA
Food service 6,8% 29%
* Before IAC
** Includes other sales channels
16South Europe
Continued strong growth with Happy Bio
MSEK Q3 2021 Q3 2020 YTD 2021 YTD 2020
Net Sales 86 93 283 310
Highlights – Q3
GM%* 18,7 21,3 22,2 23,7 ● Net Sales decline of 6,7%
o Currency translation -1,0%
EBITDA* 3 8 22 39
o Organic decline of 5,7%
EBITDA%* 3,5 8,7 7,8 12,5 o The brand Happy Bio however continued to grow strong, this quarter
with 38%
Q3 - 2021 % of NS
Grocery trade** 2,0% 50%
● EBITDA vs LY
o Decreased due to lower volumes and the same time higher
Health food stores -14,4% 48% structural costs
Pharmacies NA
Food service 56,3% 2%
* Before IAC
** Includes other sales channels, Grocery trade excluding other representing 33% of sales grew 15,8%
17Free Cash Flow
Free cashflow impacted by seasonal stock build within System Frugt
MSEK Q3 vs LY
120 300 ● Worse WC effect vs LY,
o driven by System Frugt seasonal building inventory (44M) for high
100
season during Q4
250
o Timing of customer payments
80
60 200
YTD vs LY
40
150 o Lower EBITDA and negatively impacted by
20 o Q1 discontinued factoring (67M)
o Q2-Q3 System Frugt building inventory (52M)
0 100
Q3 Q4 Q1 Q2 Q3 Q4 Q1 Q2 Q3
-20 FY Outlook
2019 2019 2020 2020 2020 2020 2021 2021 2021
50
o In Q4 Midsona will have a negative effect from new UTP regulations with
-40
e.g., Sweden implementing payment terms limited to 30 days for
-60 0 companies in food sector
QTD R12
18Summary and outlook
• Increased net sales and improved margins
• Continued roll-out in the grocery trade in Europe
• Supply chain challenges
• Preparation for price increases
• M&A focus
• Uncertain q4 but supply situation should gradually improve
19Q&A 20
You can also read


