Grow your green - Money Advice at Work
←
→
Page content transcription
If your browser does not render page correctly, please read the page content below

5 easy steps to
grow your
green
Presented by:
Timothy M. Shirk CFP®
timothy.shirk@francisinvco.com
Money Advisors
Independent Investment Advisor
Fiduciary Education and Advice Services
No Sales, No Hidden Fees
Service Provided as a Cardinal At Work
Retirement Savings Benefit
We Want To Hear From You!
1
1. Lay the Groundwork
2. Trim Taxes
3. Plant Well
4. Cultivate Growth
5. Prepare for Drought

lay the
groundwork               1

                             2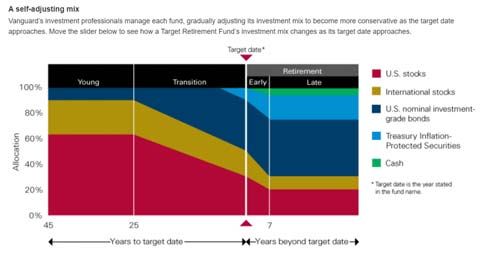
Lay the Groundwork
Capture all the “free” money*
Start saving right away in either the Tax
Deferred Account (TDA) or the Roth 403(b)
*See the plan’s Summary Plan Description for details on qualifying for company contributions.
Lay the Groundwork
Capture all the “free” money*
Start saving right away in either the Tax
Deferred Account (TDA) or the Roth 403(b)
At one year of service, elect a 4% contribution
to the Contributory Retirement Account (CRA)
Save 1%, get a 1.5% match
Save 2%, get a 3% match
Save 3%, get a 4% match
Save 4%, get a 5% match
*See the plan’s Summary Plan Description for details on qualifying for company contributions.
3
Lay the Groundwork
Capture all the “free” money*
Start saving right away in either the Tax
Deferred Account (TDA) or the Roth 403(b)
At one year of service, elect a 4% contribution
to the Contributory Retirement Account (CRA)
After 1 year receive the basic company
contribution
1 year of service, receive 1% of pay
2 years of service, receive 2% of pay
3 years of service, receive 3% of pay
4 years of service, receive 4% of pay
5 years of service, receive 5% of pay
*See the plan’s Summary Plan Description for details on qualifying for company contributions.
Source: Vanguard – How America Saves, 2020
Source: Vanguard – How America Saves, 2020
4
Secret Sauce:
Set Up
Auto-
Escalation
Lay the Groundwork
Capture all the “free” money
Time is your greatest fertilizer
Twin
Tale
5
Lay the Groundwork
Capture all the “free” money
Time is your greatest fertilizer
Understand what you’re planting
There’s No Cash in There
Your stock portfolio is…
A collection of assets purchased today with
the expectation of selling them in the future
for a profit.
Past performance is not a guarantee of future results. It is possible to lose money with any investment.
6Disney Share Price
250
200
150
100
07/24/03
50
$20.57
0
Column2 of future
Source: Bloomberg. Past performance is not a guarantee Column3 Column4
results. It is possible to lose money with any investment.
Disney Share Price
250
200
150
100
05/30/07
07/24/03
$35.43
50
$20.57
0
Column2 of future
Source: Bloomberg. Past performance is not a guarantee Column3 Column4
results. It is possible to lose money with any investment.
Disney Share Price
250
200
150
100
05/30/07
07/24/03
$35.43
50
$20.57
0
$15.59
03/09/09
Column2 of future
Source: Bloomberg. Past performance is not a guarantee Column3 Column4
results. It is possible to lose money with any investment.
7Disney Share Price
250
200
08/04/15
150
$121.69
100 Purchased Star Wars
05/30/07
07/24/03
$35.43
50
$20.57
0
$15.59
03/09/09
Column2 of future
Source: Bloomberg. Past performance is not a guarantee Column3 Column4
results. It is possible to lose money with any investment.
Disney Share Price
250
12/20/19
200
08/04/15
$146.88
150
$121.69
100 Purchased Star Wars
05/30/07
07/24/06
$35.43
50
$21.62
0
$15.59
03/09/09
Column2 of future
Source: Bloomberg. Past performance is not a guarantee Column3 Column4
results. It is possible to lose money with any investment.
Disney Share Price
250
12/20/19
200
08/04/15
$146.88
150 $121.69
100 Purchased Star Wars
05/30/07
07/24/03
$35.43
50
$20.57 The Force Awakens
The Last Jedi
The Rise of Skywalker
0
$15.59
03/09/09
Column2 of future
Source: Bloomberg. Past performance is not a guarantee Column3 Column4
results. It is possible to lose money with any investment.
8Disney Share Price
250
12/20/19
200
08/04/15
$146.88
150
$121.69
100
05/30/07
07/24/03
$93.88
50 $35.43
$20.57 04/03/20
0
$15.59
03/09/09
Column2 of future
Source: Bloomberg. Past performance is not a guarantee Column3 Column4
results. It is possible to lose money with any investment.
Disney Share Price 05/21/21
250
$172.20
12/20/19
200
08/04/15
$146.88
150
$121.69
100
05/30/07
07/24/06
$93.88
$35.43
50
$21.62 04/03/20
0
$15.59
03/09/09
Column2 of future
Source: Bloomberg. Past performance is not a guarantee Column3 Column4
results. It is possible to lose money with any investment.
Mutual Funds
Your money is
combined with
other investors
Mutual fund
managers pick
the stocks and
bonds
9Source: Morningstar, includes both passive and active funds
Retirement plan investors
aren’t just buying US stock funds
Hard
Int’l Stable Value
Asset
-Emerging Mkts
Bond
Int’l
Small-Cap
Foreign Bond
Value and Large-Cap Large-Cap
Growth
Value Growth
Example asset allocation – Does not constitute a specific recommendation.
You are
SUPER
diversified in
your retirement
plan!
10trim
taxes 2
Source: Morningstar, includes both passive and active funds
Three Tax Breaks To
Choose From
Pre-Tax Tax Deferred Distributions
Tax Deferred
Contribution Taxed as
(TDA, CRA) Growth
Income
Francis Investment Counsel does not provide tax advice. Seek advice from your tax advisor.
11Three Tax Breaks To
Choose From
Pre-Tax Tax Deferred Distributions
Tax Deferred
Contribution Taxed as
(TDA, CRA) Growth
Income
After Tax After Tax Tax Free Gains Taxed
(CRA) Contribution Growth as Income
Francis Investment Counsel does not provide tax advice. Seek advice from your tax advisor.
Three Tax Breaks To
Choose From
Pre-Tax Tax Deferred Distributions
Tax Deferred
Contribution Taxed as
(TDA, CRA) Growth
Income
After Tax After Tax Tax Free Gains Taxed
(CRA) Contribution Growth as Income
After Tax Tax Free Tax Free
Roth 403(b) Contribution Growth Distributions
Francis Investment Counsel does not provide tax advice. Seek advice from your tax advisor.
Pretax Might Be Better . . .
If you don’t have a lot of time for tax-free
compounding
If you are in high tax bracket now
If you need to stay under income limits
Francis Investment Counsel does not provide tax advice. Seek advice from your tax advisor.
12Roth Might Be Better . . .
If you DO have a lot of time for tax-free
compounding
If you are in lower tax bracket now
Francis Investment Counsel does not provide tax advice. Seek advice from your tax advisor.
After-Tax Might Be Better . . .
If you wish to save more than the annual limit
402(g) limit
Savers under 50 years old limited to $19,500 per
year (2021)
Savers 50 and older may make a “catchup”
contribution of $6,500.
415(c) limit
Contributions from all sources limited to $58,000
(2021)
50+ “catch up” contribution not included in 415(c)
Francis Investment Counsel does not provide tax advice. Seek advice from your tax advisor.
Pre-Tax
(TDA, CRA)
Consider Tax Deferred
Contribution
Tax Deferred
Growth
Distributions
Taxed as
Income
Converting After-
After Tax After Tax Tax Free Gains Taxed
(CRA) Tax to Roth Contribution Growth as Income
After Tax Tax Free Tax Free
Roth 403(b) Contribution Growth Distributions
Remember to capture your match!
Source: The Plan’s Summary Plan Description.
Francis Investment Counsel does not provide tax advice. Speak with a qualified tax advisor.
13.
Francis Investment Counsel does not provide tax advice. Speak with a qualified tax advisor.
Maybe Both Tax Treatments
Make Sense
Having both allows you to control your taxable
income in retirement
Unlike the pre-tax retirement accounts, there
are no Required Minimum Distributions if you
roll Roth dollars into a Roth IRA
Money goes to family income-tax free upon
death
Francis Investment Counsel does not provide tax advice. Seek advice from your tax advisor.
Keep in mind . . .
Unlike the pre-tax accounts,
growth on your Roth account is
taxed and penalized until after
59.5 years old, AND 5 years from
first contribution.
Francis Investment Counsel does not provide tax advice. Seek advice from your tax advisor.
143 plant well
Two Ways to Diversify
Two Ways to Diversify
“Do it for me!”
Target Retirement
Date Funds
15Vanguard
Target Retirement Date Funds
https://retirementplans.vanguard.com/VGApp/pe/pubeducation/investing/LTgoals/TargetRetirementFunds.jsf
For illustration purposes only. Information provided in this analysis/presentation is from source believed to be reliable,
but we cannot guarantee its accuracy or completeness.
Two Ways to Diversify
“Do it for me!” “I’ve got this!”
Target Retirement Custom Menu
Date Funds with Varying
Asset Classes
Custom Menu
“I’ve got this!”
Custom Menu
with Varying
Asset Classes
164 cultivate
growth
Cultivate Growth
Resist temptation to chase or flee
How’d The Market Do Today?
17Points vs Percentages
10/19/87 10/15/08
Down 22.6% Down 7.9% in
in one day! one day!
-508 pts -733 pts
For illustration purposes only. Past performance is no guarantee of future results. Information provided in this
analysis/presentation is from source believed to be reliable, but we cannot guarantee its accuracy or completeness.
The DOW 30
Amgen Salesforce
Honeywell
McDonalds Walgreens
18Which Market are You In?
Resist the Urge to Flee
S&P 500 Index Annualized Returns for 20-year period ending 12/31/19
Missed 30 Best Days
Missed 10 Best Days
Missed 5 Best Days
Invested Every Day
6.1%
-4% -2% 0% 2% 4% 6% 8%
For illustration purposes only. Past performance is no guarantee of future results. Information provided in this
analysis/presentation is from source believed to be reliable, but we cannot guarantee its accuracy or completeness.
Source: Morningstar.
Resist the Urge to Flee
S&P 500 Index Annualized Returns for 20-year period ending 12/31/19
Missed 30 Best Days
Missed 10 Best Days
Missed 5 Best Days
3.9%
Invested Every Day
6.1%
-4% -2% 0% 2% 4% 6% 8%
For illustration purposes only. Past performance is no guarantee of future results. Information provided in this
analysis/presentation is from source believed to be reliable, but we cannot guarantee its accuracy or completeness.
Source: Morningstar.
19Resist the Urge to Flee
S&P 500 Index Annualized Returns for 20-year period ending 12/31/19
Missed 30 Best Days
Missed 10 Best Days
2.4%
Missed 5 Best Days
3.9%
Invested Every Day
6.1%
-4% -2% 0% 2% 4% 6% 8%
For illustration purposes only. Past performance is no guarantee of future results. Information provided in this
analysis/presentation is from source believed to be reliable, but we cannot guarantee its accuracy or completeness.
Source: Morningstar.
Resist the Urge to Flee
S&P 500 Index Annualized Returns for 20-year period ending 12/31/19
Missed 30 Best Days
‐2.0%
Missed 10 Best Days
2.4%
Missed 5 Best Days
3.9%
Invested Every Day
6.1%
-4% -2% 0% 2% 4% 6% 8%
For illustration purposes only. Past performance is no guarantee of future results. Information provided in this
analysis/presentation is from source believed to be reliable, but we cannot guarantee its accuracy or completeness.
Source: Morningstar.
Resist Return Chasing
Annual returns for 15-year period ending 4/30/21
Linda picked the best
performing asset
class each year
Lucky Linda
23.2%
0% 5% 10% 15% 20% 25%
For illustration purposes only. Past performance is no guarantee of future results. Information provided in this
analysis/presentation is from source believed to be reliable, but we cannot guarantee its accuracy or completeness.
Source: Francis Investment Counsel and StyleAdvisor
20Resist Return Chasing
Annual returns for 15-year period ending 4/30/21
Marcus picked the
fund that performed
Mojo Marcus
3.1%
best last year
Lucky Linda
23.2%
0% 5% 10% 15% 20% 25%
For illustration purposes only. Past performance is no guarantee of future results. Information provided in this
analysis/presentation is from source believed to be reliable, but we cannot guarantee its accuracy or completeness.
Source: Francis Investment Counsel and StyleAdvisor
Resist Return Chasing
Annual returns for 15-year period ending 4/30/21
Contrary Carla
Carla picked the fund
7.7%
that performed the
Mojo Marcus
3.1%
worst last year
Lucky Linda
23.2%
0% 5% 10% 15% 20% 25%
For illustration purposes only. Past performance is no guarantee of future results. Information provided in this
analysis/presentation is from source believed to be reliable, but we cannot guarantee its accuracy or completeness.
Source: Francis Investment Counsel and StyleAdvisor
Resist Return Chasing
Annual returns for 15-year period ending 4/30/21
Equal Eddie
7.5%
Contrary Carla
7.7%
Eddie allocated equally
among all funds
Mojo Marcus
3.1%
Lucky Linda
23.2%
0% 5% 10% 15% 20% 25%
For illustration purposes only. Past performance is no guarantee of future results. Information provided in this
analysis/presentation is from source believed to be reliable, but we cannot guarantee its accuracy or completeness.
Source: Francis Investment Counsel and StyleAdvisor
21Cultivate Growth
Resist temptation to chase or flee
Don’t tap early
Loans Slow Your Growth
Double tax world
Interest you pay may be less than
typical investment returns
Many stop saving while paying back
Yikes… payment is due if you leave the
company!
See the Plan’s Summary Plan Description for complete details.
225 prepare for
drought
Prepare for Drought
Recognize when the harvest is
coming
Will the market be higher
when you harvest?
Zephyr StyleADVISOR Zephyr StyleADVISOR: Francis Investment Counsel
Manager Performance
December 1992 - November 2017 (Single Computation)
700
600 70/30 Diversified Portfolio
25 Year Growth
500
400
70% MSCI ACWI / 30% BbgBarc Global Agg
300
200
100
Nov 1992Dec 1994 Dec 1999 Dec 2004 Dec 2009 Dec 2014 Nov 2017
For illustration purposes only. Past performance is no guarantee of future results. Information provided in this
analysis/presentation is from source believed to be reliable, but we cannot guarantee its accuracy or completeness.
23Risk increases closer to
harvest
Zephyr StyleADVISOR Zephyr StyleADVISOR: Francis Investment Counsel
Manager Performance
December 1992 - November 2017 (Single Computation)
700
600
500
400
70% MSCI ACWI / 30% BbgBarc Global Agg
300
Retiring at
200
end of 2003
100
Nov 1992Dec 1994 Dec 1999 Dec 2004 Dec 2009 Dec 2014 Nov 2017
For illustration purposes only. Past performance is no guarantee of future results. Information provided in this
analysis/presentation is from source believed to be reliable, but we cannot guarantee its accuracy or completeness.
Risk increases closer to
harvest
Zephyr StyleADVISOR Zephyr StyleADVISOR: Francis Investment Counsel
Manager Performance
December 1992 - November 2017 (Single Computation)
700
600
500
400
70% MSCI ACWI / 30% BbgBarc Global Agg
300
Retiring in
200
early 2009
100
Nov 1992Dec 1994 Dec 1999 Dec 2004 Dec 2009 Dec 2014 Nov 2017
For illustration purposes only. Past performance is no guarantee of future results. Information provided in this
analysis/presentation is from source believed to be reliable, but we cannot guarantee its accuracy or completeness.
Will the market be higher
when you harvest?
Zephyr StyleADVISOR Zephyr StyleADVISOR: Francis Investment Counsel
Manager Performance
December 1992 - November 2017 (Single Computation)
700
600 70/30 Diversified Portfolio
25 Year Growth
500
400
70% MSCI ACWI / 30% BbgBarc Global Agg
300
200
100
Nov 1992Dec 1994 Dec 1999 Dec 2004 Dec 2009 Dec 2014 Nov 2017
For illustration purposes only. Past performance is no guarantee of future results. Information provided in this
analysis/presentation is from source believed to be reliable, but we cannot guarantee its accuracy or completeness.
24Asset Allocation
Stocks Bonds and MM
80% 20%
75% 25%
70% 30%
65% 35% Downshift
as you near
60% 40% retirement
55% 45%
50% 50%
45% 55%
40% 60%
35% 65%
30% 70%
For illustration purposes only.
Prepare for Drought
Recognize when the harvest is
coming
Check your gut (what’s your
risk tolerance?)
To Dos:
1. Capture your match
2. Boost your contributions 1%
3. Consider saving (or converting to) Roth
4. Make sure you are diversified
5. Lower stock exposure as retirement
nears
25You can also read