MEASURING THE INTANGIBLE ECONOMY TO ADDRESS POLICY CHALLENGES
←
→
Page content transcription
If your browser does not render page correctly, please read the page content below
MEASURING THE INTANGIBLE
WORKING PAPER | ISSUE 03/2022 | 11 APRIL 2022

                                                ECONOMY TO ADDRESS POLICY
                                                CHALLENGES
                                                MARIE LE MOUEL

                                                European economies exhibit the so-called ‘productivity puzzle’, whereby investments
                                                in digital technologies and intangible assets have not delivered the hoped-for
                                                productivity gains. Explanations for this puzzle lie in the unequal ability of companies
                                                to make use of these technologies, and resulting patterns of market concentration,
                                                productivity divergence and dampened business dynamism. Access to firm-level data
                                                is essential to properly understand these rich dynamics. The purpose of the first work
                                                package of the MICROPROD project was to improve the firm-level data infrastructure,
                                                expand the measurement of intangible assets and enable cross-country analyses of
                                                these productivity trends. The MICROPROD researchers developed the Micro Data
                                                Infrastructure (MDI), a centralised platform that harmonises access to the firm-level
                                                data gathered by national statistical institutes. The data infrastructure developed
                                                through this work package offers valuable insights into the evolution of productivity
                                                across the European Union and into the effects of digitalisation and globalisation. It
                                                can thus generate important evidence for designing policies to support the European
                                                Commission’s policy objectives, especially for achieving the digital and green transitions.
                                                In addition, the research enabled by this data infrastructure and carried out within the
                                                context of MICROPROD can provide valuable lessons about the response of European
                                                economies to the COVID-19 pandemic and its aftermath.

                                                This Working Paper is an output from the MICROPROD project, which received funding
                                                from the European Union’s Horizon 2020 research and innovation programme under
                                                grant agreement no. 822390.

                                                Marie Le Mouel (marie.lemouel@bruegel.org) is an Affiliate Fellow at Bruegel

                                                Recommended citation:
                                                Le Mouel, M. (2022) ‘Measuring the intangible economy to address policy challenges’, Working
                                                Paper 03/2022, Bruegel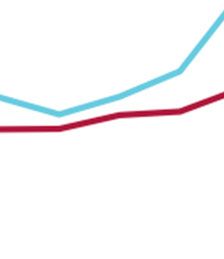
The disaappointing peerformance of productiv ity in advanced econom
mies for the laast two decaades has
troubledd economistts and policcymakers. LLong-term evvidence sugggests that the deceleration of
productiivity growth started aroound the y ear 2000. This
T timing makes it ddifficult to reconcile
productiivity-growth deceleration
n with the exttensive deployment of digital technoologies and in
ntangible
assets. B
Between 200
00 and 2016
6, Total Factoor Productivitty (TFP) grew
w on averagee by 5 percen
nt across
Europeaan economiess, while the share
s of intanngible investtment in aggregate value -added grew
w by more
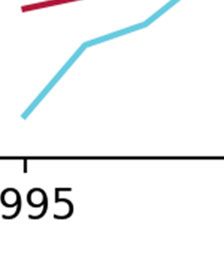
than 255 percent ovver the samee period (Figgure 1). Thiss is particularly puzzlinng in the facce of the
overwheelming amouunt of eviden
nce at counttry, industryy and firm levels, of the positive imppact that
o productiviity1.
investment in these assets has on
Figure 11: Evolution of
o intangiblee intensity annd of TFP acrross Europea
an countriess, 1995-2017
Source: IN
NTAN-invest andd Long term prooductivity databbase. Note: Intaangible intensitty is defined ass investment in n intangible
assets divvided by value-added. Countriees included in tthe aggregate: AT,
A BE, DK, FI, FR, DE, EL, IE, IT, NL, PT, ES, SE, UK.
Research shows thaat a potentiaal explanatioon of this puuzzle is that behind thesse aggregate trends,
complexx dynamics are
a at play within
w and beetween firmss. The process of creativve destructioon, which
drives productivity growth
g by en
nabling firmss to bring new
w ideas to market,
m seem
ms to have weeakened.
Overall, markets havve become leess contesta ble. This cann be seen in a number off trends, documented
for the AAmerican annd, to a lessser extent, EEuropean ecconomies. Th
he rate of fi rm creation and the
contribuution of younng firms to ecconomic activvity have declined (Deckker et al, 20117; Garcia-Maacia et al,
1
See Le Mouel and Schiersch (2022) for an overview.
2
2019). Top performing firms have been able to seize increased market shares. The American economy
in particular has seen an increase in the average levels of markups and profits (De Loecker et al,
2020), and a decrease in the labour share of income (Autor et al, 2020). These researchers find that
both trends arise from a reallocation across firms, rather than a general trend that affects all firms
equally: firms earning higher profits and hiring a lower share of labour have increased their market
shares. Finally, in Organisation for Economic Co-operation and Development countries, the top 5
percent most productive firms in each industry have been able to sustain sizeable productivity growth
rates, while the average performance has been very moderate (Andrews et al, 2015; Criscuolo et al,
2019).

Access to firm-level data is thus essential to properly understand these rich business dynamics. The
purpose of the first work package of the MICROPROD project was to improve the firm-level data
infrastructure and enable cross-country analyses of these productivity trends. The MICROPROD
researchers developed the Micro Data Infrastructure (MDI), a centralised platform that harmonises
access to the firm-level data gathered and maintained by the National Statistical Institutes (NSI) of
seven pilot countries. This allows researchers and policymakers to apply a single research design to
the firm-level data of multiple countries, and opens the way for insightful cross-country comparisons
of trends and analysis of policy initiatives.

Furthermore, a special focus was put on the role of intangible assets2 in explaining the productivity
puzzle. Research suggests that intangible assets, and especially digital technology, are a common
driver of depressed productivity growth, increased divergence, rising profits and declining competition
(Aghion et al, 2019; De Ridder, 2021). Intangible assets create increasing returns to scale and winner-
takes-all dynamics. A select group of firms that is better able to make these intangible investments (for
reasons such as access to finance or organisational capabilities) can drive a wedge between
themselves and other firms in their industry. An initially good position on the market can thus become
entrenched, discouraging followers from competing actively and investing in innovation. As part of the
first MICROPROD work package, two papers were dedicated to measuring intangible capital and to
understanding its role in production (Bisztray et al, 2020; Kaus et al, 2020).

The data infrastructure developed through this work package offers valuable insights into the evolution
of productivity across the European Union and into the effects of digitalisation and globalisation. It can

2
 In their seminal work, Corrado et al (2009) proposed a classification of intangible capital into three broad categories.
Computerised information covers all information that can be digitalised. Innovative property measures the knowledge,
scientific or otherwise, used to develop new products. Economic competencies refer to the knowledge embedded in the
employees and organisational structures of firms.

                                                           3
thus generate important evidence in designing policies to support the European Commission’s policy
objectives, especially for achieving the digital and green transitions. More generally, the research
enabled by this data infrastructure and carried out within the context of MICROPROD can provide
valuable lessons about the response of European economies to the COVID-19 pandemic and its
aftermath.

The Micro Data Infrastructure

The Micro Data Infrastructure (MDI) builds on existing firm-level data infrastructures maintained by
national statistical institutes (NSI) and used to measure the economy. The objective is to facilitate
cross-country analysis of productivity by addressing two main shortcomings. First, while each
country’s data infrastructure is accessible to researchers, this comes at a high administrative cost. In
practice, this greatly limits the number of cross-country analyses carried out. NSIs impose strict rules
to protect their sensitive data sources. Permission to perform research needs to be obtained for each
country individually, and the results that can be published need to respect certain confidentiality
rules, which can differ across countries. A significant advantage of the MDI is that is provides a single
platform through which a research project can obtain access to all participating NSIs3, and which
ensures that the published results respect all confidentiality rules. This harmonisation of data access
means that a theory can be tested in multiple countries. It allows researchers to explore the diversity
of experiences in European countries, and to evaluate the different policy choices made in different
countries, such as in the areas of innovation funding or market regulation.

Second, to follow the development of an ever-evolving economy, new methodologies are constantly
being developed, before they are harmonised internationally. Hence, the second contribution of the
MDI is to improve the harmonisation of variable definition and data sources. As part of the MDI, a
common set of analytical tools was developed to simplify research designs to study the dynamic
evolution and the drivers of productivity. In particular, the MDI has worked on linking various datasets
to analyse common drivers of productivity. The core data infrastructure relies on the business register,
which collects information on the legal status of companies. Information on the economic activities of
firms (eg their use of labour and capital inputs, and the amount of output produced) is obtained from
structural business statistics. These two data sources are then linked to the EU Community Innovation
Survey (CIS)4 and the ICT Usage and E-commerce Survey (ICTEC)5 to obtain information on firms’

3
    As for the time of writing, the participating NSIs are: Denmark, Finland, Norway, Sweden, France and the Netherlands.
4
    See https://ec.europa.eu/eurostat/web/microdata/community-innovation-survey.

                                                                4
innovative activities, and to international trade statistics and foreign affiliate statistics for information
on integration in global value chains (Bartelsman et al, 2020).
Finally, the MICROPROD project focused on improving the measurement of intangible assets. The
definition of which expenditures correspond to investment in intangible assets still differs across
countries, and tends to be collected in different types of data. For example, some companies consider
spending on intangibles as investments in productive assets and report them on their balance sheets.
Other companies consider these as expenses and report them in profit and loss accounts. Hence, the
same item, at least in economic terms, can be found in different datasets.
The measurement of intangibles can differ between different research projects and depends on the
data sources used. Kaus et al (2020) considered expenditure on internal R&D, purchased software
and purchased patents/licenses/trademarks, which are included in the German structural business
statistics surveys in manufacturing. Bisztray et al (2020) linked information from several firm-level
surveys on innovation, R&D, intangible investments and ICT capital, to information on firm activity in
Hungary, to assess how different measures of intangible assets correlate with each other and with firm
productivity. Each source of data picks up an important input into production, which does not fully
overlap the other measures. This highlights the importance of collecting information from these
different sources.
Achieving the European Commission’s policy objectives
The MDI enables the production of evidence to support policy analysis and evaluation to help achieve
the objectives of the European Commission. In particular, the European Commission wishes to guide
the European economy through two major transformations, the digital and the green transitions. The
Commission’s digital strategy aims to make Europe fit for the digital age by fostering the adoption of
digital technologies, in particular intangible assets. The objective of the European Green Deal is to fully
decarbonise the European economy by 2050, with an intermediary target of reducing emissions by 55
percent by 2030 compared to the 1990 level. The MDI can help researchers understand the barriers
faced by firms in the adoption of digital and green technologies, and the long-term ramifications of
these changes, especially on productivity growth.
EU countries are not equal in the face of digital technology adoption and investment in intangible
assets more generally. Figure 2 shows significant differences between countries in the amount
5
See https://ec.europa.eu/eurostat/statistics-explained/index.php?title=Statistics_on_ICT_usage_and_e-
commerce_introduced.
5investedd in intangibble capital. Given
G the im
mportant rolee of intangible assets inn driving prooductivity
performaance, this disparity
d accross countrries raises the risk of divergence between European
E
economies. In additiion, the dispparity in intanngible investtment is stroongly presennt across firm
ms within
sectors6. This uneveen distributioon of intangi ble investmeent across firms also traanslates into unequal
returns tto intangible investment.. There appeaars to be a sm
mall group off intangible-iintensive firm
ms which
obtain sizeable prodductivity gain
ns. The perforrmance of thhese firms coontrasts withh the behavioour of the
majorityy of firms in each
e mounts, if at all, in intanggible assets, and reap
industry, which inv est small am
limited rrewards from
m these (Kauss et al, 2020)).
Figure 22: Intangible intensity in percentage,, 2016
Source: IN
NTAN-invest. Noote: Intangible in
ntensity is defi ned as investm
ment in intangible assets divideed by value-added.
Theoretical results from
f studiess such as Agghion et al (2019) and De Ridder (2021) sugggest that
intangible assets, byy creating in
ncreasing retturns to scalle, lead to th
he entrenchm
ment of this group of
superstaar firms. Inveestments in intangible asssets, and esspecially diggital technoloogies, represent large
upfront costs for firm
ms, subsequ
uently allowiing them to reduce theirr operating ccosts and to become
6
This hass been documented by Arrigheetti et al (20144) for Italy, Kaus et al (2020) and Le Mouel aand Schiersch (2022) for
Germany, and De Ridder (2021) for the United States aand France.
6more competitive. This makes it more difficult for laggard firms to catch-up. It reduces the competitive
pressure faced by leading firms, which in turn invest less in innovation. In the long run, this dampened
competitive pressure leads to lower productivity growth overall. Aghion et al (2019) argued that this
mechanism explains the observed productivity performance of the United States since the 1990s. This
country saw a productivity boom in the 1990s as firms invested heavily in ICT, but since then,
productivity growth has slowed, while concentration has increased.
Therefore, understanding the drivers of investment in intangible assets is essential in order to design
policies that can prevent this entrenchment effect while maintaining enough competition to keep the
engine of growth active. The results of the MICROPROD analysis echo much of the literature in
identifying two sorts of barriers to investment. The first is access to resources, and the second is lack
of incentives.
The results of Bisztray et al (2020) confirmed those of Bloom et al (2012), in that the successful
adoption of digital technologies requires complementary investments in other sorts of intangible
assets, in particular organisational capabilities. Bisztray et al (2020) emphasised the broad nature of
intangibles, whereby the productivity gains from the adoption of ICT technologies are maximised when
accompanied by innovation expenses and investment in economic competencies. This analysis
shows that the definition of intangibles recorded on balance sheets misses some important
components. The data infrastructure that permits effective measurement of the deployment of digital
technologies and the complementary intangible assets thus needs to link the various data sources
listed above. The need to invest in a broad bundle of assets can explain the skewed distribution of
investment, with many firms reporting no intangible activity at all. If these firms lack access to the
complementary resources, notably human and organisational, needed to deploy digital technologies
effectively, they will not engage in such activities. Hence, the European Commission’s digital strategy
needs to encompass policies that promote the adoption of these complementary assets, including
labour market policies that promote investment in training.
The other major hurdle faced by firms that wish to invest in digital technologies, and especially
intangible assets, is access to finance. One of the reasons put forward to explain the slower
deployment of intangibles in Europe compared to the United States is the bigger role of banks in
financing economic activity in Europe compared to other regions (Claeys and Demertzis, 2021).
Intangible assets are ill-suited for bank financing because they cannot serve as collateral. Their value
tends to be specific to the firm that has invested in them, which means that they are difficult to
transfer between firms. There are generally no markets on which they can be exchanged, which means
7there is no commonly agreed price or value against which a firm could borrow. This means that
intangible assets are often financed through internal funding, which contributes to the entrenchment
dynamics described above. Successfully investing in intangible assets helps firm charge higher
markups and earn larger profits, which can be used to finance the next round of intangible investments
from their own cash flows. Therefore, developing equity markets and venture capital funding are
important measures to level the playing field between firms, and allow a larger share of companies to
enter the competitive race.
When it comes to ensuring that all firms have sufficient incentives to invest in digital and intangible
assets, competition policy becomes crucial. Striking the right balance between ensuring a level
playing field and allowing investors to get the rewards of their investments is not easy. One the one
hand, increased market power, and the ability to charge higher mark-ups, is a reward for undertaking
these investments, especially if they result in better quality products and services. On the other hand,
the abuse of this market power to block entry of new participants is detrimental in the long-run as it
dampens even the incentives of leading firms to continue innovating. Policy initiatives such as the EU
Digital Markets Act (DMA)7 seek to maintain competition between large digital platforms and ensure
that these platforms do not prevent the entry of new actors or stunt the growth of potential smaller
competitors.
The MDI infrastructure can also provide valuable evidence in support of the European Commission’s
second long-term objective, that of decarbonising the European economy by 2050. This transition
implies deep structural changes to the economy, raising a number of questions about the future
productivity of the European economy. First, the path of productivity growth over the transition is
unclear. If green technologies are deployed rapidly, before they are fully competitive with brown
technologies, productivity performance will be dampened for several years. In addition, it is also
unclear whether technological progress will match historical trends once the transitional phase is over.
Second, it is also unclear whether fossil-fuel energy will be substituted mostly for capital or for labour.
This will have implications for the productivity of these factors of production, and hence their
compensation. Finally, the exposure of companies to international competition and their ability to
offshore their most carbon-intensive activities determines the extent of carbon leakage that can be
7
See https://ec.europa.eu/info/strategy/priorities-2019-2024/europe-fit-digital-age/digital-markets-act-ensuring-fair-and-
open-digital-markets_en.
8expected. Solid evidence on this question is relevant for the policy discussion on the proposed EU
Carbon Border Adjustment Mechanism8.
Making sense of the pandemic response and recovery
Since the MICROPROD project was designed, the European economy has faced a major disruption from
the COVID-19 pandemic. Governments responded to the health situation by forcing the effective shut-
down of specific economic activities and implementing support mechanisms to cushion some of the
more severe economic and social effects. This massive intervention in the economy has disrupted the
standard process of business dynamics. The data infrastructure created in the context of this project
and some of its research findings offer timely insights to understand the consequences of this shock
for the evolution of European economies, especially in terms of productivity growth, digitalisation and
globalisation.
The lockdown measures imposed to respond to the COVID-19 pandemic have forced many companies
to accelerate their adoption of digital technologies, and to re-think organisational practices. The results
discussed above suggest that this has likely exacerbated the disparities between firms. Indeed,
intangible-intensive companies entered the crisis on a much stronger footing than firms that were
unaccustomed to investing in intangible assets. The focus of the MDI on measuring ICT adoption
makes it well suited to analyse the patterns of digital investment during the pandemic, and the
resulting productivity dynamics, albeit with a lag.
Productivity dynamics have also been altered by the generous support packages put in place during
the pandemic. By stalling the process of business creation and destruction, the presence of these
support packages has slowed down the reallocation of resources from low-productivity firms towards
more productive firms. The long-run effect on aggregate productivity also depends on how firms
respond to the scaling back of these support packages. Altomonte et al (2021a) showed that, in
France, Germany and Italy, while there was no explicit targeting, the funds from the support packages
were allocated to firms with a good chance of surviving after the crisis. The MDI can be used to measure
the effect on productivity of removing the support packages. Its cross-country dimension gives
researchers the opportunity to evaluate different policy choices in terms of their aggregate economic
outcomes.
8
See https://ec.europa.eu/commission/presscorner/detail/en/qanda_21_3661.
9The pandemic has also disrupted global supply chains severely, most prominently in the area of
medical equipment, and then extending to the supply of semiconductors. The concept of ‘strategic
autonomy’ has gained visibility and traction, as policymakers have become increasingly wary of
dependence on supply chains where there are potential bottlenecks. However, policies seeking to
shorten supply chains or reshore certain activities require balancing resilience to shocks with possible
productivity gains. The literature has emphasised several complex channels through which global
integration affects productivity. Global value chains play a major role in channelling knowledge flows
(Altomonte et al, 2021b; Bisztray, 2021). Import competition from high-income countries creates
incentives for productivity improvements, but this does not seem to hold for import competition from
low and middle-income countries (Bräuer et al, 2019). Finally, the relationship between offshoring and
productivity gains has been long studied, with mixed results. The type and timing of offshoring appear
to be determining factors9.
Conclusion
European economies face both short-term and long-term transformations. While the ripple effects of
the economic shock from the COVID-19 pandemic are still being managed, the European economy is
being steered in a more digitally intensive and low-carbon direction. These policy objectives rest on
understanding the behaviour of firms and the competition dynamics between them. Firm-level data is
central to understanding the barriers faced by firms in adopting digital technologies, such as limited
access to human and financial capital. Access to administrative datasets, which combine the business
register with structural business statistics survey data, offers the most representative view of the
population of firms, and allows for the whole productivity distribution to be observed. This is
particularly useful in identifying the winning and losing firms from various policy efforts, such as the
pandemic support packages or the adoption of digital technologies. Finally, the ability to implement a
single analysis across multiple countries, such as the measurement of productivity trends or of
intangible investment, offers the scope for a fine-grained analysis of the productivity implications of
specific policy choices.
9
Kaus and Zimmermann (2022), using German data from the International Sourcing Survey, did not find an effect of
offshoring on productivity. A potential explanation for this finding could be the time period observed. The analysis was
carried out with data covering the period 2014 to 2016, while most of the productivity gains from offshoring may have
already materialised in previous waves of offshoring.
10References
Aghion, P., A. Bergeaud, T. Boppart, P.J. Klenow and H. Li (2019) ‘A Theory of Falling Growth and Rising
Rents’, Working Paper No. 26448, National Bureau of Economic Research, available at
https://doi.org/10.3386/w26448
Altomonte, C., M. Demertzis, L. Fontagné and S. Mueller (2021) ‘COVID-19 financial aid and productivity:
has support been well spent?’ Policy Contribution 21/2021, Bruegel
Altomonte, C., G.I.P. Ottaviano, A. Rungi and T. Sonno (2021b) ‘Business Groups as Knowledge-Based
Hierarchies of Firms’, SSRN Scholarly Paper No. ID 3960281, Social Science Research Network,
Rochester, NY
Andrews, D., C. Criscuolo and P.N. Gal (2015) Frontier Firms, Technology Diffusion and Public Policy:
Micro Evidence from OECD Countries, OECD, Paris, available at https://doi.org/10.1787/5jrql2q2jj7b-en
Arrighetti, A., F. Landini and A. Lasagni (2014) ‘Intangible assets and firm heterogeneity: Evidence from
Italy’, Res. Policy 43, 202–213, available at https://doi.org/10.1016/j.respol.2013.07.015
Autor, D., D. Dorn, L.F. Katz, C. Patterson and J. Van Reenen (2020) ‘The Fall of the Labor Share and the
Rise of Superstar Firms’, Q. J. Econ. 135: 645–709, available at https://doi.org/10.1093/qje/qjaa004
Bartelsman, E., M. Hälbig and F. di Mauro (2020) Methodological Report on Cross-country Analysis of
Newly Developed Firm-level Indicators, MICROPROD Deliv. D12 28
Bisztray, M. (2021) Dissecting Global Value Chains: Evidence from the global automotive industry,
MICROPROD Deliv. D26 44
Bisztray, M., B. Muraközy and D. Vonnák (2020) Analysis of the importance of intangible capital and
knowledge for productivity measurement, MICROPROD Deliv. D15 70
Bloom, N., R. Sadun and J. Van Reenen (2012) ‘Americans Do IT Better: US Multinationals and the
Productivity Miracle’, Am. Econ. Rev. 102: 167–201, available at
https://doi.org/10.1257/aer.102.1.167
Bräuer, R., M. Mertens and V. Slavtchev (2019) Import Competition and Firm Productivity: Evidence
from German Manufacturing, MICROPROD Deliv. D23 43
11Claeys, G. and M. Demertzis (2021) ‘The productivity paradox: policy lessons from MICROPROD’, Policy
Contribution 01/2021, Bruegel
Corrado, C., C. Hulten and D. Sichel (2009) ‘Intangible Capital and U.S. Economic Growth’, Rev. Income
Wealth 55: 661–685, available at https://doi.org/10.1111/j.1475-4991.2009.00343.x
Criscuolo, C., D. Andrews and P.N. Gal (2019) ‘The best versus the rest: divergence across firms during
the global productivity slowdown’, CEP Discuss. Pap.
De Loecker, J., J. Eeckhout and G. Unger (2020) ‘The Rise of Market Power and the Macroeconomic
Implications’, Q. J. Econ. 135: 561–644, available at https://doi.org/10.1093/qje/qjz041
De Ridder, M. (2021) ‘Market Power and Innovation in the Intangible Economy’, available at
https://ec.europa.eu/info/sites/default/files/research_and_innovation/events/presentations/de-ridder-
market-power.pdf
Decker, R.A., J. Haltiwanger, R.S. Jarmin and J. Miranda (2017) ‘Declining Dynamism, Allocative
Efficiency, and the Productivity Slowdown’, Am. Econ. Rev. 107: 322–326, available at
https://doi.org/10.1257/aer.p20171020
Garcia-Macia, D., C.-T. Hsieh and P.J. Klenow (2019) ‘How Destructive Is Innovation?’ Econometrica
Kaus, W., V. Slavtchev and M. Zimmermann (2020) ‘Intangible capital and productivity: Firm-level
evidence from German manufacturing’, Working Paper No. 1/2020, IWH Discussion Papers, also
MICROPROD Deliv. D1.5.
Kaus, W. and M. Zimmermann (2022) ‘Offshoring, Domestic Employment and Production. Evidence
from the German International Sourcing Survey’, mimeo, also MICROPROD Deliv. D1.6.
Le Mouel, M. and A. Schiersch (2022) ‘Intangible capital and productivity divergence’, TILEC Discuss.
Pap. DP2022-007
12© Bruegel 2022. All rights reserved. Short sections, not to exceed two paragraphs, may be quoted in the original language without explicit permission provided that the source is acknowledged. Opinions expressed in this publication are those of the author(s) alone. Bruegel, Rue de la Charité 33, B-1210 Brussels (+32) 2 227 4210 info@bruegel.org www.bruegel.org
You can also read