Can you always reap what you sow? Network and functional data analysis of VC investments in health-tech companies
←
→
Page content transcription
If your browser does not render page correctly, please read the page content below
Can you always reap what you sow? Network
                                             and functional data analysis of VC investments
                                                        in health-tech companies

                                               Christian Esposito1,2,∗ , Marco Gortan3,∗ , Lorenzo Testa1,2,∗ , Francesca
arXiv:2111.06371v1 [cs.SI] 10 Nov 2021

                                               Chiaromonte1,4, Giorgio Fagiolo1 , Andrea Mina1,5 , and Giulio Rossetti6
                                         1
                                               Inst. of Economics & EMbeDS, Sant’Anna School of Advanced Studies, Pisa, Italy
                                                          2
                                                            Dept. of Computer Science, University of Pisa, Pisa, Italy
                                                              3
                                                                Dept. of Finance, Bocconi University, Milan, Italy
                                             4
                                                Dept. of Statistics & Huck Institutes of the Life Sciences, Penn State University,
                                                                             University Park, USA
                                                  5
                                                     Centre for Business Research, University of Cambridge, Cambridge, UK
                                                                      6
                                                                        KDD Lab. ISTI-CNR, Pisa, Italy
                                                                      ∗ These authors contributed equally

                                                  Abstract. “Success” of firms in venture capital markets is hard to de-
                                                  fine, and its determinants are still poorly understood. We build a bipar-
                                                  tite network of investors and firms in the healthcare sector, describing
                                                  its structure and its communities. Then, we characterize “success” in-
                                                  troducing progressively more refined definitions, and we find a positive
                                                  association between such definitions and the centrality of a company. In
                                                  particular, we are able to cluster funding trajectories of firms into two
                                                  groups capturing different “success” regimes and to link the probability
                                                  of belonging to one or the other to their network features (in particular
                                                  their centrality and the one of their investors). We further investigate this
                                                  positive association by introducing scalar as well as functional “success”
                                                  outcomes, confirming our findings and their robustness.

                                                  Keywords: network analysis, functional data analysis, success analysis,
                                                  venture capital investments

                                         1      Introduction
                                         Many phenomena may be described through networks, including investment in-
                                         teractions between bidders and firms in venture capital (VC) markets [1] and
                                         professional relationships among firms [2]. Risk capital is an essential resource for
                                         the formation and growth of entrepreneurial venture and venture capital firms
                                         are often linked together in a network by their joint investments in portfolio
                                         companies [3]. Through connections in such a network, they exchange resources
                                         and investment opportunities with one another. Many studies show the impact
                                         of network dynamics on investments, raising efficiency [4] and providing precious
                                         information when there is a great level of information asymmetry [5]. Also, differ-
                                         entiating connection types and avoiding tight cliques appear to help the success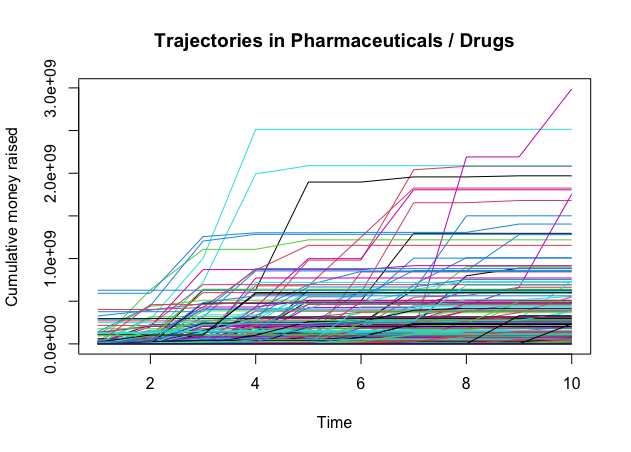
2       Esposito, Gortan, Testa et al.

of an investor by providing more diverse information and reducing confirmation
bias [3].
    CB Insights [6] provides records of all transactions in venture capital markets
from 1948. Since data until 2000 are partial and discontinuous, we focus on
the period 2000-2020, in order to minimize the impact of missing data on our
analysis. Additionally, since different sectors may be characterized by different
investment dynamics [7], we focus on the healthcare sector, which is of great
importance and has shown to be less sensitive to market oscillations [8]. This
stability is also shared by returns of life science VC, where investments have a
lower failure rate but are at the same time less likely to generate “black-swan”
returns [9], offering more consistency but a lower likelihood of achieving billion-
dollars evaluations.
    While the number of exits through an IPO or through a trade sale can be seen
as a proxy for the success of an investor [10], there are instead different definitions
of “success” for startups, but a common factor seems to be the growth rate of
the company [11]. Our work aims to understand whether network features may
affect “success” of investments in healthcare firms. In order to investigate this,
we introduce progressively more nuanced definitions of “success”, and analyze
them with increasingly sophisticated statistical tools.
    The paper is organized as follows. Section 2 introduces and characterizes a
network of investors and firms, describing its structure and salient properties, in-
cluding the communities emerging from its topology. Then, Section 3 focuses on
the definition and analysis of “successful” firms. We first characterize “success”
by looking at the funding trajectories of each firm, clustering these trajectories
into two broad groups capturing a high and a low funding regime. The binary
cluster membership labels provide a first, rough definition of “success”. We run
a logistic regression in order to explain “success” defined in this fashion with
statistics computed on the network itself. We then move to more complex char-
acterizations of “success”: the total amount of money raised (a scalar) and the
funding trajectory itself (a functional outcome). We run regressions also on these
outcomes, to validate and refine our previous results. Finally, we discuss main
findings and provide some concluding remarks in Section 4.

2    Network characterization

The 83258 agents in the healthcare sector are divided into two broad categories:
32796 bidders, or investors, and 50462 firms. Companies open investment calls
in order to collect funds; investors answer such calls and finance firms. Each
deal, i.e. each transaction from an investor to a company, is recorded in the
CB Insights’ database. This market dynamics can be described by a bipartite
network, which indeed is built on the notion of dichotomous heterogeneity among
its nodes. In our case, each node may be a firm or an investor, respectively. An
undirected link exists between two nodes of different kinds when a bidder has
invested into a firm. Of course, given the possibility for an investor to finance
the same firm twice, the bipartite network is also a multi-graph. By knowing the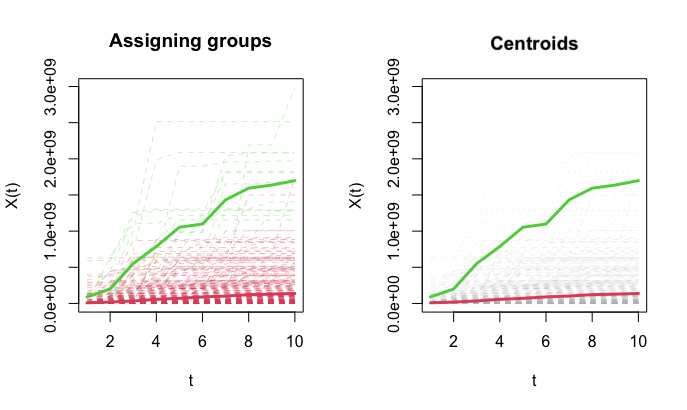
Can you always reap what you sow?         3

Table 1. Statistics computed on the projected graphs of investors and firms. Before
running regressions in Section 3, left-skewed variables are normalized through log-
transformation.

Variable                                    Network meaning
Degree centrality                           Influence
Betweenness centrality [12]                 Role within flow of information
Eigenvector centrality [13]                 Influence
VoteRank [14]                               Best spreading ability
PageRank [15]                               Influence
Closeness centrality [16]                   Spreading power (short average distance
                                            from all other nodes)
Subgraph centrality [17]                    Participation in subgraphs across the net-
                                            work
Average neighbor degree [18]                Affinity between neighbor nodes
Current flow betweenness centrality [19]    Role within flow of information

date in which investments are made, we can produce yearly snapshots of the
bipartite network. A company (investor) is included in a snapshot of a certain
year only when it receives (makes) an investment that year. By projecting the
bipartite network onto investors and firms, we produce the two projected graphs
which are used to compute all the node statistics described in Table 1. As the
bipartite network is a multi-graph, defining projections on a subset of nodes
requires an additional assumption. Specifically, we project the bipartite graph
onto firms by linking them in a cumulative fashion: we iteratively add to each
yearly projected snapshot a link between two companies in which a bidder has
invested during that year. Concerning the projection of the bipartite network
onto investors, we link two bidders whenever they invest in the same company
in the same financing round.
    Roughly 75% of the companies in the network projected onto firms are North
American and European (around 55% belong to the US market), while the re-
maining 25% is mostly composed of Asian companies. Around 60% of the com-
panies operate within the sub-sectors of medical devices, medical facilities and
biotechnology – the pharmaceutical sub-sector alone accounts for 20% of the
network. As of August, 2021, roughly of 80% the companies in the network are
either active or acquired, with the remaining portion being inactive or having
completed an IPO. We witness turnover of the active companies through the
years, but this is expected: a company’s status is evaluated as of 2021, and it is
more likely to observe a dead company among those that received investments in
1999 than in 2018. Indeed, both death and IPO represent the final stage of the
evolution of a company, so those that received funding in earlier years are more
likely to have already reached their final stage. Finally, we do not observe marked
changes in terms of graph sub-sectoral composition: the relative share of each
sub-sector is rather stable through the years, with the exception of an increase
4 Esposito, Gortan, Testa et al.
in the shares of the internet software and mobile software sub-sectors (from 1%
in 1999 to 8% in 2019 and from 0% in 1999 to 5% in 2019, respectively).
2.1 Communities
By employing the Louvain method [20], we identify meso-scale structures for
each yearly snapshot of the network projected onto firms. For each year, we
rank communities by their size, from the largest to singletons. We then compare
the largest communities across years, by looking at their relative sub-sectors,
status and geographical composition.
While the specific nodes in the biggest communities may vary throughout
the years, we notice a relative stability in their features. The largest commu-
nities (which contain between 13% and 20% of the nodes) reflect the status
composition of the general network, downplaying unsuccessful companies and
giving higher relative weight to IPO ones, showing just a variation between ac-
quired and active companies across years (i.e. active companies are relatively
over-represented in more recent largest communities than in older ones). Con-
sidering geographical information, the largest communities comprise mainly US
companies, with an under-representation of other continents. This trait is quite
consistent through the years, with the exception of two years (2013-2014). With
respect to sub-sectors, the largest communities mainly contain medical device
and biotechnology companies, and they are quite consistent through the years
in terms of sub-sectoral composition.
The second largest communities (containing between 10% and 14% of nodes
in the network) have a less consistent sub-sectoral composition through the years,
although it is worth highlighting that they comprise companies operating within
software and technology. Geographically, we are still witnessing communities
of mostly US-based companies, although 5 years out of 20 show a remarkable
(roughly 80%) presence of European companies. Finally, status composition is
balanced between active and acquired until the later years, when active compa-
nies predominate within the second largest communities. IPOs are not present,
while there are, in a small percentage (between 5% and 20%), dead startups.
Finally, the third largest communities (containing between 7% and 12% of
the nodes) present a clear change within the period considered: in the first ten
years, they mostly comprise failed or acquired European companies within the
fields of biotechnology and drug development, while, in the second decade, they
comprise active US companies within the fields of medical devices and medical
facilities.
3 Success analysis
Given the bipartite network and its projections, we now turn to the analysis
of success and of its main drivers. Because of the elusiveness of the definition
of “success”, we proceed in stages – considering progressively more refined out-
comes and comparing our findings. Moreover, since many of the records availableCan you always reap what you sow? 5
Fig. 1. Money raised cumulatively as a function of time, shown for 319 firms in the
pharmaceuticals and drugs sub-sector. Funding trajectories are constructed over a pe-
riod of 10 years since birth, and aligned using birth years as registration landmarks.
in the CB Insights’ data set are incomplete, and our aim is to capture the tem-
poral dynamics leading a firm to succeed, we further restrict attention to those
companies for which full information is available on birth year, healthcare market
sub-sector and investment history for the first 10 years from founding. Although
this filtering may introduce some biases, it still leaves us with a sizeable set of
3663 firms belonging to 22 different sub-sectors.
Notably, we restrict our focus also in terms of potential predictors, due to
the fact that our collection of network features exhibits strong multicollineari-
ties. By building a feature dendrogram (Pearson correlation distance, complete
linkage) and by evaluating the correlation matrix, we reduce the initial set to
four representatives. In particular, we select two features related to the investors’
projection (the maximum among the degree centralities of the investors in a com-
pany and the maximum among their current flow betweenness centralities, both
computed in the company’s birth year) and two features computed on the firms’
projection (a company’s eigenvector and closeness centralities, computed in the
year in which the company received its first funding).
Each firm has its own funding history: after its birth, it collects funds over
the years, building a trajectory of the amount of money it is able to attract. We
treat these trajectories as a specific kind of structured data, by exploiting tools
from a field of statistics called Functional Data Analysis (FDA) [21], which
studies observations that come in the form of functions taking shape over a
continuous domain. In particular, we focus on the cumulative function of the
money raised over time by each company. As an example, Figure 1 shows 3196 Esposito, Gortan, Testa et al.
Fig. 2. k-means clustering (k = 2) of the funding trajectories of firms belonging to the
pharmaceuticals and drugs sub-sector. The green and red dashed lines represent firms
in the high (“successful”) and low regimes, respectively. Bold curves represent cluster
centroids. To aid their visualization, centroids are shown again in the right panel with
individual trajectories in gray.
such cumulative functions, for the firms belonging to the pharmaceuticals and
drugs sub-sector. Trajectories are aligned, so that their domain (“time”) starts
at each company’s birth (regardless of the calendar year it corresponds to). By
construction, these functions exhibit two characterizing properties: first, they
are monotonically non-decreasing; second, they are step functions, with jumps
indicating investment events.
Our first definition of success is based on separating these trajectories into
two regimes characterized by high (successful) vs. low investment patterns: the
first runs at high levels, indicating successful patterns, and the second at low
levels. Because of heterogeneity among healthcare sub-sectors, we accomplish
this by running a functional k-means clustering algorithm [22, 23] with k = 2,
separately on firms belonging to each sub-sector. As an example, companies
belonging to the sub-sector of pharmaceuticals and drugs are clustered in Figure
2. Throughout all sub-sectors, the algorithm clusters 89 firms in the high-regime
group and 3574 in the low-regime one.
This binary definition of “success” turns out to be rather conservative; very
few firms are labeled as belonging to the high investment regime. Consider the
logistic regression
p
P (yi = 1) X
log = β0 + βj xij i = 1, . . . n (1)
1 − P (yi = 1) j=1Can you always reap what you sow? 7
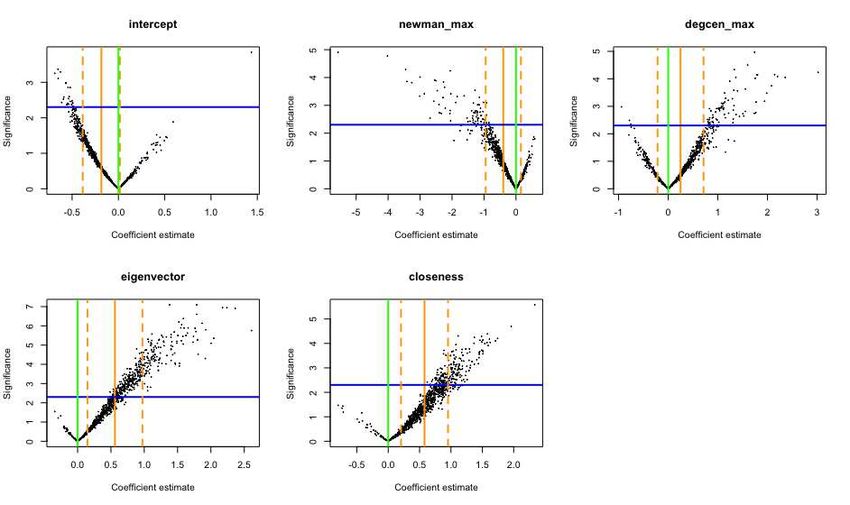
Fig. 3. Scatter plots of logistic regression coefficient estimates (horizontal) and signif-
icance (vertical; −log(p-value)). Each point represents one of 1000 fits run on data
balanced by subsampling the most abundant class. Orange solid line mark averages
across the fits, and orange dashed lines ±1 standard deviations about them. Green
solid lines mark 0 on horizontal axes. Blue line mark significance values associated to
a p-value of 0.1.
where n is the number of observations, yi , i = 1, . . . n, are the binary responses
indicating membership to the high (yi = 1) or low (yi = 0) regime clusters; β0
is an intercept and xij , i = 1, . . . n and j = 1, . . . , p (p = 4), are the previously
selected scalar covariates.
If we fit this regression on our unbalanced data, results are bound to be
unsatisfactory and driven by the most abundant class. Running such a fit, one
obtains an explained deviance of only 0.10. To mitigate the effects of unbalanced
data [24], we randomly subsample the most abundant class (the low-regime firms)
as to enforce balance between the two classes, and then run the logistic regression
in Equation 1. We repeat this procedure 1000 times, recording estimated coef-
ficients, associated p-values and explained deviances. The average of the latter
across the 1000 replications is substantially higher than on the unbalanced fit,
reaching 0.18 (some fits produce deviance explained as high as 0.45). Moreover,
we can investigate significance and stability of the coefficient estimates through
their distribution across the repetitions. Figure 3 shows scatter-plots of these
quantities, suggesting that the two variables related to the firms’ centrality have
a modest yet stable, positive impact on the probability of belonging to the high-
regime cluster. This is not the case for the variables related to the investors’
centrality.8 Esposito, Gortan, Testa et al.
This first evidence of a positive relationship between the success of a firm
and its centrality, or importance (in a network sense) is promising. However, the
binary definition of “success” we employed is very rough – and the unbalance in
the data forced us to run the analysis relying on reduced sample sizes (89 + 89 =
178 observations in each repeated run). Thus, we next consider a scalar proxy
for “success”, which may provide a different and potentially richer perspective.
Specifically, we consider the cumulative end point of a firm’s funding trajectory,
i.e. the total value of the investment received through its temporal domain.
For this scalar response, we run a best subset selection [25] considering all
the network features in our initial set – not just the 4 selected to mitigate
multicollinearity prior to the logistic regression exercise. Notably, despite the
substantial change in the definition of “success”, results are in line with those
from the logistic regression. Indeed, the first selected variable, when the predictor
subset is forced to contain only one feature, is the eigenvector centrality of firms.
When the predictor subset size is allowed to reach 4, the features selected are
the closeness and the VoteRank of the firm, and the maximum current flow
betweenness centrality among its investors (computed on the firm’s birth year).
Thus, the only difference compared to our previous choice is the selection of
the firms’ VoteRank centrality instead of the maximum among the investors’
degree centrality. We compare the two alternative selections of four features as
predictors of the scalar “success” response fitting two linear models of the form:
p
X
y i = β0 + βj xij + ǫi i = 1, . . . n (2)
j=1
where n is the number of observations, yi , i = 1, . . . n, are the scalar responses
(aggregate amount of money raised); β0 is an intercept; xij , i = 1, . . . n and
j = 1, . . . , p (p = 4), are the scalar covariates belonging to one or the other
subset and ǫi , i = 1, . . . n, are i.i.d. Gaussian model errors. As shown in Table 2,
the maximum degree centrality among a firm’s investors is not statistically sig-
nificant. Surprisingly, the maximum among investors’ current flow betweenness
centralities is significantly negative, but its magnitude is close to 0. In contrast,
the firms’ closeness and eigenvector centralities are positive, statistically signifi-
cant and sizeable. This is in line with what we expected, since it is reasonable to
think that knowledge may indirectly flow from other startups through common
investors, increasing the expected aggregate money raised. Finally, the firms’
VoteRank centrality appears to have a negative, statistically significant impact
on the aggregate money raised. This should not be surprising, given that the
higher the VoteRank centrality is, the less influential the node will be. The vari-
ance explained by the two models is similar and still relatively low (R2 ≈ 0.13),
which may be simply due to the fact that network characteristics are only one
among the many factors involved in a firm’s success [26]. Nevertheless, the re-
sults obtained here through the scalar “success” outcome are consistent with
those obtained through the binary one and logistic regression.
Our scalar outcome (aggregate money raised) has its own drawbacks. In
particular, it implicitly assumes that the right time to evaluate success andCan you always reap what you sow? 9
Table 2. Linear regressions of aggregate money raised on two sets of predictors. All
variables are scaled and some are log-transformed (as indicated parenthetically).
Dependent variable:
Aggregate money raised (log)
(1) (2)
newman max −0.065 ∗∗
−0.072∗
(0.030) (0.041)
voterank (log) −0.140∗∗∗
(0.033)
degcen max (log) 0.050
(0.040)
closeness 0.126∗∗∗ 0.130∗∗∗
(0.037) (0.030)
eigenvector (log) 0.214∗∗∗ 0.255∗∗∗
(0.034) (0.028)
Constant 0.113∗∗∗ 0.062∗∗
(0.030) (0.025)
Observations 1,118 1,364
R2 0.136 0.127
Adjusted R2 0.133 0.125
Residual Std. Error 0.992 (df = 1113) 0.923 (df = 1359)
F Statistic 43.951∗∗∗ (df = 4; 1113) 49.458∗∗∗ (df = 4; 1359)
Note: ∗
p10 Esposito, Gortan, Testa et al.
Fig. 4. Function-on-scalar regression, coefficient curve estimates. (a) intercept function
(this can be interpreted as the sheer effect of time on the response); (b) maximum de-
gree centrality among investors (company’s birth year); (c) maximum across investors’
current flow betweenness centrality (company’s birth year); (d) company’s eigenvector
centrality; (e) company’s closeness centrality. Dotted lines represent confidence bands.
All the covariates are standardized.
where n is the number of observations; Yi (t), i = 1, . . . n, are the aligned funding
trajectories; β0 (t) is a functional intercept; xij , i = 1, . . . n and j = 1, . . . , p
(p = 4), are the scalar covariates belonging to the one or the other set, and ǫi (t),
i = 1, . . . n, are i.i.d. Gaussian model errors.
The regression coefficient of a scalar covariate in this model, βj (t), is itself
a curve describing the time-varying relationship between the covariate and the
functional response along its domain. Together with the functional coefficients,
we also estimate their standard errors, which we use to build confidence bands
around the estimated functional coefficients [28]. Coefficient curve estimates for
the covariate set including the maximum investors’ degree centrality are shown in
Figure 4 (results are very similar with the other set of covariates). The impacts of
an increase in the maximum among the degree centralities and in the maximum
among the current flow betweenness centralities of the investors in a firm are not
statistically significant. Conversely, eigenvector and closeness centralities of firms
have positive and significant impacts. The impact of the eigenvector centrality
seems to be increasing during the first five years, reaching a “plateau” in the
second half of the domain. These findings reinforce those obtained with the
binary and scalar outcomes previously considered, confirming a role for firms’
centrality in shaping their success.Can you always reap what you sow? 11
4 Discussion
This paper exploits techniques from the fields of network and functional data
analysis. We build a network of investors and firms in the healthcare sector and
characterize its largest communities. Next, we progressively shape the concept of
a firm’s “success” using various definitions, and associate it to different network
features. Our findings show a persistent positive relationship between the impor-
tance of a firm (measured by its centrality in the network) and various (binary,
scalar and functional) definitions of “success”. In particular, we cluster fund-
ing trajectories into a high (“successful”) and a low regime, and find significant
associations between the cluster memberships and firms’ centrality measures.
Then, we switch from this binary outcome to a scalar and then a functional one,
which allow us to confirm and enrich the previous findings. Among centralities
computed on the two network projections, our results suggest a preeminent role
for those computed in the companies’ projection. In particular, both a firm high
closeness centrality, indicating a small shortest distances to other firms, and its
eigenvector centrality, which may account for a firm’s reputation, seem to be
related to the propensity to concentrate capital.
Our analysis can be expanded in several ways. First, we limit our study to the
healthcare sector, while it may be interesting to investigate other fields, or more
healthcare firms based on the availability of more complete records. It would
also be interesting to account for external data (e.g. country, sub-sector, etc.) in
two ways. One the one hand, these information would be useful as to compute
more informative statistics on the network topology. On the other hand, they
may be used in our regression, to control for these factors. Moreover, meso-scale
communities may be analyzed in terms of their longitudinal evolution, as to
characterize “successful” clusters of firms from a topological point of view.
Acknowledgments
F.C., C.E., G.F., A.M. and L.T. acknowledge support from the Sant’Anna School
of Advanced Studies. F.C. acknowledges support from Penn State University.
G.R. acknowledges support from the scheme “INFRAIA-01-2018-2019: Research
and Innovation action”, Grant Agreement n. 871042 “SoBigData++: European
Integrated Infrastructure for Social Mining and Big Data Analytics”.
References
1. Liang, Yuxian E., and Soe-Tsyr D. Yuan. Predicting investor funding behavior using
crunchbase social network features. Internet Research (2016)
2. Bonaventura, M., Ciotti, V., Panzarasa, P. et al.: Predicting success in the worldwide
start-up network. Sci Rep 10, 345 (2020)
3. Bygrave, William D. The structure of the investment networks of venture capital
firms. Journal of Business Venturing 3.2 (1988)
4. Wetzel Jr, William E. The informal venture capital market: Aspects of scale and
market efficiency. Journal of Business venturing 2.4 (1987)12 Esposito, Gortan, Testa et al. 5. Fiet, James O. Reliance upon informants in the venture capital industry. Journal of business venturing 10.3 (1995) 6. CB Insights: https://www.cbinsights.com/ 7. Dushnitsky, Gary, and Michael J. Lenox. When does corporate venture capital in- vestment create firm value? Journal of business venturing 21.6 (2006) 8. Pisano, Gary P.: Science business: The promise, the reality, and the future of biotech. Harvard Business Press, (2006) 9. Booth, Bruce L., and B. Salehizadeh: In defense of life sciences venture investing. Nature biotechnology 29.7 (2011): 579-583 10. Hege, Ulrich and Palomino, Frédéric and Schwienbacher, Armin and others: De- terminants of venture capital performance: Europe and the United States. Working paper, HEC School of Management (2003) 11. Santisteban, José, and David Mauricio: Systematic literature review of critical success factors of information technology startups. Academy of Entrepreneurship Journal 23.2: 1-23 (2017) 12. Hannan, Michael T., and John Freeman: The population ecology of organizations. American journal of sociology 82.5 (1977) 13. Bonacich, P.: Power and centrality: A family of measures. American journal of sociology 92.5 (1987) 14. Zhang, Jian-Xiong, et al. Identifying a set of influential spreaders in complex net- works. Scientific reports 6 (2016) 15. Page, L., et al.: The PageRank citation ranking: Bringing order to the web. Stan- ford InfoLab, (1999) 16. Freeman, Linton C.: Centrality in social networks conceptual clarification. Social networks 1.3 (1978) 17. Estrada, E., and Juan A. Rodriguez-Velazquez: Subgraph centrality in complex networks. Physical Review E 71.5 (2005) 18. Barrat, A., et al.: The architecture of complex weighted networks. Proceedings of the national academy of sciences 101.11 (2004) 19. Newman, Mark EJ.: A measure of betweenness centrality based on random walks Social networks 27.1 (2005) 20. Blondel, V. D., et al.: Fast unfolding of communities in large networks. Journal of statistical mechanics: theory and experiment 2008.10 (2008) 21. Ramsey, J. O. and Silverman, B. W.: Functional Data Analysis. Springer Series in Statistics, New York: Springer Verlag (2005) 22. Jacques, J., and Preda, C.: Functional data clustering: a survey. Advances in Data Analysis and Classification 8.3: 231-255 (2014) 23. Hartigan, J. A. and Wong, M. A.: A K-means clustering algorithm. Applied Statis- tics 28, 100-108 (1979) 24. He, H., and Garcia, E. A.: Learning from imbalanced data. IEEE Transactions on knowledge and data engineering 21.9 1263-1284 (2009) 25. Friedman, J. and Hastie, T. and Tibshirani, R.: The elements of statistical learning. Springer series in statistics, New York (2005) 26. Dosi, G. and Marengo, L.: Some elements of an evolutionary theory of organi- zational competences. Evolutionary concepts in contemporary economics 157-178 (1994) 27. Kokoszka, P. and Reimherr, M.: Introduction to functional data analysis. Chapman and Hall/CRC (2017). doi:10.1201/9781315117416 28. Goldsmith, J. et al.: Refund: Regression with functional data. R package version 0.1-16 (2016)
You can also read