MCLAREN VALE GROUNDWATER RESOURCE ASSESSMENT - PRESCRIBED WE LLS
←
→
Page content transcription
If your browser does not render page correctly, please read the page content below
McLaren Vale Prescribed We lls Area
groundwater resource assessment

Department for Environment and Water

January 2022

DEW Technical note   2022-08

Department for Environment and Water
Government of South Australia
January 2022

81-95 Waymouth St, ADELAIDE SA 5000
Telephone +61 (8) 8463 6946
Facsimile +61 (8) 8463 6999
ABN 36702093234

www.environment.sa.gov.au

Disclaimer
The Department for Environment and Water and its employees do not warrant or make any representation
regarding the use, or results of the use, of the information contained herein as regards to its correctness,
accuracy, reliability, currency or otherwise. The Department for Environment and Water and its employees
expressly disclaims all liability or responsibility to any person using the information or advice. Information
contained in this document is correct at the time of writing.

With the exception of the Piping Shrike emblem, other material or devices protected by Aboriginal rights or a
trademark, and subject to review by the Government of South Australia at all times, the content of this document
is licensed under the Creative Commons Attribution 4.0 Licence. All other rights are reserved.
© Crown in right of the State of South Australia, through the Department for Environment and Water 2022

ISBN 978-1-922027-39-9

Report prepared by:
Steve Barnett
Water Science Unit
Water Science and Monitoring Branch
Water and River Murray Division
Department for Environment and Water

Preferred way to cite this publication
Department for Environment and Water (DEW) 2022. McLaren Vale Prescribed Wells Area groundwater resource
assessment. DEW Technical Note 2022/01, Government of South Australia, Adelaide.

Download this document at https://www.waterconnect.sa.gov.au

DEW Technical Note 2022-08                                                                                         i
Foreword
The Department for Environment and Water (DEW) is responsible for the management of the State’s natural
resources, ranging from policy leadership to on-ground delivery in consultation with government, industry and
communities.

High-quality science and effective monitoring provides the foundation for the successful management of our
environment and natural resources. This is achieved through undertaking appropriate research, investigations,
assessments, monitoring and evaluation.

DEW’s strong partnerships with educational and research institutions, industries, government agencies, Landscape
Boards and the community ensures that there is continual capacity building across the sector, and that the best
skills and expertise are used to inform decision making.

John Schutz CHIEF EXECUTIVE DEPARTMENT FOR ENVIRONMENT AND WATER

DEW Technical Note 2022-08                                                                                      ii
Contents
Foreword                                               ii

1 Introduction 6                                             6
2 Climate                                                    7
3 Hydrostratigraphy                                          8
3 Quaternary aquifer                                        10
      3.1 Extraction and allocation                         10
      3.2 Groundwater flow direction                        11
      3.3 Water level trends                                12
      3.4 Salinity distribution                             12
      3.5 Connection with surface water and/or GDEs         12
      3.6 Sustainability issues                             13
      3.7 Resource capacity                                 13
4 Port Willunga Formation aquifer                           14
      4.1 Extraction and allocation                         15
      4.2 Groundwater flow direction                        16
      4.3 Water level trends                                16
      4.4 Salinity distribution                             19
      4.5 Salinity trends                                   19
      4.6 Connection with surface water and/or GDEs         20
      4.7 Sustainability issues                             20
      4.7.1 Pressure declines                               20
      4.7.2 Depressurisation of the confined aquifer        20
      4.7.3 Sea water intrusion                             21
      4.7.4 Climate change                                  21
      4.8 Resource Condition Limits                         21
      4.9 Resource capacity                                 21
5 Pirramimma Sand aquifer                                   22
      5.1 Extraction and allocation                         22
      5.2 Groundwater flow direction                        24
      5.3 Water level trends                                24
      5.4 Salinity distribution                             25
      5.5 Salinity trends                                   25
      5.6 Connection with surface water and/or GDEs         26
      5.7 Sustainability issues                             26
      5.7.1 Salinity increases                              26
      5.7.2 Watertable declines                             27
      5.7.3 Climate change                                  28
      5.8 Resource capacity                                 28
      5.9 Resource Condition Limits                         29
6 Maslin Sands aquifer                                      30
      6.1 Extraction and allocation                         31
      6.2 Groundwater flow direction                        32

DEW Technical Note 2022-08                                  iii
6.3 Water level trends                           32
      6.4 Salinity distribution                        32
      6.5 Salinity trends                              34
      6.6 Connection with surface water and/or GDEs    34
      6.7 Sustainability issues                        34
      6.7.1 Salinity increases                         34
      6.7.2 Watertable declines                        35
      6.7.3 Depressurisation of the confined aquifer   36
      6.7.4 Sea water intrusion                        36
      6.7.5 Climate change                             36
      6.8 Resource capacity                            37
      6.9 Resource Condition Limits                    37
7 Permian Sands aquifer                                38
      7.1 Resource capacity                            39
      7.1.1 Unconfined Permian Sands                   39
      7.1.2 Confined Permian Sands                     39
8 Fractured Rock aquifer                               40
      8.1 Extraction and allocation                    41
      8.2 Groundwater flow direction                   42
      8.3 Water level trends                           42
      8.4 Salinity distribution                        43
      8.5 Salinity trends                              44
      8.6 Connection with surface water and/or GDEs    44
      8.7 Sustainability issues                        44
      8.7.1 Climate change                             44
      8.8 Resource capacity                            45
      8.8.1 Hills Face Zone                            46
      8.8.2 Bakers Gully Zone                          46
      8.8.3 Northern Zone                              46
9 Summary and recommendations                          47
10 Appendix A                                          47
11 References                                          50

DEW Technical Note 2022-08                             iv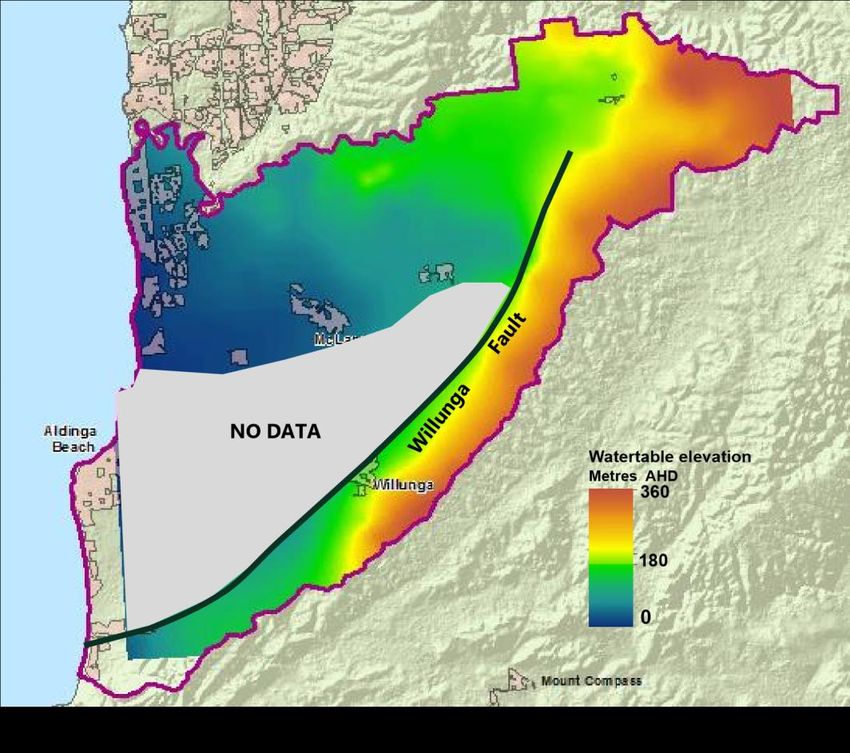
List of figures

Figure 1. Location of the McLaren Vale PWA                                                                               6
Figure 2. Rainfall data from the Willunga rainfall station                                                               7
Figure 3. Geological cross section of the Willunga Embayment                                                             9
Figure 4. Extent of the Quaternary aquifer and location of licenced wells                                                10
Figure 5. Watertable elevation for the Quaternary aquifer                                                                11
Figure 6. Water level hydrographs for the Quaternary aquifer                                                             12
Figure 7. Salinity distribution for the Quaternary aquifer                                                               13
Figure 8. Extent of the PWF aquifer and location of licenced wells                                                       14
Figure 9. Metered extraction from the PWF aquifer                                                                        15
Figure 10. Use vs allocation for the PWF aquifer averaged over 2018-19 and 2019-20                                       15
Figure 11. Selected hydrographs for the PWF aquifer                                                                      16
Figure 12. (a) Potentiometric surface for the PWF aquifer      (b) Head difference between Quaternary and PWF aquifers   17
Figure 13. Salinity distribution for the PWF aquifer in 2021                                                             18
Figure 14. Long term salinity trends for the PWF aquifer                                                                 18
Figure 15. Cross section of the PWF confined aquifer                                                                     19
Figure 16. Extent of the Pirramimma Sand aquifer and location of licenced wells                                          21
Figure 17. Metered extraction from the PS aquifer                                                                        22
Figure 18. Use vs allocation for the PS aquifer averaged over 2018-19 and 2019-20                                        22
Figure 19. Watertable elevation surface for the PS aquifer                                                               23
Figure 20. Selected hydrographs for the PS aquifer                                                                       23
Figure 21. Salinity distribution for the PS aquifer in 2021                                                              24
Figure 22. Long term salinity trends for the PS aquifer                                                                  24
Figure 23. Representative rising salinity trends and extraction in the PS aquifer                                        25
Figure 24. Thickness of the PS aquifer                                                                                   26
Figure 25. Extent of the Maslin Sands aquifer and location of licenced wells                                             28
Figure 26. Metered extraction from the MS aquifer                                                                        29
Figure 27. Use vs allocation for the MS aquifer                                                                          29
Figure 28. Potentiometric surface for the Maslin Sands aquifer                                                           30
Figure 29. Selected hydrographs for the Maslin Sands aquifer                                                             31
Figure 30. Salinity distribution for the MS aquifer in 2021                                                              31
Figure 31. Long term salinity trends for the MS aquifer                                                                  32
Figure 32. Representative rising salinity trends and extraction in the MS aquifer                                        33
Figure 33. Thickness of the MS aquifer                                                                                   34
Figure 34. Extent of the Permian Sands and location of licenced wells                                                    36
Figure 35. Extent of the Fractured Rock aquifer and location of licenced wells                                           38
Figure 36. Metered extraction from the FRA aquifer                                                                       39
Figure 37. Use vs allocation for the FRA aquifer                                                                         39
Figure 38. Potentiometric surface for the FRA                                                                            40
Figure 39. Selected hydrographs for the FRA aquifer                                                                      41
Figure 40. Salinity distribution for the FRA aquifer in 2021                                                             41
Figure 41. Long term salinity trends for the FRA aquifer                                                                 42
Figure 42. Recharge zones for the unconfined FRA aquifer                                                                 43

DEW Technical Note 2022-08                                                                                                    5
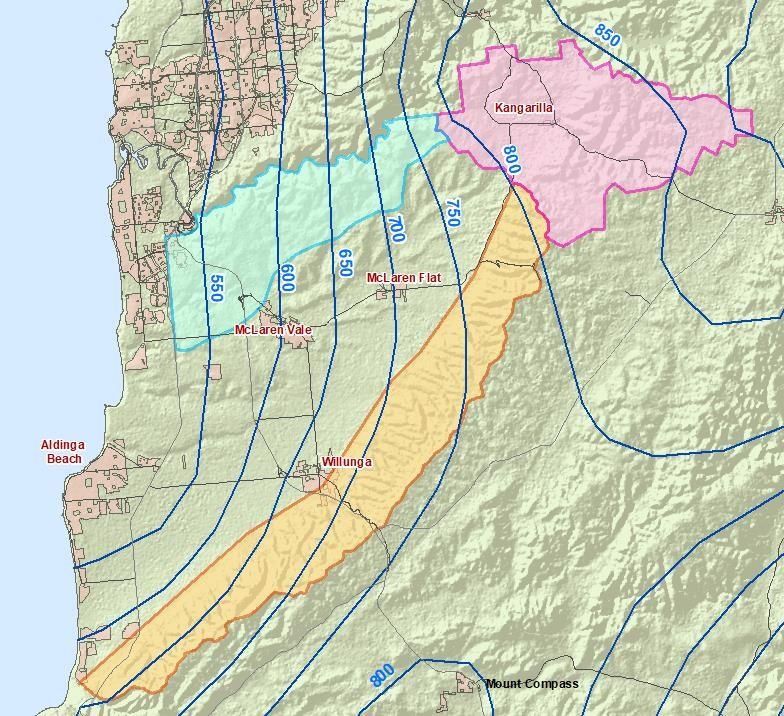
1 Introduction
This technical note presents a hydrogeological assessment of the groundwater level, salinity and extraction trends
In the McLaren Vale Prescribed Wells Area (PWA) and sustainability issues to inform a risk assessment being
carried out for a review of the Water Allocation Plan, which controls groundwater management in the area. It
contains recommendations for consideration in decision-making on management options for the area. These
recommendations are limited to considering whether current extraction can be maintained in the next 10 years
while retaining the character of the resource.

This technical note is additional to and complements the annual technical notes prepared for the same region as
part of DEW’s routine water resource status reporting.

The McLaren Vale PWA covers an area of approximately 320 km2, with the Onkaparinga River forming part of the
northern boundary, while much of the south-eastern boundary follows the ridge of the Sellicks Range (Figure 1).

Figure 1. Location of the McLaren Vale PWA

DEW Technical Note 2022-08                                                                                           6
2 Climate
Rainfall is a very important part of the groundwater balance because it is a source of replenishment or recharge to
aquifers by infiltration through the soil, or by percolation from streamflow in drainage lines. A lack of rainfall
during winter and spring may increase demand for irrigation extraction.

The climate of the McLaren Vale region is characterised by hot, dry summers and cool to cold, wet winters. Rainfall
data is presented for the Bureau of Meteorology station at Willunga (station 23753) where the long term annual
average rainfall is 636 mm.(Figure 2). The cumulative deviation from mean annual rainfall (plotted in orange)
identifies periods where rainfall trends are above or below average. An upward slope indicates a period where the
rainfall is greater than the average, while a downward slope indicates a period where the rainfall is below the
average.

Figure 2. Rainfall data from the Willunga rainfall station

Willunga has experienced an extended period of below average rainfall since 1975, with the exception of wet years
in 1992–93, 2000 and 2016-17. The trendline in Figure 2 shows that the average annual rainfall is declining

Climate change projections carried out by the Goyder Institute (Charles and Fu, 2014) indicated that by 2050, the
Adelaide and Mt Lofty Ranges NRM Region could experience a decrease in average annual rainfall by between
6.3% and 8.4%, and an increase in average annual maximum temperature by between 1.3 and 1.8 oC.

These projections indicate that over the long term, climate change will impact predominately unconfined aquifers
through a reduction in recharge, with those aquifers with limited storage capacity being more vulnerable than
those with large storage. The higher temperatures may increase irrigation demand, however extraction limits and
metering will mitigate this risk.

The projections do not predict that every year between now and 2050 will experience gradually decreasing rainfall.
There will still be climate variability and periods of above average rainfall that will recharge aquifers and reduce
demand for irrigation. It is still not possible to predict which years will be wet or dry which is why an adapative
management approach is best suited for the groundwater resources of the McLaren Vale PWA.

DEW Technical Note 2022-08                                                                                          7
7

 3 Hydrostratigraphy
For a number of years, groundwater was understood to occur in four major aquifers: Quaternary aquifer; Port
Willunga Formation aquifer; Maslin Sands aquifer; Fractured Rock aquifer.
In particular, the Port Willunga Formation aquifer was assumed to comprise not only the Tertiary marine limestone,
but also the Pirramimma Sand Member which was considered to be a marginal sand facies of the Port Willunga
Formation (Cooper, 1977). Consequently, construction of water level contours and interpretation of water level and
salinity trends assumed that these two units had such a very high hydraulic connection that they could be
considered to be one continuous aquifer.

Fairburn (1998) described the Pirramimma Sandstone as an early Pleistocene fluvial sandstone, comprising a
mainly buff coloured, fine-grained, well-sorted and poorly consolidated sandstone up to 50 m thick. Recent
investigations involving the interpretation an additional 300 drillers’ logs and 50 mineral well logs enabled the
aquifer extents and elevation surfaces to be defined with a much greater resolution than could be achieved
previously. This work defined the extent of this extensive sand unit which attains a maximum thickness of over 110
m near the Willunga Fault and concluded that it had a pre-Pliocene age (Barnett and Bourman, 2021). Due to the
obvious differences in geological age, lithology and water level monitoring trends, the Pirramimma Sand should
be considered to be a separate aquifer from the Port Willunga Formation limestone.

The new stratigraphic data was used to construct Figure 3 which presents a cross section through the Willunga
Embayment. It is recommended the following hydrostratigraphic units be used for management into the future;

Quaternary aquifer
Sands and interbedded clays form shallow unconfined aquifers which are generally low yielding and provide
mostly stock and domestic supplies, with limited extraction for irrigation. Recharge is predominantly derived from
local rainfall and infiltration of runoff provided by streams.

Port Willunga Formation aquifer
The Port Willunga Formation aquifer consists of Tertiary marine limestones and is confined by Quaternary
sediments over its full extent in the south-western part of the basin. This aquifer recharge by downward leakage
from the Quaternary aquifer and possibly lateral flow across the Willunga Fault from the fractured rock aquifer.

Pirramimma Sands aquifer
This aquifer comprises a fine-grained poorly consolidated sand which forms an unconfined aquifer extending over
the central and north-eastern portions of the basin. It is recharged by rainfall and possibly lateral flow across the
Willunga Fault from the fractured rock aquifer.

Maslin Sands aquifer
The Maslin Sands aquifer directly overlies basement rocks and comprises fine to coarse sands and clays. The
aquifer is recharged by rainfall in the north-east of the PWA where it crops out. Elsewhere, the aquifer is confined
and separated from the overlying Port Willunga Formation Aquifer by the Blanche Point Formation aquitard which
consists of low-permeability marine mudstone and limestone.

Permian Sand aquifer
Isolated occurrences of Permian Sands occur near the northeastern and northwestern boundaries of the PWA
which are recharged from rainfall.

Fractured Rock aquifers
Fractured Rock aquifers occur in basement rocks (slates, quartzites, shales and limestone) which form ranges to the
east of the Willunga Fault and also along the Onkaparinga Gorge to the north. Infiltration of rainfall provides
recharge to the aquifer in these areas.

DEW Technical Note 2022-08                                                                                           8

5 km

    0

    -100

                                                                                   Kangarilla
    -200

                                                               McLaren Vale
    -300

                                                                        Willunga

Figure 3. Geological cross section of the Willunga Embayment

DEW Technical Note 2022-08                                                                      9
3 Quaternary aquifer Analysis of drillers’ logs and the creation of the 3D aquifer surfaces has enabled all wells which are completed in the Quaternary aquifer to be determined. This has allowed much more information on the watertable elevation and salinity to be consolidated than has previously been available, and enabled a better delineation of the extent of the aquifer which is presented in Figure 4. Also shown are the locations of licenced wells (in yellow) and the observation wells whose hydrographs are presented later in Figure 6. Figure 4. Extent of the Quaternary aquifer and location of licenced wells 3.1 Extraction and allocation There are currently only six licences utilizing the Quaternary aquifer because of the predominantly low yields. They extract a total of about 6.5 ML/year from a total allocation of 10.8 ML. DEW Technical Note 2022-08 10
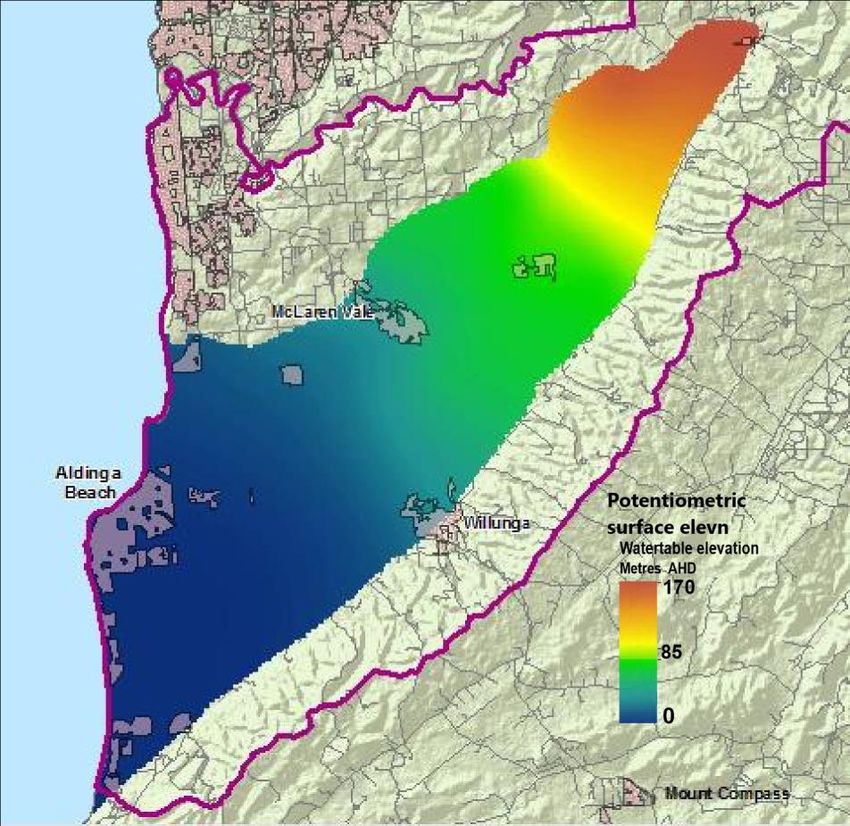
3.2    Groundwater flow direction
The watertable elevation map (Figure 5) is constructed using water levels from about 150 wells. Although these
levels were measured at different times, a broad regional trend is clearly visible. The highest elevations occur
adjacent to the Willunga Scarp to the east indicating recharge from streamflow and possibly lateral flow from the
fractured rock aquifer. Groundwater flow is generally to the northwest and west following the direction of surface
drainage and declining topography. This flow direction is quite different to that in the underlying aquifers which is
generally in a southwest direction.

                                                             Legend
                                                               Legend
                                                                       Quaternary wells
                                                                       Quaternary RSWL wells

                                                                                    DrainagePrimary road

                                                             Primary RoadDrainage
                                                                             TownshipsTowns
                                                                       Watertable elevation
                                                                                     100

                                                                                      50

                                                                       Metres AHD     0

Figure 5. Watertable elevation for the Quaternary aquifer

DEW Technical Note 2022-08                                                                                        11
The significant feature of the watertable in the Quaternary aquifer is that it is at a higher elevation compared to underlying Port Willunga Formation or Pirramimma Sand aquifer water levels, resulting in widespread potential for downward leakage from the Quaternary aquifer 3.3 Water level trends Regular water level monitoring is carried out in several Quaternary aquifer observation wells with a selection presented in Figure 6 (locations of these wells in Figure 4). The seasonal fluctuations indicate that recharge is occurring with a reasonably close relationship with observed rainfall patterns. There has been a long term decline of about 2 – 3 m since 2000. Figure 6. Water level hydrographs for the Quaternary aquifer 3.4 Salinity distribution Figure 6 shows the salinity of the Quaternary aquifer derived from all records from 167 wells. Broad trends can be observed (noting that about 45 % of the samples were tested before 1970). Lower salinities are associated with streams flowing out onto the plain from the Willunga Scarp which suggest that recharge has been occurring from these streams. Salinities are significantly higher near the coast which probably reflects the influence of evaporative discharge from the watertable that is closer to the ground surface than further to the northeast. Salinities are also possibly higher in areas some distance from drainage lines than Figure 6 suggests, but there is little data to confirm this. There is no regular monitoring of Quaternary aquifer salinities. 3.5 Connection with surface water and/or GDEs As Quaternary sediments occur at the land surface and in drainage lines, this aquifer is likely to have high connectivity with surface water and is likely to support GDEs in some locations. DEW Technical Note 2022-08 12
3.6        Sustainability issues
Ther has been a an overall decline in groundwater levels refectiing the declining rainfall trends notably duringthe
latter period of the millennium drought (2005-2010) otherwise levels have been relatively stable. At the current
level of total extractions in the order of 6.5 ML/year, there are no significant resource sustainability issues. due to
groundwater extraction.

3.7       Resource capacity
No extraction limit has been set previously for the Quaternary aquifer. The only investigation into recharge to the
Quaternary aquifers occurred at Pedlar Creek just to the northeast of McLaren Vale (Harrington, 2002). This is not
representative of the main part of the aquifer which is recharged by intermittent streams flowing out from the
Willunga Scarp. Due to the low demand, a conservative ‘fit for purpose’ limit of 50 ML/year could be applied.

                                                                      Legend
                                                                            Primary road

                                                                            Drainage

                                                                            Quaternary wells

                                                                            Towns
                                                                      TDS (mg/L)
                                                                            0 - 1,000

                                                                            1 ,000 - 1,500

                                                                            1 ,500 - 2,000

                                                                            2 ,000 - 3,000

                                                                            3 ,000 - 5,000

                                                                            5 ,000 - 10,000

                                                                            10 ,000 - 15,000

Figure 7. Salinity distribution for the Quaternary aquifer

DEW Technical Note 2022-08                                                                                           13
4 Port Willunga Formation aquifer The Port Willunga Formation (PWF) aquifer consists of Tertiary marine limestones and excludes any sand aquifer which is now interpreted to be included in the Pirramimma Sands aquifer. It only occurs in the south-western part of the basin and is confined by Quaternary sediments over its full extent. The aquifer reaches a maximum thickness of about 150 m near the coast. Figure 8 presents the extent of the PWF aquifer, together with the licenced wells (in yellow) and the observation wells whose hydrographs are presented in Figure 11. Figure 8. Extent of the PWF aquifer and location of licenced wells DEW Technical Note 2022-08 14
4.1       Extraction and allocation
Figure 9 shows that metered extraction from the PWF aquifer since 1996-97 has been fairly consistent and below
1,500 ML/year, with seasonal variations caused by variations in rainfall. It is close to the 2020 allocation volume of
1,683 ML. The metered extraction as a percentage of the individual licenced allocations averaged over the last two
years (2018-20 and 2019-20) is presented in Figure 10 and shows a very high degree of development of the
allocations which reflects the high demand and high value of the irrigated produce,. It also suggests that there is
limited potential for significant increases in extraction due to the activation of unused allocations.

Figure 9. Metered extraction from the PWF aquifer

Figure 10. Use vs allocation for the PWF aquifer averaged over 2018-19 and 2019-20

DEW Technical Note 2022-08                                                                                         15
4.2 Groundwater flow direction
Figure 12a presents the potentiometric surface for the PWF aquifer showing groundwater flow toward the coast in
a southwesterly direction. The flattening of the gradient in the southwestern half of the aquifer corresponds to a
significant thickening of the aquifer and the resultant increase in transmissivity.

4.3       Water level trends
Water level monitoring has been carried out since the late 1980s. Long term trends from 1988 to 2020 show a
gradual decline varying up to 0.15 m/year at the furthest extent inland (WLG 69). Figure 11 shows the pressure
levels trends for WLG 69, WLG 102 and WLG 139 which show a close correlation with rainfall trends. The trend in
total extraction volumes for the PWF aquifer shown in Figure 9 is reasonably stable after 2002 and consequently,
the decline in pressure levels since then cannot be correlated with extraction from the aquifer (as this has not
increased).

Figure 11. Selected hydrographs for the PWF aquifer

Although it is expected that the Quarternary unconfined aquifer would have a close relationship with rainfall (as
shown in Figure 6), it is unusual for a confined aquifer pressure levels to have a similar trend. Figure 12b depicts
the significant head difference between the Quaternary aquifer and the PWF aquifer of up to 60 m driving
downward leakage from the Quaternary Aquifer. A good connectivity between the two aquifers could cause the
similar trends with hydrostatic loading probably also contributing to this similarity.

The PWF aquifer averages about 100 m in thickness with a conservative estimate of groundwater storage volumes
in the order of 440,000 ML (the elastic storage due to pressurization of the aquifer has been ignored). The current
extraction which averages 1,400 ML/year represents only a very small percentage of this storage, however most of
this storage volume is not considered useable because of high salinities (Figure 13) and the adverse impacts that
could occur if significant increases in extraction occurred.

DEW Technical Note 2022-08                                                                                             16
Figure 12. (a) Potentiometric surface for the PWF aquifer   (b) Head difference between Quaternary and PWF aquifers

DEW Technical Note 2022-08                                                                                            17
17

DEW Technical Note 2022-08   18
4.4       Salinity distribution
Figure 13 shows the extent of the PWF aquifer and the salinity distribution following the 2021 sampling program.
Most of the irrigation wells have salinities below 1200 mg/L, with values increasing toward the coast.

Figure 13. Salinity distribution for the PWF aquifer in 2021

4.5       Salinity trends

Figure 14. Long term salinity trends for the PWF aquifer

DEW Technical Note 2022-08                                                                                     19
Figure 14 shows long term trends from four representative irrigation wells (locations shown in Fig. 13) which are
generally stable, or showing slightly declining trends, apart from the well showing a slight rising trend which is
located in a higher salinity zone of the PWF aquifer. There appears to be a relationship with rainfall, as shown by
the decline in salinity coinciding with higher rainfall between 1998 and 2006, and the increase in salinity during the
millennium drought.

4.6 Connection with surface water and/or GDEs
Because the PWF aquifer is confined and overlain by Quaternary sediments, it has no connection with surface
water and does not support any GDEs within the PWA

4.7       Sustainability issues

      4.7.1    Pressure declines
There has been a gradual decline in pressure levels over the last 15 years or.. The decline is attributed
predominantly to be driven by rainfall trends rather than extraction.. Overall, the decline has not resulted in
adverse salinity trends and as the simple cross section from to the coast to the landward extent of the PWF aquifer
in Figure 15 shows, the pressure levels are still 10-15 m above the top of the confined PWF limestone aquifer
which remains fully saturated.

Figure 15. Cross section of the PWF confined aquifer

      4.7.2     Depressurisation of the confined aquifer
In other PWAs in South Australia, maintaining pressurization within the confined aquifers (i.e. not allowing the
confined aquifer to become unconfined), has been a management objective. This process of depressurisation
reduces the hydrostatic pressure supporting the confining layer on top of the confined aquifer against the weight
of the overlying unconfined aquifer and the groundwater contained within it. This could result in fracturing of the
confining layer and downward leakage from the overlying unconfined aquifer into the confined aquifer.

However in this case, there is no discrete confining layer separating the PWF aquifer from an overlying Quaternary
unconfined aquifer and there already appears to be good connectivity with this aquifer. If the observed declining

DEW Technical Note 2022-08                                                                                         20
trend was to continue at the current rate, depressurization of the aquifer would only occur after 50+ years. Even if
this did occur, there may be no adverse impacts on the resource.
4.7.3 Sea water intrusion
The risk of sea water intrusion (SWI) is a sustainability issue for this resource. Investigations by the National Centre
for Groundwater Research and Training (NCGRT) found that quantification of groundwater flow at the interface
was difficult because of variable density effects and tidal effects (Post et al, 2018). There was net seaward
horizontal flow in the upper part of the PWF aquifer (from where extraction occurs) in a transect near Aldinga
Beach during the period analysed. There was no evidence of active sea water intrusion.
The risk is considered low due to distance of most irrigation extraction from the coast and no sign of cones of
depression in pressure level contours that csould lead to a flow reversal from seaward to landward. It is essential
to maintain a net positive pressure gradient and throughflow (seaward horizontal flow) towards the coast to
miniiminise rhe risk
4.7.4 Climate change
As the pressure level trends show a relationship with rainfall, the PWF aquifer could be considered sensitive to
climate change. The gradually declining pressure levels that would result from a drying climate would not result in
the aquifer being classified as vulnerable to climate change over the the next 50 years because of the large
storage capacity and robustness of the resource.
4.8 Resource Condition Limits
In other confined aquifers in SA, the RCL of maintaining pressurization within the aquifer (i.e. not allowing it to
become unconfined), has been chosen. However in this case, there is no discrete confining layer separating the
PWF aquifer from an overlying unconfined aquifer and there already appears to be good connectivity with the
Quaternary aquifer.
Nevertheless, a RCL of maintaining pressurization is recommended as a precautionary approach to maintain
confined aquifer conditions in the PWF. An additional RCL to maintain a positive pressure gradient toward the
coast over the long term to prevent salt water intrusion is also recommended. This RCL will have the additional
benefit of maintaining groundwater discharge to culturally sensitive springs along the coast related to the
Tjilbruke Dreaming (Crane, 2017).
4.9 Resource capacity
No extraction limit has been previously set specifically for the PWF aquifer. Examination of aerial photography
reveals that virtually all the area of irrigation quality groundwater has already been planted with vineyards.
Given the sustainability isues, the observed monitoring trends and that extraction has been stable for the last
decade, the 2020 level of allocation (1,683 ML) wou;ld be sustainable for the term of the water allocation plan with
no new allocations granted for the PWF aquifer.
DEW Technical Note 2022-08 215 Pirramimma Sand aquifer This sand aquifer was previously considered to be part of the PWF aquifer. The Pirramimma Sand (PS) aquifer extends over most of the central portion of the Willunga Basin and reaches a maximum thickness of about 80 m. It is mostly unconfined. Figure 16 presents the extent of the PS aquifer as well as the licenced wells (in yellow) and the observation wells whose hydrographs are presented in Figure 16. Figure 16. Extent of the Pirramimma Sand aquifer and location of licenced wells 5.1 Extraction and allocation Figure 17 shows that metered extraction from the PS aquifer since 2004-05 has been fairly consistent and below DEW Technical Note 2022-08 22
1,750 ML/year, with seasonal variations caused by variations in rainfall. It is close to the 2020 allocation volume of
1,850 ML. The metered extraction as a percentage of the individual licenced allocations averaged over the last two
years (2018-19 and 2019-20) is presented in Figure 18 and shows a very high degree of development of the
allocations, which may reflect the high value of the irrigated produce. It also suggests that there is limited
potential for significant increases in extraction due to the activation of unused allocations.

Figure 17. Metered extraction from the PS aquifer

Figure 18. Use vs allocation for the PS aquifer averaged over 2018-19 and 2019-20

DEW Technical Note 2022-08                                                                                         23
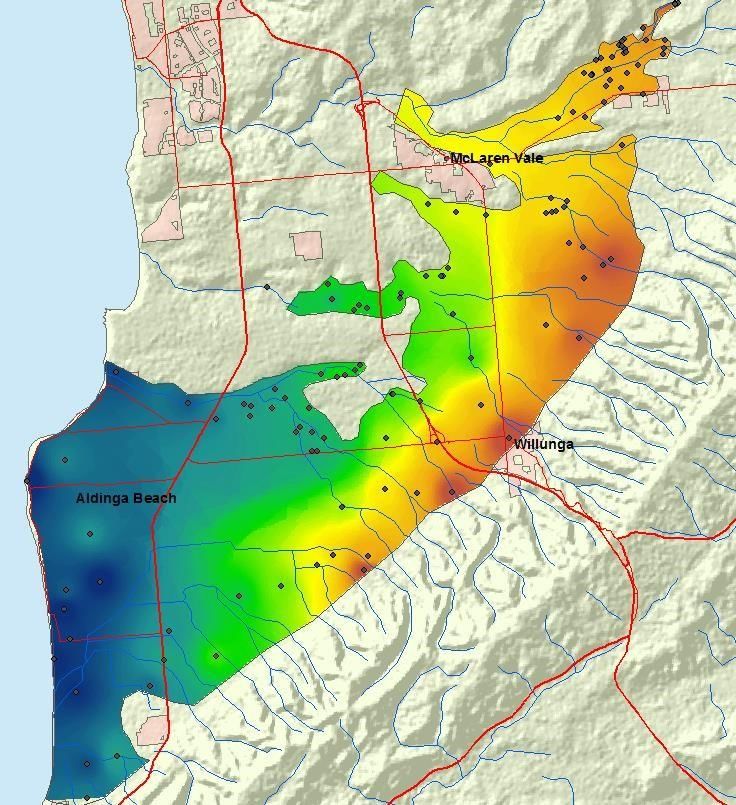
5.2    Groundwater flow direction
Figure 19 presents the potentiometric surface for the PS aquifer showing groundwater flow towards the coast in a
southwesterly direction.

Figure 19. Watertable elevation surface for the PS aquifer

5.3       Water level trends
Water level monitoring has been carried out since the late 1980s. Long term trends from 1988 to 2020 show a
gradual decline varying from 0.07 to 0.15 m/year as shown in Figure 20. There appears to be a very muted
relationship with rainfall patterns which is most likely due to the due to the depth to the watertable which is
mostly over 20 m, and the presence of overlying Quaternary clays in some areas.

DEW Technical Note 2022-08                                                                                        24
Figure 20. Selected hydrographs for the PS aquifer

5.4    Salinity distribution
Figure 21 shows the extent of the PS aquifer and the salinity distribution following the 2021 sampling program.
The aquifer can be divided into two parts. To the southwest of McLaren Flat, salinities are generally below 1,000
mg/L. To the east, salinities range up to 1,750 mg/L which is well above the tolerance level for wine grapes. The
location of observation wells featured in Figure 22 are also shown.

Figure 21. Salinity distribution for the PS aquifer in 2021

5.5 Salinity trends
Long term trends are presented in Figure 22 for four representative irrigation wells (locations shown in Figure 21,
which indicate that trends in the lower salinity zone to the southwest of McLaren Flat are relatively stable, while
those to the east are rising significantly.

DEW Technical Note 2022-08                                                                                          25
Figure 22. Long term salinity trends for the PS aquifer

5.6     Connection with surface water and/or GDEs
Over most of the extent of the PS aquifer, the depth to the watertable is over 20 m. The only area where possible
connection with surface water and GDEs occurs is along the northern boundary of the aquifer in the vicinity of
Pedlar Creek (Figure 16).

5.7       Sustainability issues

       5.7.1   Salinity increases
The most immediate sustainability issue is the rise in salinity to the east of McLaren Flat. Barnett and Judd, 2019
attributed the cause of the increase to be upward leakage from the underlying Blanche Point Marls (BPM)
aquitard, which was driven by long term increases in extraction and the local drawdowns associated with pumping
from individual irrigation wells. Salinities in the BPM aquitard appear to be in the range 1500 – 2000 mg/L, which
provides an upper limit for potential salinity rises due to this upward leakage.

Figure 23 shows salinity trends in representative irrigation wells in two areas within the PS salinity stress zone.
Wells in Area A display a significant rise in salinity levels during the 1990s and early 2000s to over 1500 mg/L,
however these have stabilized after 2009. This is due to a decline in extraction and the fact that salinities in the
BPM are not too much higher than those in the PS aquifer.

Wells in Area B are showing a different response. Because extraction levels were initially lower than in Area A, the
salinity levels showed very little increase prior to 2009. However, as the extractions have increased after 2009, the
salinity levels have also started to rise.

DEW Technical Note 2022-08                                                                                             26
A
B
Salinity tolerance for wine grapes
Figure 23. Representative rising salinity trends and extraction in the PS aquifer
To a certain extent, Figure 23 indicates that this sustainability issue in Area A could be self-managing – as salinity
levels rose above the salinity tolerance for wine grapes (nominally 1500 mg/L), irrigators reduced groundwater
extraction and may have reverted to alternative water sources (such as recycled effluent). This reduction in
pumping from individal wells has led to the stabilised salinity levels. This scenario does not apply to Area B where
salinity levels are still generally quite suitable for vineyard irrigation despite recent increases. However, based on
observed salinity trends at current levels of extraction, salinities are expected to increase further.
The high degree of development of allocations indicated in Figure 18 suggests that a reduction in allocations
within the areas of rising salinities could result in lower extraction volumes that will stabilize salinity levels as
shown in Area A and limit future increases in extraction that may occur if salinities reduce to more useable levels.
5.7.2 Watertable declines
There has been a gradual decline in watertable levels over the last 15 years. As with the PWF aquifer, this decline is
predominantly driven by rainfall trends and not significantly by extraction. The decline has not resulted in adverse
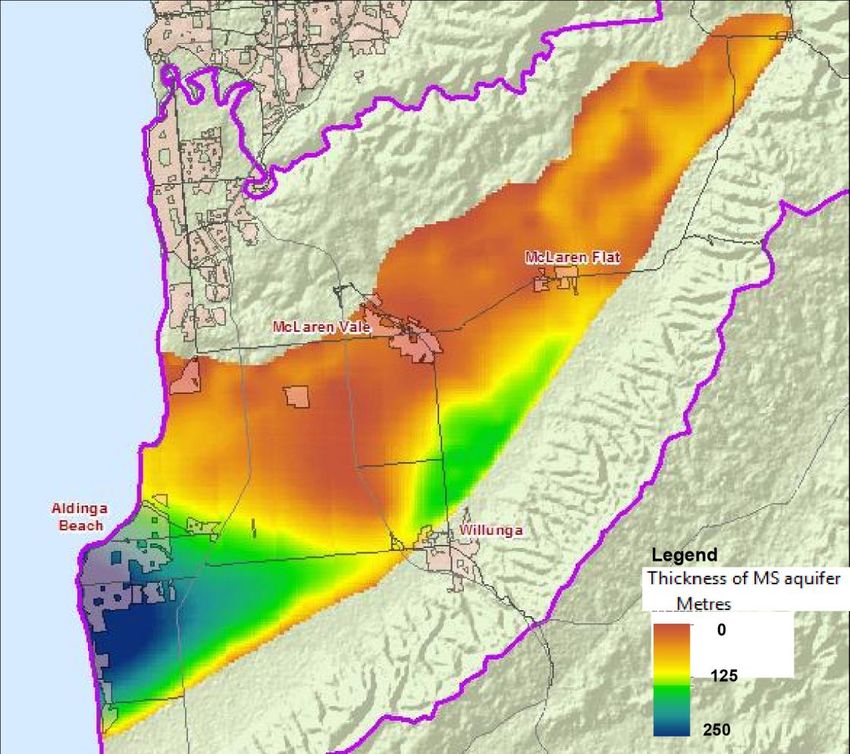
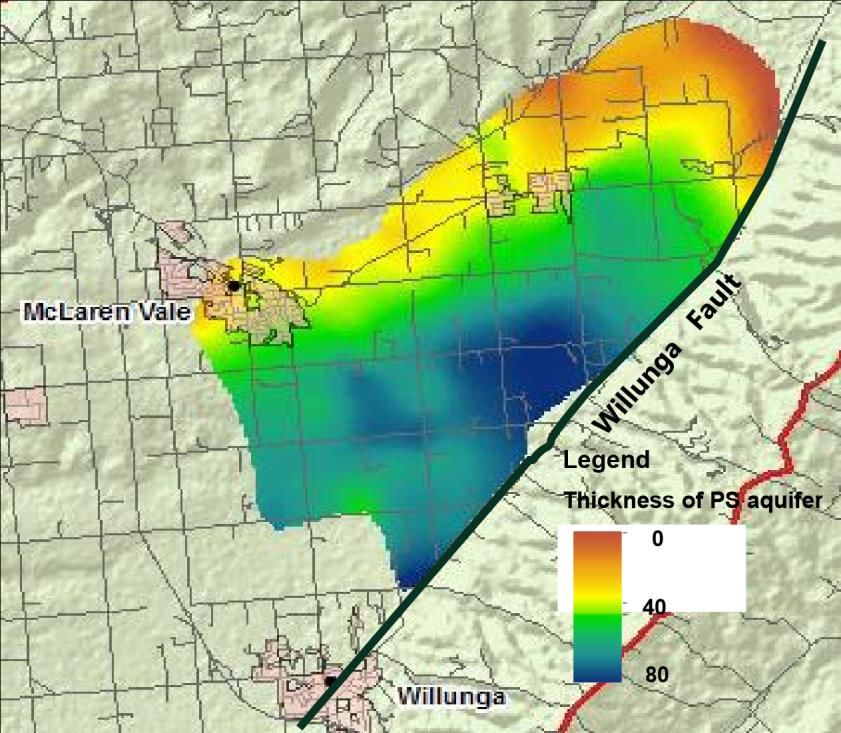
salinity trends regionally. Figure 24 shows the thickness of the PS aquifer which ranges up to 80 m adjacent to the
Willunga Fault.
DEW Technical Note 2022-08 27Figure 24. Thickness of the PS aquifer Figure 24 also provides an explanation of why the upward leakage responsible for the salinity increases is located east of McLaren Flat. This is where the aquifer is thinnest and underlying BPM aquitard is closest to the bottom of the irrigation wells. By assuming a conservative porosity value of 0.05 (to allow for clayey or silty layers within the aquifer), the total volume of water stored in the aquifer has been calculated at 80,000 ML. The hydrographs in Figure 19 show a long term decline of about 4 m since 1993, which represents a net loss of storage of about 7,000 ML or 9 % of the total. It can be concluded that over most of the extent of the aquifer, water level declines will not be an important sustainability issue during the term of the WAP due to the capacity of the resource. Recharge trends will influence the longer term capacity of the resource as discussed under climate change. The area of highest risk to aquifer productivity from watertable decline is in the northeast where the aquifer is thinnest.A reduction in extraction in this area to address salinity increases will also help mitigate the risk from watertable decline. 5.7.3 Climate change Because the water level trends show a muted relationship with rainfall, the PS aquifer could be considered sensitive to climate change. However as discussed above, the one area that could be classified as vulnerable to gradually declining water levels resulting from a drying climate would be in the northeast.. The remainder of the aquifer should not be considered vulnerable over the next 20 years or so because of the robustness (capacity) of the resource. 5.8 Resource capacity No extraction limit has been previously set specifically for the PS aquifer. Examination of aerial photography reveals that virtually all the area of irrigation quality groundwater has already been planted with vineyards. Considering the observed monitoring trends outside of the area of PS salinity increase and that extraction has been stable for the last decade, it is recommended that no new allocations be issued for the PS aquifer in this area and the sustainable extraction limit be set at the current level of allocation (1,600 ML). Within the area of PS DEW Technical Note 2022-08 28
salinity increases, allocation reductions are strongly recommended to reduce extractions in order to reduce further
salinity increases due to upward leakage and mitigate the risk declining water levels.

5.9       Resource Condition Limits
RCLs are not recommended for this aquifer. Management actions have been recommended to deal with observed
salinity increases. Water level declines have been very gradual so far and if continued, the resource will be able to
sustain the current level of extraction for several decades.

DEW Technical Note 2022-08                                                                                        29
6 Maslin Sands aquifer
The Maslin Sands aquifer consists of interbedded thick sand layers and clay layers which are carbonaceous in
places. It extends over most of the PWA and unconfined in the higher topography to the north and east where it
crops out. Elsewhere, the aquifer deepens to the southwest and is confined by the Blanche Point Formation
aquitard.

Figure 25 presents the extent of the unconfined and confined portions of the Maslin Sands (MS) aquifer. Also
shown are the licenced wells (in yellow) and the location of observation wells whose hydrographs are presented in
Figure 28.

                                                   Unconfined MS
                                                   FRAFRA

                                     Blewett Springs
                                     FRAFRA

Figure 25. Extent of the Maslin Sands aquifer and location of licenced wells

DEW Technical Note 2022-08                                                                                    30
6.1 Extraction and allocation Figure 26 shows that metered extraction from the Maslin Sands aquifer since 2004-05 has been fairly consistent and mostly below 1,000 ML/year, with seasonal variations caused by changes in rainfall. It is generally well below the 2020 allocation volume of 1,278 ML. The metered extraction as a percentage of the individual licenced allocations averaged over the last two years is presented in Figure 26 and similar to the aquifers discussed previously, shows a very high degree of development of the allocations. There is limited potential for significant increases in extraction due to the activation of unused allocations. Figure 26. Metered extraction from the MS aquifer Figure 27. Use vs allocation for the MS aquifer DEW Technical Note 2022-08 31
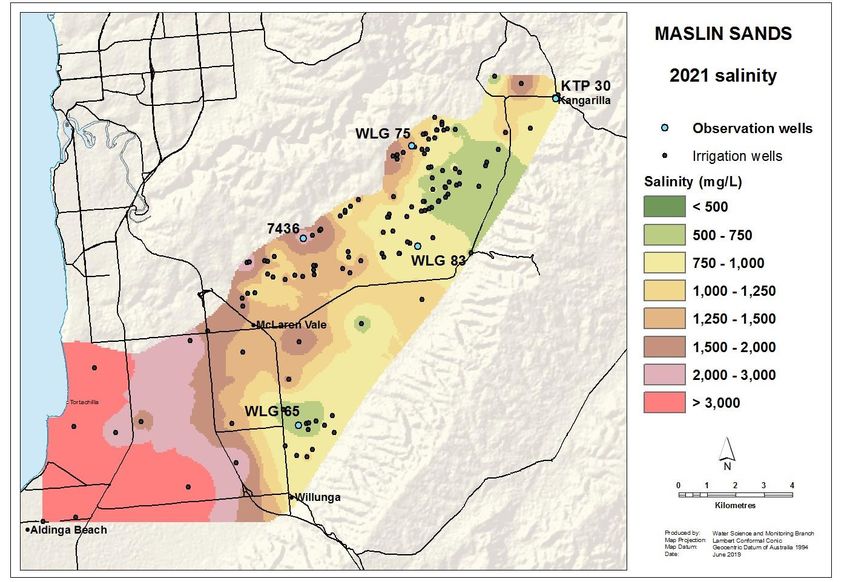
6.2       Groundwater flow direction
As with the other aquifers, the potentiometric surface for the MS aquifer presented in Figure 28 shows
groundwater flow toward the coast in a southwesterly direction.

Figure 28. Potentiometric surface for the Maslin Sands aquifer

6.3       Water level trends
Water level monitoring has been carried out since the late 1980s. Figure 29 presents the long term trends which
appear to have a very muted relationship with rainfall patterns. Wells in the northern unconfined portion of the
aquifer (WLG 63, 94 and KTP 30) show a gradual decline since 2005 varying from 0.04 to 0.07 m/year, mainly
driven by periods of below average rainfall (Well WLG 63 plotted in red refers to the right axis). Further to the
southwest, pressure levels in the confined portion of the aquifer have been gradual declining since 1990 at rates
varying from 0.05 to 0.10 m/year (WLG 44, 93).

6.4 Salinity distribution
Figure 30 shows the extent of the MS aquifer and the salinity distribution following the 2021 sampling program.
The aquifer can be divided into two parts. To the southeast toward the Willunga Fault, salinities are generally
below 1,000 mg/L. Toward the northern extent of the aquifer, salinities range up to 2,000 mg/L, which is well
above the tolerance level for the irrigation of wine grapes (nominally 1500 mg/L). Near the coast to the southwest,
salinity levels exceed 40,000 mg/L.

DEW Technical Note 2022-08                                                                                      32
Figure 29. Selected hydrographs for the Maslin Sands aquifer

Figure 30. Salinity distribution for the MS aquifer in 2021

DEW Technical Note 2022-08                                     33
6.5       Salinity trends
Figure 31 shows long term trends from five representative irrigation wells (locations shown in Figure 29) which
indicate that trends are relatively stable, Along the northern margin of the aquifer, salinity levels are rising
significantly where the MS aquifer is thinning against rising basement.

Figure 31. Long term salinity trends for the MS aquifer

6.6 Connection with surface water and/or GDEs
The only area where the potential exists for interaction with GDEs or surface water is in the unconfined portion of
the aquifer in the northeast of the PWA. Even in this area, the depths to the watertable are generally over 20 m
because of the hilly terrain. However there are two exceptions where the watertable is close to the surface; near
Blewett Springs (Figure 25) and the low lying area to the northwest of Kangarilla.

6.7       Sustainability issues

       6.7.1   Salinity increases
The most immediate sustainability issue for the MS aquifer is the rise in salinity levels along the northern margin
to the northwest of McLaren Flat. Barnett and Judd (2019) attributed the cause of the increase to be upward
leakage from the underlying fractured rock aquifer, which was similarly driven by long term increases in extraction
and the local drawdowns associated with pumping from individual irrigation wells. The salinities in the FRA range
up to 6000 mg/L. These salinities are much higher than those in the BPM aquitard which are contributing to
salinity rises in the PS aquifer, resulting in ongoing rising trends in the MS aquifer with no sign of stabilization in
some wells.

Figure 32 shows salinity trends in representative irrigation wells within two areas where MS salinities are
increasing. Wells in Area A display a significant rise in salinity levels commencing during the mid 2000s to over
1500 mg/L in response to increasing extraction. Despite a decline in extraction due to the high salinities, the trend
shows no sign of stabilisation. Wells in Area B also displayed a rising trend commencing during the mid 2000s, but
because extraction levels have been declining gradually, the salinity levels appear to have stabilised.

DEW Technical Note 2022-08                                                                                          34
B
A
Figure 32. Representative rising salinity trends and extraction in the MS aquifer
As with the PS aquifer, a reduction in extraction within the areas of MS salinity increase would stabilize salinity
levels. The high degree of development of allocations indicated in Figure 27 suggests that a reduction in
allocations within the areas of MS salinity increase could result in lower extraction volumes `and prevent future
increases in extraction that may occur if salinities reduce to useable levels.
6.7.2 Watertable declines
The gradual decline in watertable levels over the last 15 years also is predominantly driven by rainfall trends and
not significantly by extraction. The decline has not resulted in adverse salinity trends regionally. Figure 33 shows
the thickness of the MS aquifer which ranges up to 250 m at the coast.
By assuming a conservative porosity value of 0.05 (to allow for clayey or silty layers within the aquifer), the total
volume of water stored in the aquifer has been conservatively calculated at 435,000 ML (the elastic storage due to
pressurization of the aquifer where it is confined, has been ignored). The unconfined portion of the aquifer to the
north encompasses only about 10 % of the aquifer extent (20 km2) and volume (40,000 ML). The unconfined
hydrographs in Figure 29 show a long term decline averaging about 2 m since 1993, which represents a loss of
storage of about 2,000 ML or 5 % of the total.
The area of highest risk to aquifer productivity from watertable decline is along the northern boundary where the
unconfined portion of the aquifer is thinnest. Reduction in extraction to address salinity increases will also help
mitigate the risk from watertable decline.
DEW Technical Note 2022-08 35Figure 33. Thickness of the MS aquifer
6.7.3 Depressurisation of the confined aquifer
As discussed earlier, depressurization of a confined aquifer may compromise the structural integrity of the
confining layer. However this risk is considered negligible because the Blanche Point Marl confining layer averages
about 30 m in thickness and pressure declines of 50 m would be required for depressurization of the MS confined
aquifer to occur because of its depth (Figure 2). The observed gradual declines pressure levels in Figure 29 range
up to 4 m since 1990 and do not present a risk to the resource for the forseeable future.
6.7.4 Sea water intrusion
Another sustainability issue is the risk of sea water intrusion (SWI). Investigations by the National Centre for
Groundwater Research and Training (NCGRT) have found naturally occurring saline groundwater over 40,000 mg/L
in the MS aquifer near the coast but no evidence of active sea water intrusion. The risk of SWI is considered low
due to the large distance of most irrigation extraction from the coast and no sign of cones of depression in
pressure level contours that could lead to a flow reversal from seaward to landward.
6.7.5 Climate change
Because both the pressure and watertable level trends show a muted relationship with rainfall, the MS aquifer
could be considered sensitive to climate change. However as discussed above, the gradually declining pressure
DEW Technical Note 2022-08 36levels that would result from a drying climate would not result in the aquifer being classified as vulnerable to climate change over the term of the WAP because of the robustness or capacity of the resource. The area that could be classified as vulnerable to gradually declining watertable levels resulting from a drying climate would be along the northern margin. 6.8 Resource capacity No extraction limit has been previously set specifically for the MS aquifer. Given the observed monitoring trends and that extraction has been stable for the last decade, a an extraction limit in the northeast of the PWA where most extractions occur (outside of the areas of salinity rises), set at the current level of allocation (1,138 ML) would be sustainable.with no new allocations ssued in this area. In the deeper confined parts of the aquifer to the southwest of the PWA, additional extraction could occur with minimal risk to the resource. 6.9 Resource Condition Limits In other confined aquifers in SA, an RCL of maintaining pressurization within the aquifer (i.e. not allowing it to become unconfined), has been chosen. However in this case, because of the negligible risk of depressurization occurring due to the depth of the aquifer (Section 6.7.3), applying this RCL is not recommended. With regards to the prevention of SWI, maintaining a positive gradient toward the coast over the long term is essential. DEW Technical Note 2022-08 37
7 Permian Sands aquifer
The Permian Sands aquifer occurs in two isolated locations within the PWA. The northeastern corner of the PWA
contains a small area of outcropping unconfined Permian Sands which extends further to the south toward Kuitpo
Forest. In addition, to the northwest of the PWA near the settlement of Maslins Beach, investigation drilling for
construction sand resources has defined a confined Permian Sands aquifer underlying the Maslin Sands aquifer.

Figure 34 presents the extent of the two occurrences of Permian Sand. There are two licenced wells in the
Confined Permian which extract about 160 ML/yr for industrial purposes. There is no licenced extraction from the
Unconfined Permian.

There are no monitoring wells completed in the Permian Sands aquifer, but due to the low extraction, there are
expected to be no sustainability issues.

                                                                 Unconfined Permian
                                                                 FRAFRA

              Confined Permian
              FRAFRA

Figure 34. Extent of the Permian Sands and location of licenced wells

DEW Technical Note 2022-08                                                                                       38
7.1 Resource capacity 7.1.1 Unconfined Permian Sands About 80 % of this area is occupied by forestry activities and therefore the likelihood of any licenced extraction is quite low. A nominal figure of 50 ML/yr is proposed as the extraction limit. 7.1.2 Confined Permian Sands Licenced extraction from the two wells in this area occurs for industrial purposes which is the highest value use of this resource, given that salinities are in the range of 4,000 to 9,000 mg/L. Due to the aquifer being confined, the extraction of about 160 ML/yr has minimal impact on other licenced users, the nearest being 2.5 km away using the overlying Maslin Sands aquifer. A nominal figure of 250 ML/yr is proposed as the extraction limit. DEW Technical Note 2022-08 39
8 Fractured Rock aquifer
The fractured rock aquifer (FRA) occurs throughout the whole PWA, either as unconfined aquifer where it outcrops
at the ground surface on the margins of the Willunga Embayment, or as a confined aquifer underlying the Tertiary
and Quaternary sediments.

Figure 35 presents the boundaries of the unconfined FRA which covers the areas of higher topography
surrounding the PWA where the aquifer outcrops or is covered by thin unsaturated Tertiary sediments, while the
confined FRA includes the central part of the basin where the aquifer occurs at depths of over 75 m and is
confined by the overlying Tertiary sediments. Also shown are the licenced wells (in yellow) and the observation
wells whose hydrographs are presented in Figure 38.

Figure 35. Extent of the Fractured Rock aquifer and location of licenced wells

DEW Technical Note 2022-08                                                                                    40
8.1       Extraction and allocation
Figure 36 shows that metered extraction from the FRA aquifer since 2004-05 has been fairly consistent and mostly
below 1,000 ML/year, with seasonal variations caused by changes in rainfall. It is generally well below the 2020
allocation volume of 1,653 ML. The metered extraction as a percentage of the individual licenced allocations
averaged over the last two years is presented in Figure 37 and shows a lower degree of development of the
allocations than the other aquifers discussed previously. This under-development of allocations is probably due to
variable well yields and generally higher salinities than other aquifers which also suggests a low potential for
significant increases in extraction.

Figure 36. Metered extraction from the FRA aquifer

Figure 37. Use vs allocation for the FRA aquifer

DEW Technical Note 2022-08                                                                                     41
8.2       Groundwater flow direction
The potentiometric surface elevation in Figure 38 for both the unconfined and confined portions of the FRA shows
a general groundwater movement from areas of high topography toward the southwest and the coast. It also
suggests that the Willunga Fault is a barrier to groundwater flow, maintaining high water levels to the east of the
fault zone.

8.3       Water level trends
Water level monitoring has been carried out since the mid 1970s. Because this is generally an unconfined aquifer,
the water levels in Figure 39 show a relationship with rainfall patterns with water level declines mainly driven by
periods of below average rainfall (prior to 1992-93 and during the millennium drought). Long term trends vary
from relatively stable to a gradual decline.

DEW Technical Note 2022-08                                                                                       42
Figure 39. Selected hydrographs for the FRA aquifer

8.4        Salinity distribution
As shown in Figure 40, salinities in the FRA are quite variable with the lowest salinities (below 750 mg/L) found to
the northeast where the FRA is overlain by sedimentary aquifers (Maslin and Permian Sands). The highest salinities
occur along the northern boundary of the PWA where values are over 3,000 mg/L. This is well above the salinity
tolerance level for the irrigation of wine grapes (nominally 1500 mg/L).

Figure 40. Salinity distribution for the FRA aquifer in 2021

DEW Technical Note 2022-08                                                                                       43
8.5       Salinity trends
Figure 41 shows long term trends from five representative irrigation wells (locations shown in Fig. 33) which
indicate that trends are relatively stable, with periods of more frequent sampling showing a response to rainfall
between 1990 and 2010.

Figure 41. Long term salinity trends for the FRA aquifer

8.6 Connection with surface water and/or GDEs
The FRA connect with surface water in two main locations. The most noticeable is along the Onkaparinga Gorge
where the river is deeply incised into basement rocks. Water level data from wells suggest the FRA discharges
toward the river from within one kilometer, but at greater distances from the river, groundwater flow is south
toward the Willunga Embayment.

Elsewhere, the smaller creeks flowing out westward onto the plain from the escarpment may receive baseflow near
the base of the range. The most prominent of these creeks are Wiira Creek and Kangarilla Creek.

8.7       Sustainability issues
Fractured rock aquifers have complex fracture systems and well yields are highly variable. The impacts of extraction
are generally very localized. The long term monitoring trends show no overall significant sustainability issues in
terms of declining water levels or increasing salinity.

      8.7.1    Climate change
Because both the water level and salinity trends in the FRA show a muted relationship with rainfall, it could be
considered sensitive to climate change. A long term gradual decline in water levels that would result from a drying
climate could lead to the dewatering of joints and fractures and a reduction in well yields. A reduction in recharge
could result in reduced freshening of the aquifer and gradual increases in salinity. The FRA could therefore be
classified as vulnerable to climate change in the long term. Management actions are unlikely to mitigate this risk.

DEW Technical Note 2022-08                                                                                          44
8.8 Resource capacity
No extraction limit has been previously set specifically for the FRA aquifer. However, investigations have been
carried out to estimate recharge rates to determine the resource capacity for fractured rock aquifers in both the
Eastern and Western Mount Lofty Ranges PWRAs which abut the McLaren Vale PWA (EMLR - Banks et al, 2007;
WMLR - Green and Zulfic, 2008). The same methodologies can be applied to the unconfined portions of the FRA
in the McLaren Vale PWA where sufficient information is available. In order to do this, the FRA needs to divided
into appropriate recharge zones based on surface water catchments and geology as shown in Figure 42, together
with the annual rainfall isohyets.
Bakers Gully
Northern
Figure 42. Recharge zones for the unconfined FRA aquifer
Appendix A presents the calculations for the licenced allocation volume for each recharge zone using the EMLR
and WMLR methodology, with a summary presented below in Table 1. It should be noted that these calculations
are theoretical and are subject to large uncertainties. Table 1 also shows that current metered use for the three
zones averages about 55% of the allocated volume, which is probably due to salinity or well yield constraints. This
suggests there does not appear to be any unmet demand for additional irrigation supplies from the FRA.. The
recommended extraction limits in Table 1 takes into account the characteristics of each zone with the rationale for
these volumes discussed below.
DEW Technical Note 2022-08 45Table 1. FRA zones recommended extraction limits (ML/year) (refer also Appendix A)
Zone Calculated Volume Current Current Recommended
For Licensed Allocation Use extraction limit
Allocation
Hills Face 5,860 850 462 1,000
Bakers Gully 1,362 188 114 300
Northern 1,845 563 280 600
8.8.1 Hills Face Zone
This highly visible zone has very steep slopes with generally only the upper and lower portions suitable for
irrigated agriculture. Due to the steep topography, much of the rainfall would run off rather than infiltrate to
recharge the FRA. Recharge would also be inhibited by the considerable area of revegetation and native scrub
(about 880 ha). The extrapolated recharge rates would therefore be probably overstated. Given the lack of
demand, a modest extraction limit of 1,000 ML/yr is recommended, which represents a small increase above
current allocation levels.
8.8.2 Bakers Gully Zone
This zone has a more subdued topography than the Hills Face Zone and a higher density of settlement. It also has
a significant coverage of plantation forestry and native vegetation. The area has a high rainfall (over 800 mm/year)
and areas of low salinity in the FRA, which suggests significant recharge occurs. As with the Hills Face zone, usage
is only about 60 % of the allocation, suggesting low demand. A modest extraction limit of 300 ML/year is
recommended, which represents a small increase above current allocation levels.
8.8.3 Northern Zone
The Northern GMZ lies on the northern boundary of the PWA where the Onkaparinga River is strongly incised into
the basement rocks to form the Onkaparinga Gorge. The southern boundary of this zone is defined by the
northern extent of overlying Maslin Sand aquifer. Apart from the vegetated flanks of the gorge, most of the area is
covered with vineyards. There is a strong rainfall gradient increasing from west to east. Usage is only 50 % of the
allocation, which is probably a reflection of low demand due to high groundwater salinities. A modest extraction
limit of 600 ML/year is recommended, which represents a small increase above current allocation levels.
DEW Technical Note 2022-08 46You can also read