March 2021 Investor Presentation - Rexford Industrial Realty, Inc - NYSE: REXR
←
→
Page content transcription
If your browser does not render page correctly, please read the page content below

March 2021
Investor Presentation – Rexford Industrial Realty, Inc.
NYSE: REXR
Forward Looking Statements

This presentation contains “forward-looking statements” within the meaning of the Private Securities Litigation Reform Act of 1995. We caution investors that
any forward-looking statements presented herein are based on management’s beliefs and assumptions and information currently available to management.
Such statements are subject to risks, uncertainties and assumptions and may be affected by known and unknown risks, trends, uncertainties and factors that
are beyond our control. Should one or more of these risks or uncertainties materialize, or should underlying assumptions prove incorrect, actual results may
vary materially from those anticipated, estimated or projected. These risks and uncertainties include, without limitation: general risks affecting the real estate
industry (including, without limitation, the market value of our properties, the inability to enter into or renew leases at favorable rates, portfolio occupancy
varying from our expectations, dependence on tenants’ financial condition, and competition from other developers, owners and operators of real estate);
risks associated with the disruption of credit markets or a global economic slowdown; risks associated with the potential loss of key personnel (most
importantly, members of senior management); risks associated with our failure to maintain our status as a REIT under the Internal Revenue Code of 1986, as
amended; possible adverse changes in tax and environmental laws; and potential liability for uninsured losses and environmental contamination. In some
cases, you can identify forward-looking statements by the use of forward-looking terminology such as “may,” “will,” “should,” “expects,” “intends,” “plans,”
“anticipates,” “believes,” “estimates,” “predicts,” or “potential” or the negative of these words and phrases or similar words or phrases which are predictions
of or indicate future events or trends and which do not relate solely to historical matters. The risks described above are not exhaustive, and additional factors
could adversely affect our business and financial performance, including those discussed in our annual report on Form 10-K, for the year ended December 31,
2020, and subsequent filings with the Securities and Exchange Commission. We expressly disclaim any responsibility to update forward-looking statements,
whether as a result of new information, future events or otherwise.

                                                                                                                                                                2
Rexford Overview

                                                                            REXFORD AT A GLANCE

                                     2001                                                 100%                               REXR
                                      Founded                                 Infill Southern California                       NYSE

                      S&P 400                                             $7B+                               32M SF                      +10%
                            Member                                      Market Cap                                Owned          Core FFO Per Share
                                                                                                                                  Annual Growth
                                                                                                                                           (2016-2020)

                                     2020 PERFORMANCE                                                          BALANCE SHEET STRENGTH

                       98.2%                                     3.7%                                        4.0x              ~$675mm
                     SP Occupancy                           SPNOI Growth                              Net debt / Adj. EBITDA      Liquidity(1)
                           (as of 12/31)                                                                     (as of 12/31)            (as of 12/31)

                                                                                                                                                         3
(1)   Consists of $176mm in cash and $500mm available under the unsecured revolving credit facility                                                          3
Superior, Highly Differentiated Strategy
Nation's largest and highest demand industrial market with strongest fundamentals
SoCal Market Focus Rental rates are 80% higher than the average of the next 5 largest markets
Highest occupancy among the US top industrial markets with vacancy of 2.2%
Irreplaceable portfolio with substantial barriers to entry
Extreme scarcity of supply coupled with low vacancy, diminishing supply and growing demand
Infill Focus
Portfolio functionality offers highest quality in market
Ideally positioned to capture accelerating E-commerce demand
Generic industrial space appeals to broadest tenant universe and minimizes re-leasing costs
Generic Use, High and time-frames
Demand Space with
Approx. 1,400 total tenants, with top 10 tenants representing only 11.3% of total ABR
Diverse Tenant base
Infill SoCal tenant base has proven to be superior credit vs. larger tenants in non-infill markets
4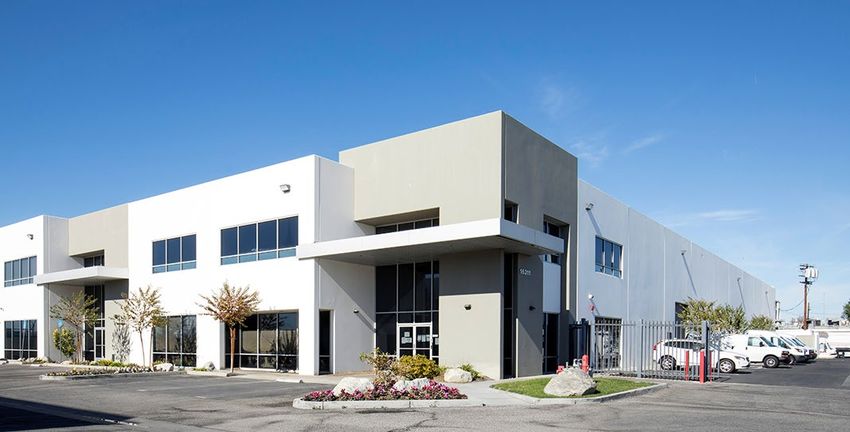
Robust Internal & External Growth Drives Superior
 Performance

                        Robust & Accretive Acquisition Activity (1)                                                                           NOI Growth Exceeds SF Growth

                               Net Acquisition Volume                                                                                               Annual NOI ($mm)
                                                                                                 32M SF

                                                                                                         (2)

Off/Lightly
                  71%       65%       67%        80%      48%        73%       79%        75%      70%
Marketed (1)

  (1)   Line reflects Net Acquisition Volume (Total Acquisitions minus Total Dispositions) by year. Bars reflect Total Portfolio SF at end of each time period.              5
  (2)   As of 3/5/21.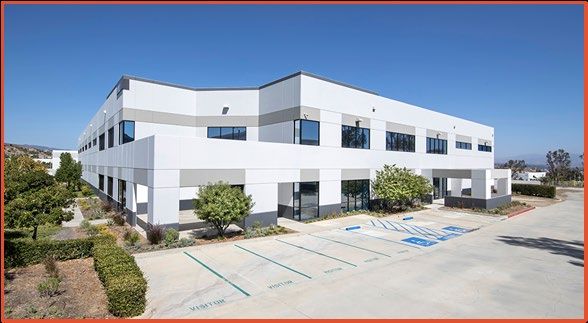
Accretive Internal & External Growth Drives Superior
Shareholder Returns
      10% Core FFO Per Share Growth vs 8% Peer Avg (1) (2016-2020)                                                    Dividend Per Share Growth Accelerating

                                                                                      REXR 10%

                                                                                      Peers 8%

                                                           Total Shareholder Return Outperformance Since IPO (2)

                                                                                                                                                                  311% Total Return
                                                                                                                                                                        REXR

                                                                                                                                                                  196% Total Return
                                                                                                                                                                     Peer Index

                                                                                                                                                                  61% Total Return
                                                                                                                                                                   MSCI REIT Index

(1)   Peer group includes PLD, DRE, EGP, FR, STAG and TRNO. Core FFO per share attributable to common shareholders was used for REXR, DRE, STAG and PLD. NAREIT definition of FFO per
      share was used for EGP, FR, and TRNO.                                                                                                                                             6
(2)   Source: S&P daily share prices for the period 7/19/13 to 3/5/21 for peer group referenced in Footnote 1 and MSCI REIT index, an index of all publicly-traded REITs.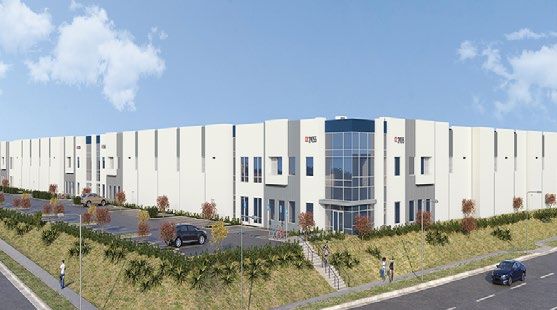
The Rexford Opportunity

 1       Proprietary access to leading industrial market
                with significant barriers to entry

 2          High-quality, irreplaceable portfolio with
                      pure-play advantage

 3        Strong, stable cash flow driven by incurable
       supply/demand imbalance & diversified tenant base

 4                Best-in-class balance sheet
            supports substantial growth opportunities

 5      Led by an experienced management team with an
          entrepreneurial, vertically-integrated platform

                                                            7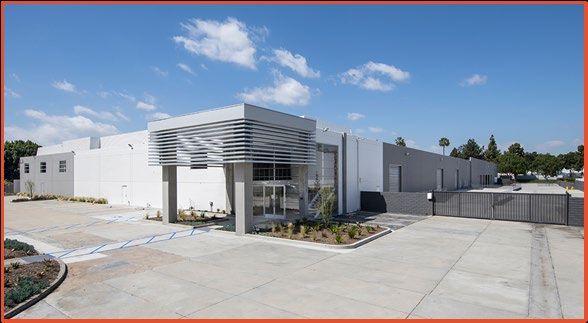
1
SoCal Infill Logistics Market Leads in Size & Value
Nation’s largest base of regional consumption, manufacturing, distribution
SoCal is Fourth Largest Global Industrial Market(2)
■ SoCal ports are largest in U.S., linking the U.S. to Pacific
14.0 12.8
12.0
Rim with 40% of all U.S. containerized imports, and
10.0
40%-50% of imports distributed locally(1) 7.5
Square Feet (bn)
8.0
■ Infill tenant base tends to serve regional consumption; 6.0 5.1
generally less impacted by shifts in global trade 4.0
2.2 2.0 1.7 1.5 1.5
2.0 0.8
-
It aly
UK
a
So. CA
ny
Japa n
China
USA
Fr ance
Ca na d
G er ma
Size and Value of Top US Industrial Markets
LargestLargest
Industrial Markets by
Industrial Average Market
Total Market SF (mm) (3) Implied Market ABR ($bn)
SF by SF
Markets Asking Rents per SF (2)
$7.54
Southern California 2,201 $10.40 $23.2
$5.17
Philadelphia
Chicago 1,370 $6.08 $8.3
$4.52 Value of SoCal market is
Chicago
Philadelphia 1,205 $6.49 $7.8 as large as the next 4-5
$5.92 largest U.S. markets
Northern New Jersey 851 $7.80 $6.6 combined after
$5.20 accounting for relative
Dallas / Ft. Worth 988 $5.14 $5.1 cap rates
$3.97
Atlanta 839 $5.21 $4.4
(1) Source: JLL.
(2) Source: CBRE. Southern California data includes Inland Empire East. 8
(3) Source: DAUM Real Estate Services as of 4Q20 citing CoStar Property Database. Southern California data includes Inland Empire East.
1

    Strong SoCal Market Dynamics with High Barriers-to-Entry
                                                                                                                           Highest Occupancy in the Nation (1)

    ■     Strong market dynamics including natural/physical
          barriers, large population centers, minimal land
          availability, high-cost land and development/
          restrictive entitlement process

    ■     Diminishing supply of for-lease infill industrial
          property – over 100M SF removed from infill
          market or converted to other uses since 2001 (1)

                                                                                                                                                                         (3)

           SoCal Rental Rates: 80% Higher Than Next Top 5 Markets (2)                                       High Occupancy, Leading Rental Rates Create Superior Valuation (1)

                                                                                                                                                                               $252

                                                                                                                                                                               $122

                                                                                              (3)

    (1)   Source: CoStar/DAUM Real Estate Services
    (2)   Source: CBRE                                                                                                                                                                9
    (3)   Other top market average includes Chicago, Philadelphia, Northern New Jersey, Dallas/ Ft. Worth and Atlanta
1
Ideally Positioned as E-Commerce First Mile and Last Mile
Dramatic growth in flow of goods locally and accelerating demand for industrial space in infill Southern California driven
by E-Commerce growth and shorter delivery time-frames
■ Southern California is largest end-point for consumption and E-Commerce distribution in U.S.
■ 100% of Rexford portfolio is located within E-Commerce “last mile” logistics markets in infill Southern California
■ E-Commerce requires 2-3x the distribution SF space of traditional retail(1)
■ U.S. Retail E-Commerce sales increased 32% in Q4 2020 vs. Q4 2019(2)
■ Demand for local warehouses increasing as COVID drives shift in supply chains and inventory management
■ Increased demand coupled with lack of supply provides additional lever for significant rent growth
U.S. Retail E-Commerce Sales Growth ($bn)(3) % of REXR’s New Leases with E-Commerce Related Tenants
$712
$506
2018E 2022E
(1) Source: CBRE.
(2) Source: U.S. Census Bureau, not adjusted basis. 10
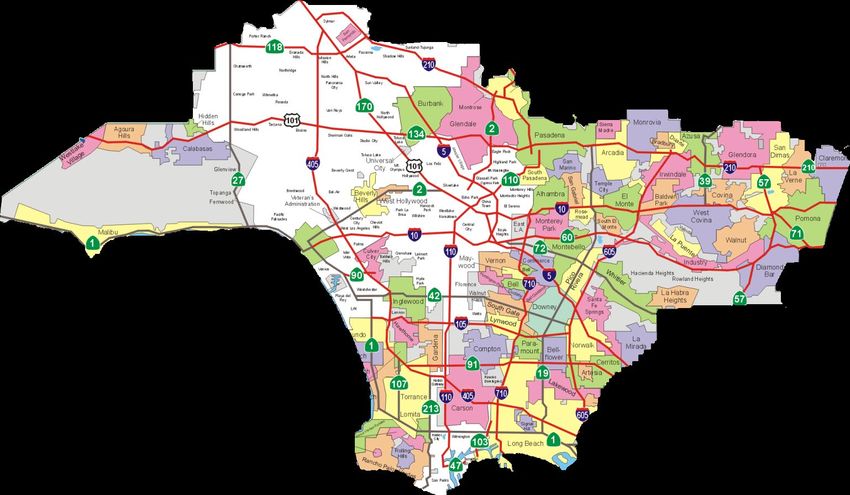
(3) Forrester Research.2 Extreme Supply Scarcity Drives Projected Market Rent Growth
Outperformance
Low market vacancy combined with strong tenant demand drive robust internal growth
Fragmented market provides consolidation opportunity to increase Rexford’s 1.7% market share through external growth
Ventura County Los Angeles County Legend:
San Fernando Valley Market Size
182M SF San Gabriel Mountains Market Vacancy
Ventura County REXR SF(1)
2.2% Vacancy
64M SF REXR # Properties(1)
REXR owns 5.1M SF 47 Props
2.0% Vacancy REXR % of Market (2)
REXR 2.8% of Market
REXR owns 2.4M SF 16 Props
REXR 3.8% of Market
San Bernardino County
San Gabriel Valley
Santa Monica Mountains Central LA 157M SF
278M SF 1.6% Vacancy IE West
3.0% Vacancy REXR owns 3.5M SF 23 Props 314M SF
REXR owns 2.5M SF 14 Props REXR 2.3% of Market 1.6% Vacancy
REXR 0.9% of Market REXR owns 4.9M SF 28 Props
REXR 1.6% of Market
Mid-Counties
111M SF
1.4% Vacancy
REXR owns 2.5M SF 21 Props
South Bay REXR 2.3% of Market
219M SF
1.2% Vacancy Riverside County
REXR owns 4.4M SF 51 Props
REXR 2.0% of Market Orange County
258M SF Santa Ana Mountains
1.9% Vacancy
REXR owns 3.4M SF 31 Props Orange County
REXR 1.3% of Market
San Diego County
196M SF
4.6% Vacancy
Industrial Rent Growth Projections (2020 – 2025) REXR owns 2.9M SF 31 Props
REXR 1.5% of Market
Source: All market data per CBRE as of 4Q20. Downtown LA and Commerce/Vernon submarkets are combined as Central LA from CBRE.
(1) Rexford property information as of 3/5/21. 11
(2) REXR % of Market as of 3/5/21 for Rexford portfolio and as of 4Q 2020 for market size.2
Higher Rents Demonstrate Superior Market Fundamentals
and Quality
100% of Rexford properties located within infill Southern California;
Rexford’s ABR exceeds peers by more than 60% reflecting strength of infill Southern California market
REXR ABR
Per SF: Peer Average
$10.35 ABR Per SF (1)
$6.46
REXR SF
9% 57% 11% 8% 15%
By Market (1)
(1) As of 4Q 2020. Peer group includes DRE, EGP, FR, PLD, TRNO and STAG. ABR is defined as annualized base rent per occupied square foot. REXR, EGP, FR, STAG and TRNO are
presented on a in-place ABR basis. DRE and PLD are presented on a net effective ABR basis.
123
Stable & Diversified Tenant Base
Stable + diversified tenant base producing recurring and stable cash flow
Generic Use, High-Demand Industrial
Highly Diversified Rexford Tenant Base(1) Strong Tenants of All Sizes (SF)(1)
Space(1)
(2)
Top 10 Tenants represent only 11.5% of ABR(1)
(1) Based on percentage of total annualized base rent as of 12/31/20.
(2) “Other” represents Light Manufacturing / Flex and Cold Storage / Distribution.
133
Proven Track Record of Superior, Value-Add Asset
Management
Strong Leasing Spreads
New Leasing Spreads Combined New/Renewal Annual Leasing Spreads
Retention Highlights REXR’s Ability to Selectively Replace
Expiring Leases in 2021
Tenants and Re-lease
estimated to be 17% below-market (1)
High-demand Space at Higher Rates
Retention Rate SF Expiring as a % of Total Portfolio SF
14
(1) Based on percentage of in-place + uncommenced ABR.3
Nominal COVID Impact on Operations and Growth
Rexford’s portfolio is well-positioned to weather the health crisis and thrive post-COVID
■ 2021 YTD Acquisition Activity (as of 3/5/21) = $118 million (7 properties); 2020 Acquisition Activity = $1.2 billion
~$350M of properties currently under contract or LOI
■ Despite multiple governmental actions including stay-at-home orders, business shut-downs and restrictions, and passing
local orders allowing tenants to unilaterally defer rent, Rexford’s portfolio has performed strongly
Q3 2020 and Q4 2020 Collections to date near pre-COVID levels
• Q4 2020 cash collections of 97.8% includes 96% collection of deferral billings
• Executed $4.7M of total deferrals, or 1.4% of revenues (average 1.5 months rent)
• Collected $3.5M of deferred rent in 2020; $900K (0.2% of total revenue) remaining in 2021
Current same property portfolio occupancy of 98.2% (as of 12/31/20) is in line with pre-pandemic levels
Cash Collections
153
Proprietary Acquisition Sourcing
In-depth research and extensive local broker network drive significant transaction volume;
COVID market stress driving potential for incremental acquisition opportunities
Deep Relationships, Marketing &
Proven Research & Analytics
Premier Rexford Brand
■ Extensive database mining of brokers, ■ Relationships developed over 30+ years
owners and lenders
■ Extensive broker marketing and incentives
■ Event-driven research & catalysts
■ Superior alignment with key market
■ Owner capital structure analysis participants
■ Extensive property and transaction
analyses
Competitive Sourcing Advantage
■ Actively monitoring and pursuing more than $1 billion of opportunities
■ FY 2020 sent 545 LOIs ($22.7B value) of which ~93% were off-market/lightly marketed
■ 70% of acquisitions since IPO generated through off-market or lightly-marketed transactions
(1)
■ Acquired 28.3mm SF of industrial real estate since 2013 IPO
(1) As of 3/5/21. 163
Rexford’s Value-Add Execution is a Key Differentiator
Development and Repositioning projects drive substantially above market cash yields (1)
■ FY 2020 stabilized 603,000 SF at average stabilized yield of 5.6%
In Process and Pipeline Redevelopment/Repositioning ($000s)
Projected Projected Est. Annual Est. Annual
Projected Purchase Redev/Repo Total Investment Stabilized Stabilized
RSF Price Cost Investment to Date Cash NOI Cash Yield
Redevelopment In Process 201,880 $12,178 $23,885 $36,063 $19,061 $2,191 6.0%
Redevelopment Pipeline 913,686 $90,887 $84,914 $175,801 $93,765 $10,249 5.8%
Repositioning In Process/Lease-Up (2) 499,623 $43,595 $63,257 $106,852 $83,879 $4,900 5.7%
Repositioning Pipeline 1,064,843 $179,909 $37,520 $217,429 $181,261 $1,738 6.0%
Total In-Process and Pipeline 2,680,032 $326,569 $209,576 $536,145 $377,966 $19,078 5.9%
Avenue Paine, Valencia 9615 Norwalk, Santa Fe Springs
■ Constructing new 111K SF building ■ Developing new 202K SF building
■ Projected stabilized yield of 6.2% ■ Projected stabilized yield of 6.6%
851 Lawrence Dr, Thousand Oaks 12821 Knott Street, Garden Grove
■ Constructing new 91K SF four-tenant ■ Modernizing existing vacant 121K SF
building building and adding additional 45K SF
■ Projected stabilized yield of 5.8% ■ Projected stabilized yield of 5.7%
(1) For a complete list of development and repositioning properties and completion time frames, please see p. 21-22 of our 4Q 2020 supplemental package.
(2) Includes 23 properties summarized into “Other Repositioning” category.
173
Positioned for Robust Internal NOI Growth
Approx. $62 million NOI growth potential embedded within existing in-place portfolio
Projected Embedded Internal NOI Growth ($mm)
(Excludes Future Acquisitions)
~$328mm
■ Projected NOI growth of
approximately 23% over 12-24
months from in-place portfolio
~$62mm
■ Demonstrates Rexford’s value-add,
accretive approach driving FFO per
share growth
■ Additional NOI growth upside
potential from go-forward
acquisitions
■ Over 95% of leases include 3% or
greater annualized rent increases
(1) (2)
Source: Company filings unless otherwise noted.
(1) Based on the annualized sum of 4Q20 GAAP NOI of $66.5mm minus NOI from dispositions.
(2) Includes projected NOI impact of (a) Stabilization of properties and spaces undergoing repositioning as of 12/31/20 (Repositioning incremental CapEx = $158 million); (b) 4Q 2020 / 1Q 2021 acquisitions as of 3/5/21 not already
included in 4Q20 GAAP NOI; and (c) Re-leasing of 2021-2022 expiring square footage, not including repositioning properties, at projected 17% re-leasing spreads (note: GAAP leasing spreads averaged 31.4% over prior four
quarters), assumes consolidated portfolio excluding repositioning properties occupancy remains constant at 12/31/20 levels of 96.7%.
184
Strong, Low Leverage Balance Sheet Positioned for Growth
Highlights Capital Structure (2)
■ Over $675 million of liquidity $7B+ Total Capitalization
■ No near-term debt maturities until 2023
■ Investment grade ratings of BBB/Baa3/BBB (S&P/Moody’s/Fitch)
■ Low leverage ratios
Net Debt / LQA Adjusted EBITDA: 4.0x(1)
Net Debt / Total Enterprise Value: 12.9%
Fixed Charge Coverage Ratio: 3.8x
Well-Staggered Debt Maturities ($mm)
$477
95% of debt is fixed or
swapped with a
weighted average
interest rate of 3.1%
$290
and weighted average
$250
maturity of 6.6 years
$146
$40.4
$14 $14 $25
$7
Note: Unless stated otherwise, all information as of 12/31/20.
(1) Last qtr annualized (LQA) Adj EBITDA for 4Q adjusts for non-cash stock comp, gains, non-recurring and acquisition exp., and pro forma for the annualized impact of 4Q acquisitions and dispositions.
(2) Common equity based on $47.59 closing price on 3/5/21, includes operating partnership units. Preferred equity reflects 100% of par value of preferred shares.
194
Fortress-Like Balance Sheet with Diverse Sources of Capital
Low Net Debt / Total Combined Market Cap Net Debt / Adjusted EBITDA (Annualized)
Demonstrated Access to Multiple Capital Sources ($mm)
$1,138
$859
$655
$570
$352
205
Vertically Integrated Platform, Experienced Management
Entrepreneurial and proven team with average of 25+ years of experience
Years of Real Estate
Name Title
Experience
Proprietary Research
Management &
Originations
Howard Schwimmer Co-CEO, Director 38
Accounting Acquisitions
& Finance &
Michael Frankel Co-CEO, Director 18 Due Diligence
Laura Clark CFO 16
David Lanzer General Counsel 23
Construction
& Financing
Patrick Schlehuber EVP, Acquisitions 16 Redevelopment &
Capital Markets
EVP, Development &
Carlos Serra 22
Construction
Bruce SVP, Development &
30
Herbkersman Construction Leasing
& Asset &
Advisory Marketing Property
Management
Richard Ziman Chairman 47
215
Environmental, Social and Governance (ESG)
Value-driven business model enables delivery of exceptional triple bottom line
economic, environmental and social benefits (1)
Environmental:
Some companies recycle paper. We recycle buildings.
■ Value-add repositioning and renovation improves environmental
impact
■ Repositioning of existing buildings enabled potential embodied Case Study: 14750 Nelson
carbon savings of over 46,000 metric tons of carbon-equivalent
emissions compared to new construction ■ The 202,000 SF 14 Unit Business Park, 145,000 SF renovated
■ Awarded 2020 and 2019 Silver-level Green Lease Leader(2) existing building & 65,000 SF new construction (8% stabilized yield)
Social: ■ Repositioning achieved estimated triple bottom line NPV benefits
of $32.5 million vs alternatives of new infill construction or new
■ Team diversity as a competitive advantage: 55% of employees are construction in non-infill markets
female and 49% self-identify as members of a racial or ethnic
minority ■ Over $8.1 million in estimated savings due to lower construction
■ All staff have access to enhancing skill development and career costs driven by re-use of building’s core
advancement through our Rexford learning platform
■ 100% of staff receive annual performance appraisals and ■ Re-use of approximately 16,000 tons of construction materials
compensation adjustment consideration prevented an estimated 994 tons of carbon equivalent emissions
■ Extensive corporate and staff community and philanthropic
engagement
Governance: Before
■ Code of Business Conduct and Ethics ensuring highest level of ethical
conduct across the organization
■ Non-classified board subject to annual re-election
■ Opted out of Maryland business combination and control share
acquisition statutes and no shareholder rights plan After
(1) For more information and supporting data please see 2019 Environmental, Social and Corporate
Governance Report at www.rexfordindustrial.com/our-story.
(2) Awarded by the Institute for Market Transformation (IMT) and the U.S. Department of Energy’s (DOE)
Better Buildings Alliance. 22Appendix.
Recent Acquisitions
                                           Recent Acquisition                                                              Recent Acquisition

                               Van Nuys Airport Industrial Center                                                      Gateway Pointe
                                   Nineteen Industrial Buildings on 23 Acres                                   Four Industrial Buildings on 45 Acres
                                        Greater San Fernando Valley                                                  Whittier, Mid-Counties

               Acquisition Price           Acquisition Date              Size                     Acquisition Price       Acquisition Date            Size
                $164.6 million            Dec. 2020/Jan. 2021         463,366 SF                   $296.6 million         November 2020            989,195 SF

              ■ Off-market transaction completed using a combination of cash and                  ■ Opportunity to purchase property in submarket with 1.4% vacancy

                                                                                     Sourcing
                 debt
Sourcing

                                                                                                  ■ Value-add opportunity to drive rents estimated to be 21% below
              ■ Located adjacent to Van Nuys Airport, ideally suited for last-mile                    market
                 and e-commerce use

                                                                                                  ■ Class A property ideally positioned to serve last-mile, e-commerce-
              ■ Includes premium functionality with dock-high loading, modern                         oriented tenant demand
                clear heights, and secured truck storage yards

                                                                                     Highlights
                                                                                                  ■ Premium functionality features 32’ clear heights, extensive dock-
Highlights

              ■ 99% leased to high-quality tenant base, with rents estimated to be                    high loading, and excess container parking
                approx. 6% below market at acquisition
                                                                                                  ■ Projected stabilized yield of over 4.0%
              ■ Projected stabilized yield of approximately 4.5%

                                                                                                                                                                          24
Recent Redevelopments in 2H 2020
Recently Completed Redevelopment Recently Completed Redevelopment
16121 Carmenita 29003 Avenue Sherman
Two Tenant Industrial Property Single Tenant Industrial Property
Los Angeles Mid-Counties San Fernando Valley
AcquisitionDate
Acquisition Price AcquisitionDate
Stabilization Date Size
Size AcquisitionDate
Acquisition Price AcquisitionDate
Stabilization Date Size
Size
$17.1 million
August 2018 February
Q3 20202017 111,346
109,780 SF SF $17.1 million
July 2018 February
Q4 20202017 111,346
68,123 SF SF
■ Value-add repositioning and 2-tenant conversion of 105K SF in
■ Value-add repositioning of 68K SF building in submarket with
submarket with 1.4% vacancy
Sourcing
2.2% vacancy
Sourcing
■ Purchased with short-term in place tenant with below-market rent
■ Purchased vacant modern industrial building from repeat private
which generated cash flow during permitting seller
■ Comprehensive repositioning and modernization, fire protection
■ Comprehensive office reconfiguration and exterior renovation
upgrade, façade enhancements, new and renovated office buildout,
Highlights
addition of dock high loading positions ■ Signed long-term lease to furniture rental E-Commerce company
Highlights
■ Signed long-term lease to surgical appliance/supplies manufacturing
■ Achieved stabilized yield of 5.1%
company and an electrical equipment/wiring company
■ Achieved stabilized yield of 5.9%
25Non-GAAP Reconciliations
Net Operating Income Funds From Operations
Qtr ended Qtr ended Jul 24, 2013 to Qtr ended Qtr ended Jul 24, 2013 to
($ in '000s) (1) ($ in '000s)
Dec 31, 2020 Dec 31, 2019 Sept. 30, 2013 Dec 31, 2020 Dec 31, 2019 Sept. 30, 2013 (1)
Net Income (Loss) $ 18,155 $ 24,382 $ (5,573) Net Income (Loss) $ 18,155 $ 24,382 $ 295
Add: Add:
General and administrative 9,042 8,215 4,385 D&A, including amounts in discontinued operations 30,554 26,877 3,062
D&A 30,554 26,877 3,913 D&A from unconsolidated joint ventures -- -- 96
Acquisition expenses 35 (3) 126 Loss on sale of real estate -- -- --
Interest expense 8,673 7,364 1,950 Subtract:
Loss on sale of real estate -- -- -- Gain on sale of real estate (52) 10,592 --
Subtract: Funds from Operations $ 48,761 $ 40,667 $ 3,453
Less: preferred stock dividends (3,636) (3,636) 3,062
Management, leasing, and development services 95 105 294
Less: FFO, noncontrolling interests (2,182) (1,087) 96
Interest income 59 279 254
Less: FFO, participating securities (188) (188) --
Equity in (loss) income from unconsolidated RE entities -- -- 92
Company Share of FFO $ 42,755 $ 35,756 $ 3,001
Gain/(Loss) on extinguishment of debt (104) -- (3,919) Non Recurring Legal Fees -- -- 235
Gain on sale of real estate (52) 10,592 -- Debt Extinguishment/Termination of interest rate swap 322 -- --
Income from discontinued operations -- -- 130 Acquisition Expenses 35 (3) 119
Net Operating Income (NOI) $ 66,461 $ 55,859 $ 7,950 Company Share of Core FFO $ 43,099 $ 35,754 $ 3,373
Fair value lease revenue (2,711) (2,191) 166 Weighted-average shares outstanding - diluted 126,401 112,097 24,574
Straight line rent adjustment (434) (2,200) (127) FFO per share - diluted $ 0.34 $ 0.32 $ 0.12
Cash NOI $ 63,316 $ 51,468 $ 7,989 Core FFO per share - diluted $ 0.34 $ 0.32 $ 0.14
Pro forma effect of acquisitions 5,260 1,500 23 FFO per share quarterized (2) $ 0.16
Pro forma effect of dispositions 4 (96) (157) Core FFO per share quarterized (2) $ 0.18
Pro forma effect of uncommenced leases 1,208 1,304 --
Pro forma effect of properties/space under repositioning 5,456 3,643 -- Annualized Impact
Pro Forma Cash NOI $ 75,244 $ 57,819 $ 7,855 Net Operating Income $ 265,844 $ 223,436 $ 31,800
Net effect of pro forma adjustments $ 47,712 $ 25,404 $ (536)
Recurring FFO per share - basic and diluted $ 1.36 $ 1.28 $ 0.55
Source: Company filings.
(1) Represents the results of operations for our predecessor for the period from 7/01/13-7/23/13 and Rexford Industrial Realty Inc. for the period from 7/24/13-9/30/13.
(2) Figure is quarterized from the reported number after the IPO until the end of the quarter to represent the full 3Q13.
26You can also read