Mapletree North Asia Commercial Trust - Business Update for the Period from 1 April 2021 to 31 December 2021 (YTD FY21/22)
←
→
Page content transcription
If your browser does not render page correctly, please read the page content below
Mapletree North Asia Commercial Trust
      Business Update for the Period from
1 April 2021 to 31 December 2021 (YTD FY21/22)
                27 January 2022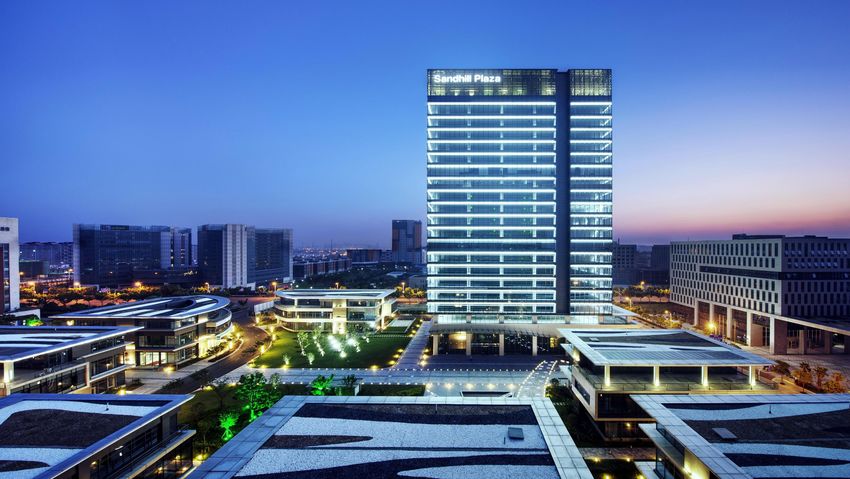
Important Notice
NOT FOR RELEASE, PUBLICATION OR DISTRIBUTION, IN WHOLE OR IN PART, IN, INTO OR FROM ANY JURISDICTION WHERE TO DO SO WOULD CONSTITUTE A VIOLATION OF THE RELEVANT LAWS OF THAT
JURISDICTION. THIS PRESENTATION SHALL NOT CONSTITUTE AN OFFER TO SELL OR A SOLICITATION OF AN OFFER TO BUY SECURITIES IN ANY JURISDICTION, INCLUDING IN THE UNITED STATES OR
ELSEWHERE.
This presentation should be read in conjunction with the announcement released by Mapletree North Asia Commercial Trust (“MNACT”) and Mapletree Commercial Trust (“MCT”) on 31 December 2021 (in relation to the proposed
merger of MNACT and MCT) (the “Joint Announcement”) as well as the announcement released by MCT on 31 December 2021 (in relation to the proposed merger of MNACT and MCT) ("MCT Manager Announcement", together
with the Joint Announcement, the “Announcements”). A copy of each of the Announcements is available on http://www.sgx.com.
This presentation is for information purposes only and does not have regard to your specific investment objectives, financial situation or your particular needs. Any information in this presentation is not to be construed as
investment or financial advice and does not constitute an invitation, offer or solicitation of any offer to acquire, purchase or subscribe for units in MNACT (“MNACT Units”). The value of MNACT Units and the income derived from
them, if any, may fall or rise. The MNACT Units are not obligations of, deposits in, or guaranteed by, Mapletree North Asia Commercial Trust Management Ltd. (the “MNACT Manager”), DBS Trustee Limited (as trustee of MNACT)
(the “MNACT Trustee”) or any of their respective related corporations or affiliates. An investment in the MNACT Units is subject to investment risks, including the possible loss of the principal amount invested.
The past performance of MNACT and the MNACT Manager is not necessarily indicative of the future performance of MNACT and the MNACT Manager.
Certain statements in this presentation may constitute “forward-looking statements”, including forward-looking financial information. Such forward-looking statements and financial information involve known and unknown risks,
uncertainties and other factors which may cause the actual results, performance or achievements of MNACT or the MNACT Manager, or industry results, to be materially different from any future results, performance or
achievements, expressed or implied by such forward-looking statements and financial information. Such forward-looking statements and financial information are based on numerous assumptions regarding the MNACT Manager’s
present and future business strategies and the environment in which MNACT or the MNACT Manager will operate in the future. Actual future performance, outcomes and results may differ materially from these forward-looking
statements and financial information. Because these statements and financial information reflect the MNACT Manager’s current views concerning future events, these statements and financial information necessarily involve risks,
uncertainties and assumptions. These forward-looking statements speak only as of the date of this presentation. No assurance can be given that future events will occur, that projections will be achieved, or that assumptions are
correct.
Representative examples of these factors include (without limitation) general industry and economic conditions, interest rate trends, cost of capital and capital availability, competition from similar developments, shifts in expected
levels of property rental income, changes in operating expenses (including employee wages, benefits and training costs), property expenses and governmental and public policy changes. You are cautioned not to place undue
reliance on these forward-looking statements, which are based on the MNACT Manager’s current view of future events. None of MNACT, DBS Trustee Limited (as trustee of MNACT), the MNACT Manager and the financial adviser
of the MNACT Manager undertakes any obligation to update publicly or revise any forward-looking statements.
This presentation includes market and industry data and forecast that have been obtained from internal survey, reports and studies, where appropriate, as well as market research, publicly available information and industry
publications. Industry publications, surveys and forecasts generally state that the information they contain has been obtained from sources believed to be reliable, but there can be no assurance as to the accuracy or completeness
of such included information. While the MNACT Manager has taken reasonable steps to ensure that the information is extracted accurately and in its proper context, the MNACT Manager has not independently verified any of the
data from third party sources or ascertained the underlying economic assumptions relied upon therein.
Investors have no right to request the MNACT Manager to redeem or purchase their MNACT Units for so long as the MNACT Units are listed on Singapore Exchange Securities Trading Limited (the “SGX-ST”). It is intended that
holders of MNACT Units may only deal in their MNACT Units through trading on the SGX-ST. Listing of the MNACT Units on the SGX-ST does not guarantee a liquid market for the MNACT Units.
The information and opinions contained in this presentation are subject to change without notice.
The directors of the MNACT Manager (including those who may have delegated detailed supervision of this presentation) have taken all reasonable care to ensure that the facts stated and opinions expressed in this presentation
which relate to MNACT and/or the MNACT Manager (excluding those relating to MCT and/or the MCT Manager) are fair and accurate and that there are no other material facts not contained in this presentation the omission of
which would make any statement in this presentation misleading. The directors of the MNACT Manager jointly and severally accept responsibility accordingly.
Where any information has been extracted or reproduced from published or otherwise publicly available sources or obtained from MCT and/or the MCT Manager, the sole responsibility of the directors of the MNACT Manager has
been to ensure through reasonable enquiries that such information is accurately extracted from such sources or, as the case may be, reflected or reproduced in this presentation. The directors of the MNACT Manager do not accept
any responsibility for any information relating to MCT and/or the MCT Manager or any opinion expressed by MCT and/or the MCT Manager.
This presentation has not been reviewed by the Monetary Authority of Singapore.
The presentation is qualified in its entirety by, and should be read in conjunction with, the full text of the Announcements. In the event of any inconsistency or conflict between the Announcements and the
information contained in this presentation, the Announcements shall prevail. All capitalised terms not defined in this presentation shall have the meaning ascribed to them in the Announcements.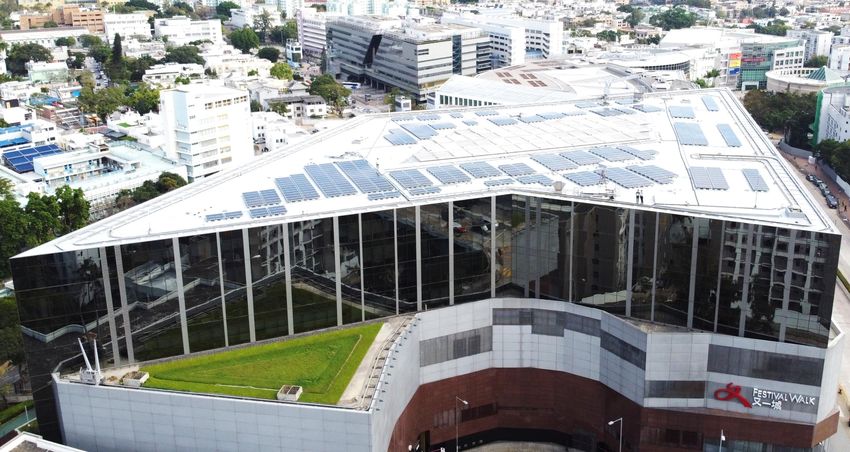
Contents YTD FY21/22 Financial Summary YTD FY21/22 Portfolio Update Commitment to Sustainability Proposed Merger with MCT Appendix
YTD FY21/22
    Financial Summary

4                       Sandhill Plaza, Shanghai
YTD FY21/22 Financial Summary
NPI in YTD FY21/22 was higher compared to YTD FY20/21 due to:
YTD FY21/22 Gross Revenue1
+ Lower rental reliefs of S$4.7 million granted to retail tenants at FW (YTD
S$328.0m FY20/21: S$43.9 million)
+ Contribution from Hewlett-Packard Japan Headquarters Building (“HPB”)
12.8% compared to YTD FY20/21
acquired on 18 June 2021
− Partially offset by lower average rental rates at FW mall and GW
YTD FY21/22 NPI
NPI in 3Q FY21/22 improved compared to 3Q FY20/21 due to:
S$247.4m + Absence of rental reliefs in 3Q FY21/22 (3Q FY20/21: S$8.7 million)
14.9% compared to YTD FY20/21 + Full-quarter contribution from HPB
Notwithstanding the incremental borrowings to fund the acquisition of
YTD FY21/22 NPI Margin HPB, finance costs was lower by S$5.6 million in YTD FY21/22 compared
to YTD FY20/21 due to:
75.4% + Lower benchmark interest rates
1.3 ppts compared to YTD FY20/21 + Active refinancing activities
1. YTD FY21/22 Gross Revenue and NPI do not include the contribution from The Pinnacle Gangnam, acquired on 30 October 2020. MNACT will share profit after tax of The Pinnacle Gangnam based on
its 50% interest.
FW: Festival Walk; GW: Gateway Plaza; SP: Sandhill Plaza; JP: Japan Properties; TPG: The Pinnacle Gangnam
5
YTD FY21/22 Portfolio Contribution
    (Including contribution from TPG)

                                                                                                                                                           Contribution to
               Contribution to                                                       Contribution to                                                        Assets Under
               Gross Revenue1                                                             NPI1                                                              Management3
                  (YTD FY21/22)                                                         (YTD FY21/22)                                                     (As at 31 Dec 2021)
                  S$336.8m                                                              S$253.9m                                                           S$8,374.2m

       FW                                      48%                        FW                                       49%                         FW                               54%
       GW                                      18%                        GW                                       19%                         GW                               16%
       SP                                        6%                       SP                                         7%                        SP                               6%
       JP2                                     25%                        JP2                                      22%                         JP                               21%
       TPG                                       3%                       TPG                                        3%                        TPG                              3%
    1. For presentation purpose, the Gross Revenue and NPI of the portfolio shown on this slide include MNACT's 50% share of the Gross Revenue and NPI from TPG.
    2. Includes contribution from HPB, following the completion of its acquisition on 18 June 2021.
    3. Includes MNACT’s 50.0% effective interest in TPG.

6   FW: Festival Walk; GW: Gateway Plaza; SP: Sandhill Plaza; JP: Japan Properties; TPG: The Pinnacle Gangnam;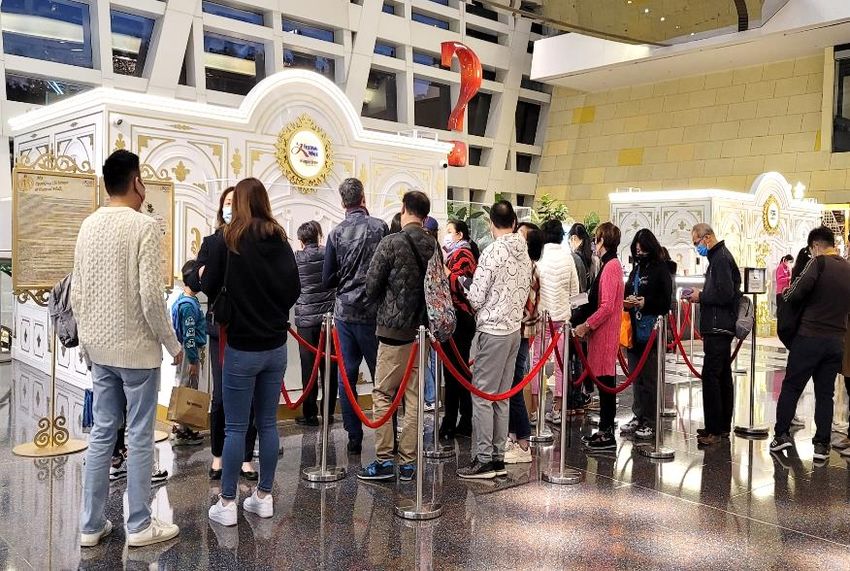
Portfolio Gross Revenue and NPI by Asset
(Including contribution from TPG)
Gross Revenue by Asset (S$m) Change vs YTD FY20/21
NPI by Asset (S$m)
6.5 Change vs YTD FY20/21
8.8 TPG NM1 1.5 TPG NM1
1.8 56.7
84.0 49.8
76.6 JP 9.8% 19.2 JP 13.7%
20.5 17.7
19.0 61.1 48.5
58.6 SP 8.0% 46.7 SP 8.6%
GW 4.3% GW 3.8%
136.6 162.3 101.2 123.1
FW 18.8% FW 21.6%
YTD FY20/21 YTD FY21/22 YTD FY20/21 YTD FY21/22
Higher NPI for FW: Lower rental reliefs granted during YTD FY21/22 compared to the corresponding period last year, partially
offset by a lower average retail rental rate.
Higher NPI for GW: Stronger RMB against SGD and higher average occupancy, partially offset by a lower average rental
rate.
Higher NPI for SP: Higher average occupancy rate and a stronger RMB against SGD.
Higher NPI for JP: Contribution from the newly acquired HPB in June 2021 and higher average occupancy at IXINAL
Monzen-nakacho Building (“MON”) in Tokyo and mBAY POINT Makuhari (“MBP”) in Chiba.
Higher NPI for TPG: Full nine months contribution in YTD FY21/22, compared to approximately two months’ contribution from
30 October 2020 (completion of its acquisition) in YTD FY20/21.
1. NM – not meaningful. Contribution from TPG in YTD FY20/21 was from 30 October 2020 (completion of its acquisition).
7 FW: Festival Walk; GW: Gateway Plaza; SP: Sandhill Plaza; JP: Japan Properties; TPG: The Pinnacle Gangnam;
Balance Sheet and Capital Management Metrics
    (As at 31 December 2021)
                                                Assets under                                           Total                                                   Net Asset Value (“NAV”)
              Balance                           Management1                                            Gross Debt2                                             per Unit
               Sheet
                                                S$8,374.2m                                             S$3,654.2m                                              S$1.225
                                                30 September 2021:                                     30 September 2021:                                      30 September 2021:
                                                S$8,443.6m                                             S$3,645.9m                                              S$1.2653

            Capital                             Aggregate                                              Adjusted Interest Cover                                 Annualised Effective
                                                Leverage Ratio4,5                                      Ratio6,7                                                Interest Rate for YTD
          Management
                                                                                                                                                               FY21/22
            Metrics
                                                42.1%                                                  4.2 times                                               1.84% per annum
                                                30 September 2021:                                     30 September 2021:                                      YTD FY20/21:
                                                41.4%                                                  4.1 times                                               2.04% per annum
    1. Based on latest independent valuation of MNACT’s properties as at 31 October 2021. Includes MNACT’s 50.0% effective interest in TPG.
    2. As at 31 December 2021, 69% (30 September 2021: 69%) of MNACT’s debt is unsecured. The secured debt includes JPY onshore borrowings, which are secured against JP, and the proportionate
       share of KRW onshore borrowings, which are secured against TPG.
    3. Taking into account distribution payments to MNACT unitholders on 24 December 2021 and assuming valuation of MNACT’s properties held as of 30 September 2021 is based on the latest independent
       valuation as at 31 October 2021, NAV per unit would have been S$1.1949.
    4. MNACT holds a 98.47% effective interest in JP and a 50.0% effective interest in TPG. In accordance with the Property Funds Guidelines, the aggregate leverage ratio includes MNACT’s proportionate
       share of borrowings and deposited property values for JP and TPG.
    5. As at 31 December 2021, perpetual securities and total gross debt to net asset value ratio was 88.8%, while perpetual securities and total gross debt (less cash and cash equivalents held in MNACT’s
       functional currency (SGD)) to net asset value ratio was 89.7%.
    6. In accordance with the guidance from the Monetary Authority of Singapore, the adjusted interest coverage ratio is calculated by dividing the trailing 12 months earnings before interest, tax, depreciation
       and amortisation (excluding effects of any fair value changes of derivatives and investment properties, foreign exchange translation), by the trailing 12 months interest expense and borrowing-related
       fees, and distributions for perpetual securities. Excluding the distributions for perpetual securities, the interest cover ratio on a trailing 12-month basis (as at 31 December 2021) was 4.4 times.
8   7. The interest cover ratios as at 31 December 2021 and 30 September 2021 are based on a trailing 12-month basis and do not take into account the interim insurance proceeds.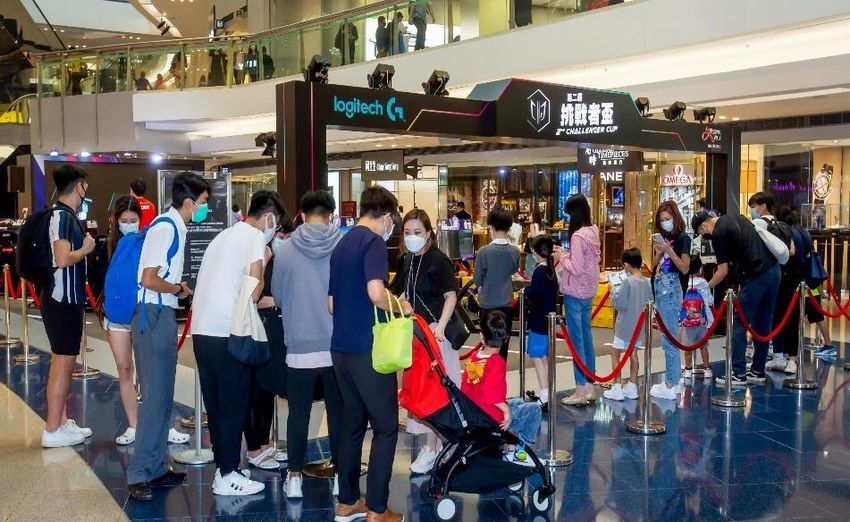
Prudent Capital Management
     Debt Maturity Profile (as at 31 December 2021)                                                                                           ~18%
     •     Total Gross Debt1: S$3,654.2m                                                                                                     Floating-
           (Denomination: ~55% HKD, ~37% JPY,~4% KRW, ~3% SGD,~ 1% RMB)                                                                        Rate
     •     Average Term to Maturity: 2.76 years                                                                       Fixed Rate Notes      Borrowings                                             ~82%
                                                                                                                      Bank Debt2                                    Interest Rate
                                                                                                                                                                                                Fixed-Rate
                  (S$m)                                            813               822                779                                                              Risk
                   800                                                                                                     673                                                                  Borrowings
                                                                    228                39                39                                                         Management
                   600                           468                                                                       101
                   400                            220                                 783                740
                                                                    585                                                    572
                   200         100                248
                    -          100
                                -
                              Mar-22            Mar-23            Mar-24            Mar-25            Mar-26             Mar-27
                                                                                                                                                    ~11%
         % of Total Debt                                                                                                                          Unhedged                                          ~89% of
          Maturing by         3%              13%                22%                  23%               21%                18%                                                                     expected
            End FY
                                                                                                                                                                                                     DI for
                                                                                                                                                                                                    FY21/22
                                                                                                                                                                     Forex Risk
                                                                                                                                                                                                    hedged
         • Healthy liquidity position, comprising committed and uncommitted undrawn                                                                                 Management                     into SGD
           credit facilities of S$723.2 million, and cash and bank balances of S$224.2
           million as at 31 December 2021.

    1. As at 31 December 2021, cross currency interest rate swaps were entered into to swap SGD and HKD denominated medium-term notes to HKD and JPY, and USD and SGD denominated bank loans to
       HKD and JPY. RMB debt relates to onshore debt from acquisition of SP in June 2015. JPY debt relates to debt from acquisition of JP in May 2018, February 2020 and June 2021, and the HK$580 million
       Fixed Rate Notes issued in March 2019 with the swap transaction entered into to swap the HKD fixed interest rate into JPY fixed interest rate. KRW debt and SGD debt refer to onshore debt and offshore
       debt, respectively, from the acquisition of TPG in October 2020.
       Based on exchange rates of S$1= HK$5.7130, S$1 = RMB4.6542, S$1 = JPY 83.1317 and S$1= KRW860.0671.
    2. Includes the proportionate share of KRW onshore borrowings.

9
YTD FY21/22
Portfolio Update
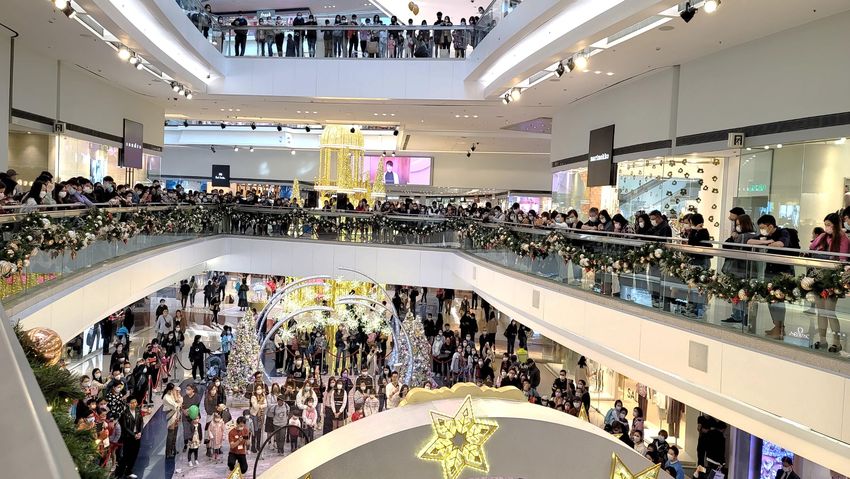
Christmas Celebrations at Festival Walk, Hong Kong SARPortfolio of Commercial Properties in North Asia
Providing Income and Geographical Diversification
(As at 31 December 2021)
13 Properties Festival Walk
in China, Hong Kong SAR1, The Pinnacle Gangnam, Seoul
Japan and South Korea (50% effective interest)
Tokyo Tokyo Tokyo Tokyo Tokyo
S$8.4 billion Gateway Plaza, Beijing South
Korea Japan
Assets under Management2
Yokohama Chiba Chiba Chiba
China
97.5%
[Top] IXINAL Monzen-nakacho Building, Higashi-nihonbashi
Portfolio Occupancy Hong 1-chome Building, TS Ikebukuro Building, Omori Prime
Building, Hewlett-Packard Japan Headquarters Building
Sandhill Plaza, Shanghai Kong [Bottom] ABAS Shin-Yokohama Building, Fujitsu Makuhari
Building, SII Makuhari Building, mBAY POINT Makuhari,
SAR (collectively known as “Japan Properties”)*
*While MNACT holds a 98.47% effective interest in JP, all property and financial-related figures (e.g. gross rental income, net property income, weighted average lease expiry, occupancy, trade sector breakdown and
valuation) stated in this presentation for JP are based on 100.0% effective interest in JP (which includes the 1.53% effective interest in the JP held by Mapletree Investments Japan Kabushiki Kaisha (“MIJ”)).
For TPG, all property figures stated in this presentation are based on MNACT’s 100.0% effective interest in the property, except for gross rental income, net property income and valuation figures, which are based on 50%
effective interest.
1. Where Hong Kong SAR is mentioned in the presentation, it refers to the Hong Kong Special Administrative Region (“SAR”).
2. Includes MNACT’s 50.0% effective interest in TPG, and based on exchange rates of S$1= HK$5.7130, S$1 = RMB4.6542, S$1 = JPY 83.1317 and S$1= KRW860.0671.
11Portfolio Tenant Mix and Top 10 Tenants
(As at 31 December 2021)
Top 10 Tenants by Monthly GRI
Trade Sector by Gross Rental Income (“GRI”) (For the Month of December 2021)
(For the Month of December 2021)
Machinery / Equipment / Manufacturing 14.5% Tenant Building
Financial Institution / Insurance / Banking / Real Estate 11.4%
1. BMW GW
Apparel & Fashion Accessories 10.8%
Information Technology 9.6% 2. Seiko Instruments Inc JP
Food & Beverages 9.1% 3. Hewlett-Packard Japan JP
Automobile 8.7%
4. NTT Urban Development JP
Services 6.5%
Departmental Store & Supermarket 6.5% 5. TaSTe FW
Professional & Business Services 6.3% 6. ARUP FW
Leisure & Entertainment 5.4%
7. Fujitsu JP
Personal Cosmetics 3.9%
Electronics, Houseware & Furnishings 3.7% 8. Festival Grand FW
• No single trade sector Luxury Jewellery,Watches & Accessories 1.8% 9. Apple FW
comprises more than Pharmaceutical / Medical 1.2%
10. Bank of China GW
14.5% of GRI Natural Resources 0.3%
Others 0.3%
Accounted for 37.9% of the portfolio GRI
12Well-Staggered Lease Expiry Profile
Portfolio Lease Expiry Profile by Percentage of Monthly GRI (as at 31 December 2021)
36.9%
21.0% 21.3%
18.9%
16.9%
11.0% 10.5% 11.6%
6.6% 6.2% 6.2% 8.2%
5.1%
1.6% 0.2% 0.0% 0.1% 0.0% 1.9% 1.9% 2.8% 0.2% 2.2% 0.7% 1.7% 1.7% 0.1% 1.9% 0.6% 2.0%
FY21/22 FY22/23 FY23/24 FY24/25 FY25/26 and beyond
FW: Lease Expiry by % of GRI GW: Lease Expiry by % of GRI SP: Lease Expiry by % of GRI
JP: Lease Expiry by % of GRI TPG: Lease Expiry by % of GRI Total
Note: The portfolio lease expiry profile and WALE are based on the expiry dates of committed leases.
Weighted Average Lease Expiry (“WALE”) by GRI (as at 31 December 2021)
Portfolio: 2.5 years1 FW: 2.2 years GW: 1.9 years SP: 2.0 years JP: 3.6 years TPG: 4.5 years
1. The portfolio WALE of 2.5 years as at 31 December 2021 was based on committed leases (leases which have been renewed or re-let as at 31 December 2021), with lease
commencement dates before and after 31 December 2021. Excluding committed leases commencing after 31 December 2021, the portfolio WALE would have been 2.1 years as
at 31 December 2021.
13Update on Festival Walk, Hong Kong SAR
Hong Kong SAR Retail Market
Retail sales in Hong Kong SAR1 from April to November 2021 saw a year-on-year increase of 8.6%.
The phased roll out of the government’s consumption voucher scheme, together with celebrations for Christmas and the New Year, have
brought optimism and an upsurge in business for the Hong Kong retail sector during the last quarter of 2021.
Festival Walk (FW)
Occupancy Rate Average Rental Reversion2,3 Footfall Retail Sales
(For YTD FY21/22) (For YTD FY21/22)
100.0% -32% (retail)
compared to 99.9% 27.7% 20.9%
as at 30 September 2021 n.a (office) year-on-year year-on-year
Improvement in footfall and retail sales as consumption sentiment remained positive amid an economic recovery in Hong Kong SAR and from
the government's consumption voucher scheme to boost spending.
Looking Ahead
The new Omicron variant reported in Hong Kong SAR at the beginning of January 2022 triggered an almost immediate implementation of
short-term tightening measures by the government to bring infection rates under control. While the COVID-19 situation remains fluid and is
expected to affect the performance of retail businesses in the interim, the Manager will remain nimble in executing our strategies.
The Manager’s initiatives to strengthen the mall’s appeal as a lifestyle hub, by gradually shifting our focus from apparel to lifestyle and family-
related trades, will bolster the resilience of the mall.
With these ongoing efforts, FW will be well-positioned for growth when the impact of COVID-19 recedes and when the Hong Kong SAR retail
market recovers.
1. Hong Kong Census and Statistics Department’s “Report on Monthly Survey of Retail Sales for November 2021”. Hong Kong SAR’s retail sales figures for December 2021 have not been published as at 27 January 2022.
2. Average rental reversion is calculated based on the change in the effective rental rates of the new leases compared to the previous leases. It takes into account rent-free periods and step-up rental rates over the lease term
(if any). It excludes rental rates for short-term leases that are less than or equal to 12 months where rental rates are not reflective of prevailing market rents that are on normal lease tenure basis.
3. There were 49 retail leases (renewed or relet for YTD FY21/22) with an average rental reversion of negative 32%.
14Update on Festival Walk, Hong Kong SAR (cont’d)
Update on Insurance Claims1
• In November 2021, the Manager entered into a settlement agreement with
the insurers on the claims for property damage and revenue loss due to
business interruption.
• For property damage, the insurance settlement amount is capital in nature
and is not distributable.
• For revenue loss due to business interruption, the insurance settlement
amount (net of applicable tax) is about S$36.4 million.
• The amount of S$3.5 million, in excess of the distribution top-ups3 of S$32.9
million paid to unitholders in 3Q FY19/20 and 4Q FY19/20, will be
distributed to unitholders as part of the semi-annual distribution for the
period from 1 October 2021 to 31 March 2022.
Completed interior and façade recovery works2
1. Please refer to MNACT’s SGX announcement dated 24 November 2021 titled “Update on Festival Walk Insurance Claim”. resulting from the Festival Walk incident.
2. Repair works arising from the damage incurred during the social incidents in Hong Kong SAR in November 2019.
3. To mitigate the cash flow impact on distributable income when Festival Walk’s mall and office tower were closed with no rental collection, and until such time the loss of revenue is recovered through the
insurance claims, the Manager implemented distribution top-ups, which were paid to Unitholders in 3Q FY19/20 and 4Q FY19/20.
15Festival Walk Mall – Footfall and Retail Sales
Improvement in YTD FY21/22 footfall and sales as consumption sentiment remained positive amid an economic
recovery in Hong Kong SAR and from the government's consumption voucher scheme
October – December retail sales in 2021 (3Q FY21/22) increased by 19.3%, compared to the same quarter in 2020.
April – November retail sales in 2021 has recovered to 82% of April – November 2019 level (prior to mall closure)1.
Monthly Footfall and Retail Sales (Year-on-Year Percentage Change)
Footfall Progressive Further easing of measures
Retail Sales easing of since Apr 2021
Disbursement of
measures since 93.1%
Progressive consumption vouchers
Progressive easing 18 Feb 2021
easing of 4th wave of from the government in
nd measures of measures from 28 COVID-19 Aug 21
2 wave of 67.0%
from 8 May Aug 2020 infections; Re- 65.3%
COVID-19
infections; 2020 tightening of 52.0%
Introduced tight 3rd wave of COVID- measures from 18 38.9%
19 infections; Re- 36.5%
social distancing Nov 2020 29.3% 30.5%
measures from tightening of 47.1% 23.1% 22.0%
restrictive measures 18.3% 21.5% 17.9%
28 Mar2020 9.1% 31.7%
from 11 Jul 2020 24.5% 20.7%
12.8% 9.8% 18.1%
-12.6% -15.1% -11.0% 3.6%
-25.9%
-38.2% -36.1% Mall Closure
-34.9% -33.7% -20.6%
from 13 Nov
-47.4% -28.9% -29.9% 2019 to 15
-36.1% -34.4%
-63.2% -38.0% Jan 2020
-52.7% -46.8%
2 2 2
Apr-20 May-20 Jun-20 Jul-20 Aug-20 Sep-20 Oct-20 Nov-20 Dec-20 Jan-21 Feb-21 Mar-21 Apr-21 May-21 Jun-21 Jul-21 Aug-21 Sep-21 Oct-21 Nov-21 Dec-21
1. The mall was closed from 13 November 2019 to 15 January 2020. To provide the same basis of comparison, retail sales for November included only 1 to 12 November 2021 and the corresponding
period in 2019.
2. To provide the same basis of comparison, footfall and retail sales for November included only 1 to 12 November 2020 and the corresponding period last year, while footfall and retail sales figures in
December 2020 were not included in the chart. Retail sales and footfall for January included only 16 to 31 January 2021 and the corresponding period in 2020.
16Strengthening Festival Walk’s Appeal as a Lifestyle Hub
Shifting Our Focus to Lifestyle and Family-related Trades
Simmons (Bedding)
Jumpin Gym (Indoor amusement centre) O.N.S kapok (Fashion accessories and gifts)
XOVE (Skincare brand)
Twinkle Dance Company Maskology Living
(Dance school) (High-quality masks) sugarfina (Candy boutique)
17A Sparkling Christmas at Festival Walk
Celebrating the Festive Season with Exciting Events, Stage Performances and Marketing Promotions
To kickstart the festive season, HK celebrity Ali Lee visited
Charles K. Kao Foundation Christmas Charity Event
Sparkling decorations within the mall the mall and handmade a Christmas wreath
attended by HK celebrity Kevin Cheng
Upon spending of
Shoppers enjoying the stage performances Gift redemptions were popular among shoppers ≥HK$5,000 in a day at FW
18Exciting Marketing and Promotion Events at Festival Walk
2nd Challenger Cup (Hong Kong SAR Finals), an e-motorsports championship in Asia, was held at the FW mall
‘MyFestival’ loyalty programme members also had the
Finalists in action during the Championship Event garnered the attention of the shoppers chance to experience the e-motorsport
Roadshows and events in 3Q FY21/22 continued to attract shoppers
A learning platform for multiple European languages, The giant train carriage installed at the atrium as
the ‘Speak Dating Event’ remained popular among part of Clarins Roadshow attracted coverage Carshows from Jaguar/ Land Rover (as shown), BMW
shoppers and the student community. from media, KOLs, celebrities and bloggers. and Mini
19Update on the Office Properties in China
Beijing Office Market1 Shanghai Business Parks1
Over the next few years, domestic insurance, wealth Zhangjiang Science City, an innovation hub in Pudong,
management and media companies, and international Shanghai is expected to ride on growing IT and biomedical
tenants in the financial services and media sector will form sectors, where demand is expected to outstrip supply and
the bulk of leasing demand at Lufthansa in line with Beijing’s drive rental growth.
opening up of the services industry.
Gateway Plaza (GW) Sandhill Plaza (SP)
Occupancy Rate Average Rental Office Community Occupancy Rate Average Rental Office Community
Back at the Office Reversion2 Back at the Office
94.5% Reversion2,3
(as at December 2021) 98.6% (as at December 2021)
compared to 95.4% -25% ~80% compared to 99.7% +5% 100%
as at 30 September 2021 as at 30 September 2021
Occupancy rate remained high, compared to the Beijing office SP continued to contribute a steady income stream to MNACT,
vacancy rate of 16.1%4. recording a high occupancy rate and positive average rental
reversion.
Looking Ahead
Rents for Beijing office districts, such as Lufthansa where GW Looking Ahead
is located and which are nearer to the central business district Growth industries and sectors less affected by COVID-19 such
areas where high levels of new supply exist, are expected to as technology and medical focused industries are expected to
remain stable in the near-term and will likely rise in late 2022 or spur leasing demand for offices.
early 20231. For SP, occupancy is expected to remain stable.
1. Colliers International (Hong Kong) Limited (“Colliers”), 30 December 2021.
2. Please refer to footnote 2 on slide 14 for the definition of Average Rental Reversion.
3. There were 18 leases (renewed or relet for YTD FY21/22) with an average rental reversion of negative 25%.
20 4. CBRE, Beijing Office, Q3 2021.Engaging the Tenant Communities
at Gateway Plaza and Sandhill Plaza
Celebrating Christmas at GW and SP Encouraging Healthy Living at SP
A free yoga session was held at the common area
GW: Violin performance at the lobby
enjoyed by the tenants
SP : Tenants took part in the popular SP: Gifts were handed out to tenants at Healthy refreshments were provided to participants
Squid Game “Honeycomb Challenge”. the lobby during Christmas Eve of the yoga session
21Update on the Japan and South Korea Properties
Tokyo Office Market1 Seoul Office Market1
Resilient demand expected for offices in decentralised and The Gangnam Business District (“GBD”) office sector continues
suburban areas given relatively low new supply and rental cost to outperform given strong demand and no new supply.
differentials compared to Tokyo 5 wards. With rapid growth in online businesses and strong financial
backing, tech companies are emerging as big players with
increasing importance in the office sector, especially in the GBD.
Japan Properties The Pinnacle Gangnam
Office Community Office Community
Occupancy Rate2 Average Rental Occupancy Rate Average Rental
Back at the Office Back at the Office
Reversion3 Reversion3,4
97.8% (as at December 2021) 97.7% (as at December 2021)
compared to 97.8% +1% Between 56% - 91% compared to 97.7% +28% ~70%
as at 30 September 2021 (except for two properties with as at 30 September 2021
less than 56%)
• The performance of the Japan Properties remained • Positive average rental reversion from the property with a
resilient with a positive average rental reversion. high occupancy rate.
Looking Ahead Looking Ahead
The performance of the Japan Properties is expected to • Performance of TPG is expected to remain resilient due to
remain resilient with high occupancy levels. the attractive market dynamics and built-in rental
escalations.
1. Colliers, 30 December 2021.
2. All Japan Properties except mBAY POINT Makuhari (“MBP”) registered full occupancy as at 31 December 2021. The occupancy rate of MBP was 92.6%.
3. Please refer to footnote 2 on slide 14 for the definition of Average Rental Reversion.
4. There were 3 leases (renewed or relet for YTD FY21/22) that contributed to the rental reversion of 28%.
22Commitment to
Sustainability
Solar Panels at Festival WalkAchieved Highest Green Building Rating for
5 Japan Properties in 3Q FY21/22
Testament to the Buildings’ Excellent Environmental Features and Energy Efficiency
Five Japan Properties (listed below) received the “S” (Excellent) rating, the highest
rating from Comprehensive Assessment System for Built Environment Efficiency
(“CASBEE”), a widely adopted green certification system in Japan.
Omori Prime Building, Hewlett-Packard Japan Fujitsu Makuhari Building, SII Makuhari Building, mBAY POINT Makuhari,
Tokyo Headquarters Building, Tokyo Chiba Chiba Chiba
24Proposed Merger with MCT
Transformative Merger Combining Strength and Growth
Creating a flagship commercial REIT that provides stability and scale across key gateway markets of Asia
Largest pure-play Singapore commercial REIT with First and only North Asia focused REIT listed in Singapore, with
longstanding track record in delivering stable returns to properties in key gateway markets including
Festival Walk, Hong Kong SAR
MBC, Singapore
unitholders China, Hong Kong SAR, Japan and South Korea
Strength Growth
VivoCity, Singapore Mapletree Pan Asia Commercial Trust (“MPACT”) Gateway Plaza, Beijing
18 commercial
properties S$17.1bn1 11.0m sq ft
across five key gateway Assets Under Net Lettable Area
markets of Asia Management
mTower, Singapore
Sandhill Plaza, Shanghai
Rationale and Key Benefits of the Merger
Creates a proxy to key gateway markets of Asia
Mapletree Anson, Anchored by high quality and diversified portfolio
Singapore
Leapfrogs to one of Asia’s ten largest REITs 9 properties, Greater Tokyo
Well-placed to pursue growth opportunities through a ready platform
Attractive financial benefits to Unitholders of both MCT and MNACT
MLHF, Singapore Strong and continued support from Sponsor
The Pinnacle Gangnam, Seoul
This slide should be read in conjunction with the joint announcement released by MNACT and MCT on 31 December 2021 (in relation to the proposed merger of MNACT and MCT).
26 1. Assets under Management (“AUM”) are based on the latest available independent valuations. MCT's AUM is as of 30 September 2021 and MNACT's AUM is as of 31 October 2021.Thank You
Appendix
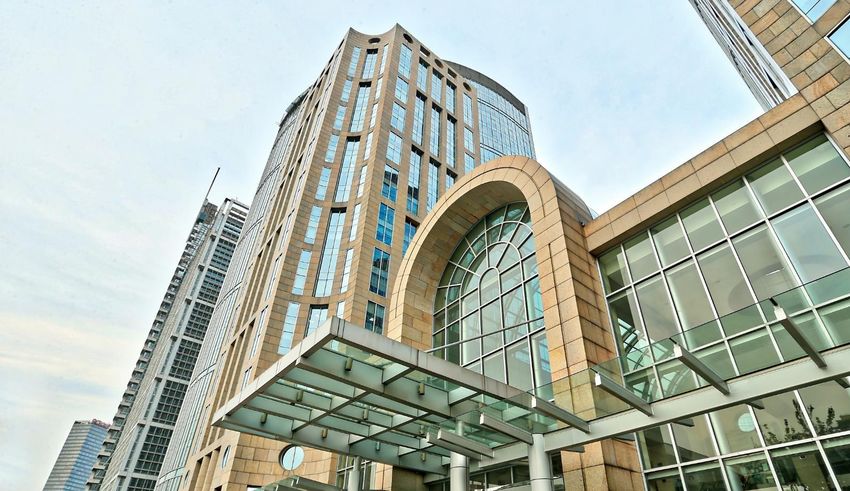
Gateway Plaza, BeijingOverview of Mapletree North Asia Commercial Trust (“MNACT”)
Singapore’s first commercial REIT with properties in China, Hong Kong SAR, Japan and South Korea
(listed since 7 March 2013)
Trust Structure
Investment Mandate
Sponsor
Public
To invest in a diversified portfolio of Mapletree Investments Unitholders
Pte Ltd (“MIPL”)
income-producing real estate used South Korea
38% 62%
primarily for commercial purposes 100%
located in Greater China, Japan and REIT Manager Trustee
South Korea. Mapletree North Asia DBS Trustee
Commercial Trust Limited
Key markets include Tier-1 cities Management Ltd. (the “Trustee”)
(Beijing, Shanghai, Guangzhou and
Shenzhen) and key Tier-2 cities in
100%
China, in Hong Kong SAR, in Japan
and in South Korea.
Property Manager
Mapletree North Portfolio
Asia Property
S$3.9b S$8.4b 38% Management
Limited
Festival Walk
Gateway Plaza
Market Assets under Unitholdings held by Sandhill Plaza
Japan Properties
Capitalisation1 Management2 Sponsor3 The Pinnacle Gangnam
1. Based on unit closing price of S$1.11 on 27 December 2021 (MNACT’s last trading day for YTD FY21/22).
2. Includes MNACT’s 50.0% effective interest in TPG, and based on exchange rates of S$1= HK$5.7130, S$1 = RMB4.6542, S$1 = JPY 83.1317 and S$1= KRW860.0671.
3. As at 31 December 2021.
29Diversified Portfolio of Quality Commercial Assets
Festival Walk, Gateway Plaza, Sandhill Plaza, Japan Properties, The Pinnacle Gangnam,
Hong Kong SAR Beijing, China Shanghai, China Greater Tokyo Seoul
One of the largest malls in A Grade-A office building, A Grade-A business park Nine Freehold Properties in Freehold Grade-A office
Hong Kong SAR, and nestled located in Lufthansa Area development located in Tokyo, Chiba and Yokohama. building, located at Hakdong-
in the local catchment area of (Third Embassy Area) in Zhangjiang Science City in ro, Gangnam-gu in Seoul.
Kowloon Tong. Beijing. Pudong New Area.
• Year of Acquisition: • Year of Acquisition: • Year of Acquisition: • Year of Acquisition: • Year of Acquisition:
2013 (IPO) 2013 (IPO) 2015 2018 (6 assets), 2020 (2 2020
• Net Lettable Area: • Net Lettable Area: • Net Lettable Area: assets), 2021 (1 asset) • Net Lettable Area:
74,461 sqm 106,456 sq m 63,284 sq m • Net Lettable Area: 24,650 sq m
Retail (73%), Office (27%) Office (89%), Podium (11%) Office (97%), Amenities (3%) 282,522 sq m – Based on 100% interest
• Property Value1: • Property Value1: • Property Value1: • Property Value1: • Property Value1:
HK$25,565m RMB6,353m RMB2,427m JPY144b KRW245b– 50.0% interest
• % Contribution to AUM • % Contribution to AUM • % Contribution to AUM • % Contribution to AUM • % Contribution to AUM
54% 16% 6% 21% 3%
• Occupancy (as at 31 Dec 2021) • Occupancy (as at 31 Dec 2021) • Occupancy (as at 31 Dec 2021) • Occupancy (as at 31 Dec 2021) • Occupancy (as at 31 Dec 2021)
100.0% 94.5% 98.6% 97.8% 97.7%
1. Based on valuations performed by independent valuers as at 31 October 2021.
30Continue to Pursue Diversification of Portfolio to Reduce
Geographical and Income Concentration
Investing In Assets Across Diversified Markets In China, Hong Kong SAR, Japan And South Korea To Deliver
Sustainable Returns
Initial Public Offering (“IPO”)
7 March 2013
End FY15/16 End FY18/19 End FY19/20 End FY20/21 As at 31 Dec 2021
Assets Under
Management
S$5.9b S$7.6b S$8.3b S$7.9b1 S$8.4b
S$4.3b
7 March 2013 (IPO) 17 June 2015 25 May 2018 28 February 2020 30 October 2020 18 June 2021
Completed acquisition Completed acquisition of 6 Completed acquisition of 2 Completed acquisition Completed acquisition
Mapletree Greater China freehold office properties of 50% interest in The of Hewlett-Packard
of Sandhill Plaza in freehold office properties
Commercial Trust (“MGCCT”) located in Greater Tokyo. Pinnacle Gangnam, a Japan Headquarters
Shanghai. located in Greater Tokyo.
was listed on SGX-ST with freehold office property Building, a freehold
two assets, Festival Walk in Seoul. office property in
and Gateway Plaza. Tokyo.
With effect from 25 May
2018, MGCCT was renamed
Mapletree North Asia
Commercial Trust.
1. The independent valuation of MNACT’s 11 properties (FW, GW, SP and the eight JP) was S$7.6 billion as at 31 March 2021, 8.1% lower compared to 31 March 2020. This was largely due to lower market
rents assumed by the valuers for FW and GW as a result of the impact of COVID-19 on the properties’ performance, as well as the net translation loss (against SGD) from the weaker HKD and JPY, partially
offset by the stronger RMB. TPG was acquired on 30 October 2020. Including the valuation of MNACT’s 50% effective interest in TPG of S$272 million, MNACT’s portfolio valuation amounted to $7.9 billion.
31Strong Alignment with Unitholders
Management is incentivised to deliver sustainable and quality DPU growth.
• First S-REIT with no AUM-based fee structure
• Performance-based feature incentivises the Manager to grow DPU
Management Fee Structure
REIT Base Fee: 10.0% of Distributable Income1
Management Fee Performance Fee: 25.0% of the difference in DPU in a financial year with the DPU in the preceding financial year2 multiplied by the weighted average
number of Units in issue for such financial year.
The Performance Fee is payable if the DPU in respect of any financial year exceeds the DPU in the preceding financial year, notwithstanding that the DPU
in such relevant financial year may be less than the DPU in the financial year prior to the preceding financial year.
As announced on 25 September 20203, the Manager will waive its entitlement to any performance fee as provided under the Trust Deed
(“Performance Fee”) until such time that the DPU exceeds 7.124 cents (“Threshold DPU”), which was the DPU achieved in FY19/20, prior to
the full year impact of COVID-19
Upon MNACT’s DPU performance exceeding the Threshold DPU, the waiver will cease (and the Threshold DPU will no longer be applicable) in
subsequent years, and the Manager will continue to be entitled to receive the Performance Fee in accordance with the Trust Deed.
100% paid in units since listing
Property 2.0% of Gross Revenue
Management Fee 2.0% of Net Property Income
PM fees relating to Festival Walk and Gateway Plaza: 100% paid in units since listing
PM fees relating to Sandhill Plaza, Japan Properties and The Pinnacle Gangnam: 100% paid in cash4
Acquisition Fee 0.75% for acquisitions from Related Parties
1.0% for all other acquisitions
1. In relation to the Japan Properties, the asset management services are provided by the Japan Asset Manager. In view of the fees payable in cash to the Japan Asset Manager for the Japan Properties, the Manager has
elected to waive the Base Fee (which it is otherwise entitled to under the Trust Deed) for as long as the Manager and the Japan Asset Manager are wholly-owned by Mapletree Investments Pte Ltd and the Japan Asset
Manager continues to receive the Japan Asset Management Fee in respect of the Japan Properties.
2. Calculated before accounting for the performance fee in each year.
3. Please refer to MNACT’s SGX-ST announcement dated 25 September 2020 titled “A) Acquisition of 50.0% Interest in an Office Building Known as “The Pinnacle Gangnam” located In Seoul, Korea and B) Manager to Waive
Entitlement to Performance Fees”.
4. For Sandhill Plaza, the Manager has elected to pay the Property Manager the Property Management Fee in cash from the date of acquisition on 17 June 2015. For six of the Japan Properties (MON, HNB, TSI, ASY, SMB
and FJM) acquired on 25 May 2018, two of the Japan Properties (Omori and MBP) acquired on 28 February 2020, and HPB acquired on 18 June 2021, the Property Management Fee is payable in cash to the Japan
Property Manager from the date of their acquisitions. For The Pinnacle Gangnam, the Manager has elected to pay the Korea Property Manager the Property Management Fee in cash.
32You can also read