Asia's First U.S. Grocery-Anchored Shopping Center & Self-Storage REIT - Investor Presentation - CGS-CIMB ProsperUs Webinar

Page created by Roy James
 
CONTINUE READING
Asia's First U.S. Grocery-Anchored Shopping Center & Self-Storage REIT - Investor Presentation - CGS-CIMB ProsperUs Webinar
Asia’s First U.S. Grocery-Anchored Shopping Center
                  & Self-Storage REIT
      Investor Presentation – CGS-CIMB ProsperUs Webinar
                         5 October 2022
Asia's First U.S. Grocery-Anchored Shopping Center & Self-Storage REIT - Investor Presentation - CGS-CIMB ProsperUs Webinar
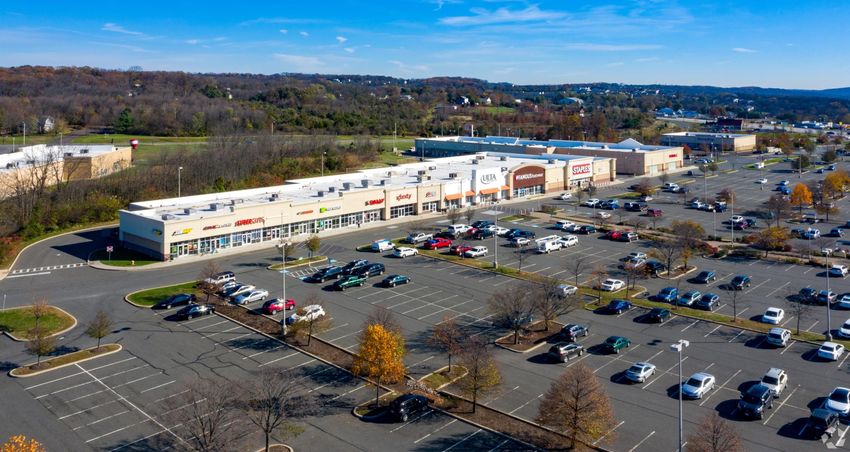
Important Notice
This presentation is for information only and does not constitute or form part of an offer, invitation or solicitation of any offer to purchase or subscribe for the
Units in Singapore or any other jurisdiction nor should it or any part of it form the basis of, or be relied upon in connection with, any contract or commitment
whatsoever.

The value of the Units and the income derived from them may fall as well as rise. The Units are not obligations of, deposits in, or guaranteed by UHREIT, United
Hampshire US REIT Management Pte. Ltd., Perpetual (Asia) Limited, as trustee of UHREIT, or any of their respective affiliates.

An investment in the Units is subject to investment risks, including the possible loss of the principal amount invested. The holders of Units have no right to
request that the Manager redeem or purchase their Units while the Units are listed. It is intended that holders of Units may only deal in their Units through
trading on the Singapore Exchange Securities Trading Limited (“SGX-ST”). Listing of the Units on the SGX-ST does not guarantee a liquid market for the Units.

This presentation may contain forward-looking statements that involve assumptions, risks and uncertainties. Actual future performance, outcomes and results
may differ materially from those expressed in forward-looking statements as a result of a number of risks, uncertainties and assumptions. Predictions,
projections or forecasts of the economy or economic trends of the markets are not necessarily indicative of the future or likely performance of UHREIT. The
forecast financial performance of UHREIT is not guaranteed. A potential investor is cautioned not to place undue reliance on these forward-looking statements,
which are based on the Manager's current view of future events. The past performance of UHREIT is not necessarily indicative of its future performance.
Asia's First U.S. Grocery-Anchored Shopping Center & Self-Storage REIT - Investor Presentation - CGS-CIMB ProsperUs Webinar
Table of Contents

           Page   Content

             4      Introduction

                    Trends of U.S. Grocery and
             8
                    Necessity Retail Market

            11      1H 2022 Key Highlights

            16      1H 2022 Financial Results

            20      Portfolio Update

            26      Outlook

            31      Investment Merits
Asia's First U.S. Grocery-Anchored Shopping Center & Self-Storage REIT - Investor Presentation - CGS-CIMB ProsperUs Webinar
Introduction

Upland Square, Pennsylvania

                                             4
Asia's First U.S. Grocery-Anchored Shopping Center & Self-Storage REIT - Investor Presentation - CGS-CIMB ProsperUs Webinar
Introduction
 United Hampshire US REIT Journey Since its Listing
                       UHREIT’s Unique Positioning – Fulfilling the Evolving Essentials Needs of U.S. Consumer

                                                                                       Resilience Portfolio located in the U.S.
                Asia’s First U.S. Grocery-                                             •  Stabilised income-producing                                                   Tenants are generally
                Anchored Shopping Center                                                  grocery-anchored, necessity-                                                  considered cycle agnostic
                and Self-Storage REIT                                                     based retail properties                                                       and e-commerce resistant
                                                                                       •  Modern climate-controlled self-
                                                                                          storage facilities

                                                                                                                   2020                               2021                   2022
                                                                                                                                            Nov 2021 –                June 2022 –
                                                                                                                                            Completed maiden          Completed divestment
                                                                                                                                            acquisitions of two       of two Self-Storage
                                                                                                                                            dominant grocery-         Properties, Elizabeth
                                                                                                                                            anchored assets,          and Perth Amboy
                                                                                                                                            Colonial Square and
                                                                                                                                                                      July 2022 – Completed
                                                                                                                                            Penrose Plaza
                                                                                                                                                                      3rd yield accretive
                                                                                                                                                                      acquisition, Upland
                                                                                                                                                                      Square
                                                                                                    IPO                                                                                  Current
                                                                                        US$584.6 million AUM1                                 AUM increased                     US$732.9 million AUM2
                                                                                  18 Grocery & Necessity Properties                           by 25.4 %                    21 Grocery & Necessity Properties
Listed on the Main Board of the Singapore Exchange                                    4 Self-Storage Properties                                                                2 Self-Storage Properties
    Securities Trading Limited on 12 March 2020                                               6 States                                                                                 8 States
                                                                                         3.2 million sq ft                                                                        3.8 million sq ft
           1.   As at 12 March 2020.
           2.   Based on carrying value of investment properties as at 30 June 2022 and included Upland Square Shopping Centre, which was acquired on 28 July 2022.
                                                                                                                                                                                                           5
Asia's First U.S. Grocery-Anchored Shopping Center & Self-Storage REIT - Investor Presentation - CGS-CIMB ProsperUs Webinar
Introduction
                   23 Assets Across 8 States Focused on the East Coast                                                                                                MASSACHUSETTS – G&N

                                                                                                                                                                          Name              City           %1
 NEW YORK – G&N
                                                                          NEW YORK                                                             MASSACHUSETTS           BJ's Quincy         Quincy          5.4
        Name                  City           %1                                                                                                Grocery & Necessity
                                                                          Grocery & Necessity                                                                        Fairhaven Plaza     Fairhaven         3.0
 Hudson Valley Plaza        Kingston         7.6                                                                                               2 Properties
                                                                          7 Properties                                                         165,445 sq ft
Garden City Sq. - BJ’s                                                    1,137,375 sq ft
                       Garden City           7.4                                                                                                                      NEW JERSEY – G&N
     Wholesale
   Albany ShopRite                                                                                                                                                        Name              City           %1
                             Albany          3.7
     Supermarket
                                                                                                                                                                        Lawnside
 Garden City Sq. - LA                                                                                                                                                                    Lawnside          5.3
                          Garden City        3.3                                                                                            NEW JERSEY                  Commons
      Fitness
                                                                                                                                            Grocery & Necessity        Stop & Shop      Piscataway         4.0
 Price Chopper Plaza        Warwick          3.2
                                                                                                                                            4 Properties                Wallington
                                                                                                                                            421,270 sq ft                                Wallington        2.5
Wallkill Price Chopper     Middletown        2.0                          PENNSYLVANIA                                                                                  ShopRite
Albany ShopRite Gas                                                       Grocery & Necessity                                               Self-Storage             Towne Crossing      Burlington        1.9
                             Albany          0.7
       Station                                                            2 Properties                                                      2 Properties
                                                                          659,168 sq ft                                                     155,093 sq ft             NEW JERSEY – SS
 PENNSYLVANIA – G&N

    Name                   City              %1                                                                                                                          Name              City            %1

                                                                                                                                        MARYLAND                        Millburn         Millburn          3.8
Penrose Plaza         Philadelphia           8.5
                                                                                                                                        Grocery & Necessity             Carteret         Carteret          3.4
Upland Square2           Pottstown           N.A.                                                                                       2 Properties
                                                                                                                                        542,280 sq ft
                                                                          NORTH CAROLINA                                                                              MARYLAND – G&N
 NORTH CAROLINA – G&N
                                                                          Grocery & Necessity                                                                             Name               City          %1
     Name                  City              %1                           1 Property
                                                                          182,925 sq ft                                                 VIRGINIA                      Arundel Plaza      Glen Burnie       7.0
Lynncroft Center        Greenville           3.9
                                                                                                                                        Grocery & Necessity          Parkway Crossing     Parkville        4.3
 FLORIDA – G&N                                                                                                                          1 Property
                                                                                                                                        168,326 sq ft
     Name                 City              %1                                                                                                                        VIRGINIA – G&N
                                                                                            FLORIDA
St. Lucie West     Port St. Lucie           13.6                                                                                                                          Name               City           %1
                                                                                            Grocery & Necessity
Big Pine Center      Big Pine Key           1.4                                             2 Properties                                                             Colonial Square    Colonial Heights    4.1
                                                                                            411,473 sq ft

                                       1.    Based on carrying value of investment properties as at 30 June 2022.
                                       2.    The Upland Square acquisition closed on 28 July 2022 after the 1H 2022 reporting period.
                                                                                                                                                                                                                  6
Asia's First U.S. Grocery-Anchored Shopping Center & Self-Storage REIT - Investor Presentation - CGS-CIMB ProsperUs Webinar
Introduction
     Reputable Sponsors – UOB Global Capital & The Hampshire Companies LLC

                                                                                               >60 year track record
    A Synergistic
Long-Term Partnership                               >20 year track record                      150 properties
10   year partnership                               US$2.9b        AUM
                                                                                               US$2.0b AUM
3 co-managed funds                                                                             >11 million sq ft retail space acquired/developed
3 co-investment                        • Asset management subsidiary of UOB            • 3rd generation US property specialists
   managed portfolios                  • UOB co-invests alongside LPs, and provides    • Intensive, hands-on experience in real estate
                                             the resources of its extensive platform      investment, asset management and enhancement

                                       • Offices in the US, Europe and Asia Pacific    • Diversified investment platform and derives results
                                                                                          from its broad experience in multiple commercial
                                                                                          real estate asset classes, including industrial,
                                                                                          retails, self-storage, office, industrial and multifamily

              Information as at 31 December 2021.
                                                                                                                                                      7
Asia's First U.S. Grocery-Anchored Shopping Center & Self-Storage REIT - Investor Presentation - CGS-CIMB ProsperUs Webinar
Trends of
 U.S. Grocery
and Necessity
Retail Market

                Upland Square, Pennsylvania

                                          8
Asia's First U.S. Grocery-Anchored Shopping Center & Self-Storage REIT - Investor Presentation - CGS-CIMB ProsperUs Webinar
Trends of U.S. Grocery and Necessity Retail Market
New Economy Omnichannel Retailing – Key to Success
                                                                                    Curbside Pick-up                           Orders Filled for Customers
            Buy in Store

                           Curbside Pickup
                            for Online/App
                                Orders

                                                        •      Retailers with a physical store presence have experienced stronger online sales because physical
                                                               store networks make returns/exchanges easier for consumers, while reducing re-merchandising
                                                               costs1

                               Buy Online Pickup        •      Digitally native companies, including Amazon, are seeking out physical locations to create more
                                                               experiential touchpoints for consumers and to address the rising cost of acquiring customers
 Physical                       in Store (BOPIS)               through online channels1
  Store
 Network                                                •      The plateauing of e-commerce’s portion of overall retail sales in 2021 suggests a renewed balance
                                                               between online and physical store sales1

                                                        •      Evolving Trend: March 2022 was the first month since the pandemic which e-commerce sales
                                                               declined from the same period a year earlier. The drop in online spending was 3.3%, the first year-
                           Micro-Fulfilment of                 over-year decline since November 2013. The rise for bricks-and-mortar sales was 11.2% during the
                                                               same period2
                           Online/App Orders
                                                        •      The number of shoppers using buy-online-pickup-in-store (BOPIS) services “all the time” fell by a
                                                               third — from 45% to 32% — last year and stands to shrink further in 2022. In-store shopping
                                                               remains the dominant channel for purchases of consumer goods and looks to grow further in 2023,
                                                               according to Syracuse, N.Y.-based Chase Design3
             Consumers to Return/
                                                   1.       Cushman & Wakefield Research.
               Exchange Goods                      2.       Wall Street Journal, 16 April 2022.
                                                   3.       Supermarket News, 22 July 2022 - Study: Online Grocery Shifts From Need to Convenience.
                                                                                                                                                                     9
Asia's First U.S. Grocery-Anchored Shopping Center & Self-Storage REIT - Investor Presentation - CGS-CIMB ProsperUs Webinar
Trends of U.S. Grocery and Necessity Retail Market
Brick and Mortar Sales Outpaced Ecommerce Growth
                   U.S. Retail Sales Year-over-Year Growth1

                                                                  While sales are starting to decline from the peaks
                                                                  reached in 2021, Brick & Mortar sales have
                                                                  continued to outpace ecommerce growth as
                                                                  demonstrated in 1Q 2022

                                                                              Price Chopper Plaza, New York

     1.   Green Street Strip Center Sector Update, 3 June 2022.
                                                                                                                       10
1H 2022
                                Key Highlights

Price Chopper Plaza, New York

                                                 11
1H 2022 Key Highlights
Record High 1H 2022 Distributable Income, an Increase of 7.2% Year-on-Year

                                                                                       Proactive Portfolio                                                Strong Financial
         Resilient Portfolio                                                                                                                                Performance
                                                                                          Management
                                                                        ✓      Completed the sale of Elizabeth and
                                                                               Perth Amboy Self-Storage on 22nd
                                                                                                                                               ✓   1H 2022 Distributable Income (“DI”)
                                                                               June 2022 at a premium to valuation
✓   High portfolio occupancy of 96.2%1                                                                                                             increased 7.2% year-on-year due to
                                                                                                                                                   positive contribution from two newly
                                                                        ✓      Completed 3rd yield accretive
✓   Long WALE of 8.0 years2                                                                                                                        acquired grocery-anchored freehold
                                                                               acquisition of Upland Square on 28th
                                                                                                                                                   assets – Colonial Square and
                                                                               July 2022, achieving a quick recycling
✓   67.5% of rents generated from cycle-                                                                                                           Penrose Plaza
                                                                               of Self-Storage sale proceeds into a
    agnostic tenants that provide
                                                                               higher yielding stabilized Grocery and
    essential, non-discretionary goods                                                                                                         ✓   Conservative gearing at 38.0% with
                                                                               Necessity Property
    and services to the U.S. consumers                                                                                                             80.5% fixed-rate debt
                                                                        ✓      Minimal lease rollover with only 0.8%
                                                                                                                                               ✓   High dividend yield of 9.5%4
                                                                               and 4.0% expiring for the balance of
                                                                               2022 and 2023, respectively3

           1.   As at 30 June 2022. Computation included forward committed leases for Grocery and Necessity Properties.
           2.   Computation included forward committed leases. Excluding forward committed leases, the WALE is 8.0 years as at 30 June 2022.
           3.   Based on base rental income of Grocery & Necessity Properties for the month of June 2022.
           4.   Based on 2H 2021 and 1H 2022 total distribution of US5.96 cents and unit price as at 31 August 2022 of US$0.625.
                                                                                                                                                                                          12
1H 2022 Key Highlights
1H 2022 Performance Remained Resilient

                Financials                                                           Asset Management                                                             Capital Management

                   US$22.6 million                                                                          96.2%                                                                          80.5%
                 Net Property Income                                                           Committed          Occupancy1                                                         Fixed-Rate Debt
              Vs 1H 2021: US$20.5 million                                                       Vs 31 Mar 2022: 96.4%

                   US$16.3 million                                                                       8.0 years                                                                         38.0%
                 Distributable Income                                                       Forward Committed                WALE2                                               Aggregate Leverage
   c          Vs 1H 2021: US$15.2 million                                                    Vs 31 Mar 2022: 7.8 years

       Distribution Per Unit                                             Adjusted Distribution Per Unit3
                                                                                                                                                                                        6.0 times
                2.91 US cents                                                                  2.88 US cents                                                                  Interest Coverage Ratio4
            Vs 1H 2021: 3.05 US cents                                                    Vs 1H 2021: 2.54 US cents

        1H 2022 Adjusted Distribution Per Unit Increased 13.4% y-o-y
       1.    As at 30 June 2022. Grocery & Necessity Properties only.
       2.    Computation included forward committed leases. Excluding forward committed leases, the WALE is 8.0 years as at 30 June 2022.
       3.    Adjusted DPU excludes Top-Ups and Stipulated Damages.
       4.    Interest coverage ratio as at 30 June 2022 was 6.0 times in accordance with the requirements under its loan facilities and 4.6 times in accordance with the Property Funds Appendix of the
             Code on Collective Investment Schemes.
                                                                                                                                                                                                          13
1H 2022 Key Highlights
Opportunistic Divestment and Recycling of Capital into Higher Yielding Assets

                                                                                                            Transaction Details
          Elizabeth Self-Storage                   Perth Amboy Self-Storage

                                                                                        +17.7%         +4.9%            +2.5%              $45.5m

                                                                                                       $43.4m
                                                                                                                        $44.4m
                                                                                                       Top-Up:
                                                                                                        $4.7m

•   Completed divestment of 2 Self-Storage Properties, Elizabeth and Perth Amboy
    Self-Storage at an aggregate price of US$45.5m                                       Purchase
       o 2.5% over the appraised value of US$44.4m                                       Price Excl.
                                                                                          Top-Up:
       o 17.7% above purchase price of US$38.7m                                           $38.7m
•   Opportunity created by the high investment demand for best-in-class self-
    storage facilities
•   Opportunity to realize profits and reinvest into higher yielding grocery anchored
    assets
                                                                                        Purchase Price                Independent         Divestment
•   The divestment was completed on 22nd June 2022                                                                 Valuations as of 31   Consideration
                                                                                                                        Dec 2021

                                                                                                                                                         14
1H 2022 Key Highlights
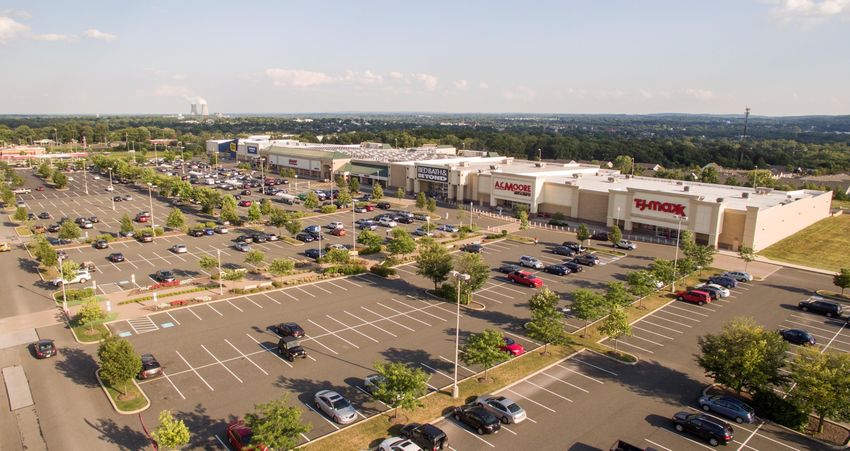
    3rd Yield Accretive Acquisition – Grocery-anchored Freehold Asset - Upland Square
                                  Upland Square Shopping Center, Pennsylvania

                                                                                                                            Enlarged Portfolio Value
                                                                                                                                 (US$ million)

                                                                                                                                                  +13.2%

•   Acquired Upland Square Shopping Center in Pottstown, Montgomery County, Pennsylvania for US$85.7m                        +10.7%
                                                                                                                                                                 732.9
•   DPU accretive acquisition; implied capitalization rate is 6.5%

•   Enhances portfolio scale and significantly increases portfolio net property income                                                       647.2
•   Funded by the proceeds from the divestment of Elizabeth & Perth Amboy Self-Storage and the assumption
                                                                                                                        584.6
    of an existing 3.62% fixed-rate loan that matures in 2026
                                                                                                                               1                       2                    3
•   Strategically positioned with limited competition and barriers to entry for new retail development                    IPO              Existing            Enlarged

•   Improves portfolio diversification and income resilience, while reducing tenant concentration risk
                                                                                                            1.   As at 12 March 2020.
•   The acquisition was completed on 28th July 2022                                                         2.   As at 30 June 2022.
                                                                                                            3.   As at 30 June 2022, as if the Acquisition was completed on 30 June 2022.

                                                                                                                                                                                     15
1H 2022
Financial Results

                    Colonial Square, Virginia

                                           16
1H 2022 Financial Results
   1H 2022 Financials VS 1H 2021 Financials

Gross Revenue                               Net Property Income                    Distributable Income              Distribution Per Unit (DPU)
 (US$ million)                                  (US$ million)                          (US$ million)                         (US cents)

                                                                                                                    DPU                 Adjusted DPU1

       +18.5%                                        +10.6%                                   +7.2%                 -4.6%                    +13.4%

                 31.8
                                                                     22.6                                    3.05           2.91
                                                                                                      16.3                                         2.88
                                              20.5                                     15.2                                           2.54
26.8

                                                                             1H 2021            1H 2022

                1.   Adjusted DPU excludes Top-Ups and Stipulated Damages.
                                                                                                                                                          17
1H 2022 Financial Results
Prudent Capital Management to Mitigate Exposure to Interest Rate Fluctuations
          Debt Maturity Profile as at 30 Jun 2022                                                                     Borrowings (%)
                      (US$ million)
                         137.6
                                                                                                                                                                                   Sensitivity to
                                               2.0 years                                                                  19.5%                                                    LIBOR/SOFR1
               94.5
                                          Weighted Average
                                                                                                                                                                                  Every +50bps in
                                           Debt Maturity
                                                                                                                                             2                                     LIBOR/SOFR
                                                                                                                                    80.5%
                                                                            40.0                                                                                              translates to 0.048
                                                                                                                                                                              US cents in DPU p.a.

                                                                                                               Fixed Rates             Floating Rates
   2022        2023       2024        2025         2026        2027        2028
                                                                                                              Debt Summary as at 30 Jun 2022
                                                                                                              Aggregate Leverage                                                         38.0%
          •     Interest rate risk substantially mitigated with
                80.5% fixed-rates                                                                             Interest Coverage Ratio                                                 6.0 times3
          •     Actively engaging potential lenders on
                                                                                                              Weighted Average Interest Rate                                              3.0%
                refinancing of term loans
                                                                                                              Undrawn Committed RCF                                               US$17.0 million

          1.   Based on the 19.5% floating debt and revolver facility drawn which are unhedged and the total number of Units in issue as at 30 June 2022.
          2.   Includes floating-rate loans that have been swapped to fixed rate.
          3.    Interest coverage ratio as at 30 June 2022 was 6.0 times in accordance with the requirements under its loan facilities and 4.6 times in accordance with the Property Funds Appendix of the
                Code on Collective Investment Schemes.
                                                                                                                                                                                                             18
1H 2022 Financial Results
Attractive Dividend Yield and Price-to-Book Ratio

                                                          Comparative Yields (%)                                                                Price-to-Book Ratio (times)

     9.5%                                                                                                                                                  0.82
                                                                                                                                    380bps

                                        660bps                          640bps                          540bps

                                                                                                                                5.8%

                                                                                                  4.2%

                                  3.0%                            3.2%

             1                                                                                              3                               4                      5
    UHREIT               Singapore 10-year             US 10-year Treasury                     STI Yield                     FSTREI Yield                 UHREIT
                          Govt Bond Yield 2                   Yield 2

       Sources: FTSE Russell, Monetary Authority of Singapore and U.S. Department of Treasury.
       1. Based on 2H 2021 and 1H 2022 total distribution of US5.96 cents and unit price as at 31 August 2022 of US$0.625.
       2. As at 31 August 2022.
       3. Average 12-month gross dividend yield of Straits Times Index as at 31 August 2022.
       4. Average 12-month gross dividend yield of FTSE Straits Times REIT Index as at 31 August 2022.
       5. Based on NAV of US$0.76 as at 30 June 2022 and unit closing price of US$0.625 as at 31 August 2022.
                                                                                                                                                                              19
Portfolio
                                 Update

Hudson Valley Plaza, New York

                                            20
Portfolio Update
 Significant Leasing Progress with Minimal Rollover Exposure in 2022 and 2023
     Delivered significant leasing progress in 1H 20221                                                                                                 Carteret Self-Storage
                                                                                                                                          95.8         92.1                      92.5          94.7
                                                                                                                             100                                                                            25
     • 6 new leases were signed totalling 36,744 sq ft                                                                                                              88.1

     • 7 leases were renewed totalling 113,268 sq ft                                                                           80
                                                                                                                                                                                               22.6
                                                                                                                                                                                 21.6                       20
     • Occupancy of Self-Storage properties, Millburn and Carteret,                                                            60
       stood at 97.5% and 94.7%                                                                                                                                     18.9
                                                                                                                               40                      18.2
                                                                                                                                          17.3
                                                                                                                                                                                                            15
                                                                                                                               20
                               Lease Maturity Profile2
                                                                                                                                0                                                                           10
                                                                                                78.9%                                 30-Jun-21      30-Sep-21   31-Dec-21    31-Mar-22     30-Jun-22

                                                                                                                                        Occupancy (%)         Average Quarterly Net Rental Rate (US$/psf)
Minimal leasing risk,
  only 0.8% lease                                                                                                                                      Millburn Self-Storage
  expiring in 2022                                                                                                           100          94.7         93.9         94.8         96.2          97.5
                                                                                                                                                                                                            25
                                                                                                                                                                                               24.4
                                                                                                                               80
                                                                                                                                                                                 23.1
                                                                                                                                                                                                            20
                                                                                                                               60                                   20.3
                                                                                                                                                       19.3
                                                                                                                               40         18.1
                                         9.2%                                                                                                                                                               15
                      4.0%                                 3.0%               4.1%                                             20
       0.8%
                                                                                                                                0                                                                           10
       2022           2023               2024              2025               2026             Beyond                                 30-Jun-21      30-Sep-21   31-Dec-21    31-Mar-22     30-Jun-22
                                                                                                2026                                    Occupancy (%)         Average Quarterly Net Rental Rate (US$/psf)

            1.   Leases are typically triple net with no early termination rights and majority of the leases have built-in fixed rental increases.
            2.   Based on base rental income of Grocery & Necessity Properties for the month of June 2022.
                                                                                                                                                                                                                 21
Portfolio Update
        Primarily Leased to Cycle Agnostic Tenants Providing Essential Services
                                Trade Sector Breakdown1                                                                                            Essential Services2

        Fitness     Financial Services               Auto Supply             Dental Services
                           2.2%                          0.8%                    0.7%                                       • Grocery stores, farmer's markets      • Hardware and home
                                                                                            Others                            and farms                               improvement stores
                                                                                             1.0%
    Discounter/Outlet                                                                                                       • Pharmacies                            • Medical supply stores
                                              5.4%
                                                                                                                            • Gas stations                          • Banks and other financial
                                     5.5%
                                                                                                                            • Pet stores                              institutions
                                                                                                              Grocery and
 Self Storage                                                                                                  Wholesale    • Liquor stores                         • Laundromats and dry-
                              7.4%                                                                                                                                    cleaning services
                                                                                         40.9%                              • Car dealerships, but only for auto
                                                         Tenants providing                                                    maintenance and repair, and auto      • Convenience stores
                                         67.5%                                                                                mechanics
                                                         essential services
Consumer Services            8.1%                                                                                                                                   • Mail and delivery stores
                                                                                                                            • Ancillary stores within healthcare
                                                                                                                              facilities
                                                                                                                                  ✓ Stores that principally sell
                                  9.2%                                                                                              supplies for children under 5
  Consumer Goods
                                                                                                                                    years
                                                 9.4%             9.5%
                                                                                                                                  ✓ Printing and office supply
                                                                                            Home Improvement                        shops
                Food and Beverage

                        1.   Based on base rental income for the month of June 2022.
                        2.   Based on the definition of "Essential Retail Businesses" by the State of New Jersey.
                                                                                                                                                                                                  22
Portfolio Update
Reduction of Tenant Concentration Risk and Increased Tenant Diversification

• Contribution from the Top 10 Tenants decreased from 66.3% to 60.3%1, while maintaining the
  portfolio’s focus on cycle-agnostic tenants providing essential services

• Long WALE for Top 10 Tenants at 9.7 years1

     Tenant                                                Trade Sector                             1H 20212   1H 20221
1    ShopRite                                               Grocery & Wholesale                       12.0%     12.3%
                        5.5%
2    BJ's Wholesale Club Holdings                           Grocery & Wholesale                       13.3%      11.5%
3    Ahold Delhaize                                         Grocery & Wholesale                       10.2%      8.8%
4    Lowe's Companies                                       Home Improvement                           6.7%      5.8%
5    Walmart                                                Grocery & Wholesale                        5.6%      5.0%
6    LA Fitness                                             Fitness                                    5.5%      4.8%
7    Home Depot                                             Home Improvement                           4.7%      4.1%
8    Publix Super Markets                                   Grocery & Wholesale                        2.5%      3.2%
9    Price Chopper Supermarkets                             Grocery & Wholesale                        3.9%      3.2%
10   PetSmart                                               Consumer Goods                             1.9%      1.6%
                                                       10.0%
     Total                                                                                            66.3%     60.3%
     WALE for Top 10 Tenants                                                                                   9.7 years1

             1.   Based on base rental income of Grocery & Necessity Properties for the month of June 2022.
             2.   Based on base rental income of Grocery & Necessity Properties for the month of June 2021.
                                                                                                                            23
Portfolio Update
Commitment to ESG Excellence

          Environmental                            Community                                Management
           Stewardship                             Engagement                                Oversight

                                       • Serving the needs of our
                                                                                 • Establishing sound governance,
• Understanding and implementing         stakeholders, communities and
                                                                                   diversity, compliance, and
  green building and                     employees is a critical part of our
                                                                                   managerial practices
  environmentally friendly practices     success
                                                                                       o Creates greater
     o Delivers cost savings and             o Recognizes that our
                                                                                         transparency and insight for
        improved operating income              success is critically linked to
                                                                                         our stakeholders with the
     o Mitigates risks and                     the people we work with
                                                                                         assurance of the integrity of
        enhances asset value                   and the markets in which
                                                                                         our business transactions
                                               we operate

                                                                                                                         24
Portfolio Update
Our ESG Approach and Journey
           Energy Efficient Operations and Greenhouse Gas Emissions                                                     Strong Corporate Governance

                                                                                     To install at 50.0% of   • Included in the SGX Fast
EV Charging          1 installation                 2 installations                                             Track for its good compliance
                                                                                         our properties
  Stations                                                                                                      track record
                       2021                            2022                                   2024            • Ranked a joint 4th in the
                                                                                     To install at 35.0% of     Governance Index for
    LED              1 installation                2 installations                       our properties         Trusts (GIFT) 2021
 Lightings                                                                                                                             • Maintain high standards of
                       2021                            2022                                    2024                                      corporate governance and
                                                                                                                                         transparency
   Solar                                                                                                                               • Zero instances of non-
                      2 Solar Panels installations at Millburn and Carteret Self-Storage Properties                                      compliance with anti-corruption
  Panels
                                                                                                                                         laws and regulations
           Solar Panel at Carteret                                    EV Charging Station at
                Self-Storage                                           Price Chopper Plaza                              Giving Back to the Community

                                                                                                              • In June 2022, our employees volunteered at The Food
                                                                                                                Bank Singapore, a non-profit centralised coordinating
                                                                                                                organisation for food donations in Singapore
                                                                                                                                                                     25
Outlook

          Albany ShopRite – Supermarket, New York

                                               26
Outlook
     Recession Concerns but Labour Market Remains Tight
                                                                                                                                         Real GDP Growth2
 2022 GDP Forecast: +0.2%1                                                         40%
 •    US real GDP decreased by 0.6% q-o-q in 2Q 20222                              20%
 •    Led by decreases in private inventory investment,                              0%
      residential fixed investment, federal government                            -20%
      spending, and state and local government spending
                                                                                  -40%
      that were partly offset by increases in exports and
                                                                                              Q1       Q2        Q3       Q4       Q1      Q2   Q3   Q4    Q1    Q2     Q3     Q4     Q1    Q2
      consumer spending2
                                                                                                           2019                             2020                    2021                2022

                          US Unemployment Rate4                                                                   Rising Inflation August 2022: +8.3%3
                                                                                                                  •    Consumer spending has remained resilient to-date but inflation and
5.2% 4.8%                                                                                                              rising interest rates have negatively impacted consumer sentiment
          4.6% 4.2%
                    3.9% 4.0% 3.8% 3.6% 3.6% 3.6% 3.6% 3.5% 3.7%                                                  August 2022 Unemployment Rate: 3.7%4
                                                                                                                  •    315,000 jobs added in August 2022 to the U.S. economy4, an indicator
                                                                                                                       of resilience despite signs of slowing economic growth
                                                                                                                  •    Job vacancies remained high at 11.2 million and well above the new
                                                                                                                       hires rate at 6.4 million in July 20225, indicating a continuation of the
                                                                                                                       tight labour market

               1.   Federal Open Market Committee, “Summary of Economic Projection”, 21 September 2022.
               2.   U.S. Bureau of Economic Analysis, “Gross Domestic Product (Second Estimate), Second Quarter 2022”, 25 August 2022.
               3.   U.S. Bureau of Labor Statistics, “Consumer Price Index – August 2022”, 13 September 2022.
               4.   U.S. Bureau of Labor Statistics, “The Employment Situation – August 2022”, 2 September 2022.
               5.   U.S. Bureau of Labor Statistics, “Job Openings and Labor Turnover Summary – July 2022”, 30 August 2022.
                                                                                                                                                                                                   27
Outlook
    Non-Discretionary Spending Remains Resilient

     Retail Sales 1H 2022                               Retail Sales Aug 2022                                  Grocery Sales Aug 2022                                    Discretionary Sales2 Aug 2022

           +10.5%                                                  +9.1%                                                    +7.7%                                                          +1.3%
          year-on-year1                                         year-on-year1                                            year-on-year1                                                   year-on-year1

Consumer Spending increased as inflation accelerated3

•    Consumers are spending more at the grocery store but getting less in return as prices rise. Inflation-adjusted spending on food and beverages fell for four straight
     months from January to May, according to an analysis by Inflation Insights LLC, a research firm3

•    Savings rates, although well below peak levels recorded during the height of the pandemic, remain elevated compared to historic averages (1991-2019). U.S.
     consumers continue to demonstrate buying power and pent-up demand in the face of high inflation

•    August 2022 y-o-y discretionary sales2 increased slightly by 1.3% but well below retail and grocery sales as consumers are more cautious on non-essential spending

               1.   U.S. Census Bureau.
               2.   Discretionary sales include furniture and home furnishing stores, electronics and appliances stores, sporting goods, hobby, musical instrument and bookstores as well as clothing and clothing accessories stores.
               3.   Wall Street Journal, 29 July 2022.
                                                                                                                                                                                                                                         28
Outlook
Tailwinds Boosting Grocery & Necessity Retail Sector
                                                                                                                                    Strip Center Quarterly Leasing Volume4
 •   The tailwinds boosting strip center fundamentals including a lack of new
     supply, enhanced role of the store for delivery logistics, and consumers
     spending more time in the suburbs, still outweigh the impact of the ongoing
     deceleration of the economy1
 •   In 2Q 2022, strip center sector occupancy continued to climb higher slightly
     ahead of expectations and leasing demand continues to be broad based with
     strong demand from in-line and anchor tenants1
 •   U.S. store openings significantly outpacing store closings
        o        For the period ended 30th June, there were 4,328 openings compared
                 with 1,912 closures2

        Retail Shopping Center Transaction Volume (Sales)3
                                                                                                                    •     Despite inflationary increases, higher property-level operating
                                                                                                                          expenses have been offset by higher reimbursements from tenants
                                                                                                                          due to the triple net lease structure1
                                                                                                                    •     Portfolio and entity-level deals were an important part of the growth
                                                                                                                          in deal volume for the quarter, with sales tied up in such megadeals
                                                                                                                          climbing 101% y-o-y. Entity-level deals, in particular, have been
                                                                                                                          rebounding in 2022. For 1H 2022, $4.2b in portfolio sales have
                                                                                                                          closed5

            1.    Green Street Strip Center Sector Upate, 1 August 2022.        3. MSCI Capital Trends US Retail Report Q2 2022.        5. MSCI Capital Trends US Big Picture, Q2 2022.
            2.    Coresight Research US Store Tracker Databank, 29 July 2022.   4. Green Street Strip Center Update, 3 June 2022.
                                                                                                                                                                                                  29
Outlook
Customer Rental Duration Lengthen in Self Storage Sector

•   While demand for storage remains robust, occupancy and rental rate growth are         Historical In-Place Customer Rental Duration3
    anticipated to moderate in late 2022 into 20231
•   The magnitude of move-in rate growth in 2022 has significantly surpassed full year
    estimates of 7-8%
      o   Contemplate a slowdown in operating results in 2H 2022
      o   A deceleration in revenue growth in 2H 2022 will likely be led by a slowdown
          in move-in rate growth, with the expectation of more normalized seasonality
          which will likely lead to a tough comp in the fourth quarter2                      REIT Average Same Store Occupancy3
•   Tenant duration has lengthened throughout Covid, with ~65% of customers having
    stayed more than a year (up from ~50%), which expands the pool of customers
    subject to Existing Customer Rent Increases (ECRIs)
      o   Additionally, tenant churn has been subdued and move-in rates face stiffer
          comps in 2022 vs. 2021
      o   ECRIs are expected to have an outsized impact on rate growth in 20223                                    According to the REITs,
•   Deal volume for the self storage sector totaled $6.5b in 1H 2022. Investment                                   occupancy trends in April
                                                                                                                   and May have slightly
    activity was down 2% y-o-y due to a pullback in megadeal activity. In 1H 2021,
                                                                                                                   worsened, with occupancy
    portfolio and entity-level deals accounted for more than half of total deal volume,                            losses in the 90-bps range
    but only represented 34% of volume in 1H 2022. Individual asset sales were up
    48% y-o-y for the sector4

          1.   Green Street Conference Insights, 15 July 2022.
          2.   Green Street Self Storage Sector: Rent Tracker Update, 8 July 2022.
          3.   Green Street Self-Storage Sector Update, 20 May 2022.
          4.   MSCI Capital Trends US Big Picture, Q2 2022.
                                                                                                                                                30
Investment
                            Merits

St. Lucie West, Florida

                                       31
Investment Merits
Key Milestones and Accolades

                                           Governance Index                         Indices
        SGX Fast Track
                                               for Trust                           Inclusion

✓ Included in the SGX Fast Track,                                      ✓ FTSE ST Small-Cap Index
  within 2nd year of listing, for   ✓ Ranked joint 4th on GIFT 2021,   ✓ MSCI Singapore Micro-Cap
  UHREIT’s good compliance            on UHREIT’s maiden year of         Index
  track record                        assessment                       ✓ Newly included in iEdge indices,
                                                                         with effect from 26 Sep 2022:
✓ Joins 94 other listed companies   ✓ This accreditation affirm the        • iEdge SG Real Estate
  (representing the top 15% of        Manager’s     commitment   to            Index
  listed companies on the SGX) to     uphold    strong   governance        • iEdge S-REIT Index
  be included in the programme        practices                            • iEdge SG ESG
                                                                               Transparency Index

                                                                                                            32
Investment Merits
Why Invest in United Hampshire US REIT

           Stable Cashflows                                                                                                                                               Yield & Growth
• Grocery & Necessity and Self-Storage                                                                                                              • Exposure to strong US Consumer sector
  properties are generally considered cycle-                                                                                                          improving employment situation and rising
  agnostic and not as vulnerable to cyclical                                                                                                          consumer confidence
  shifts in the economy
                                                                                                                                                    • Majority of existing leases provide for rental
• Long WALE of 8.0 years1 with largely triple                                                                                                         increases during the lease terms and/or
  net leases                                                                                                                                          renewal options with built-in rental increases

•   High portfolio occupancy of 96.2%2                                                                                                              • High dividend yield of 9.5%3 based on current
                                                                                                                                                      market value of share price

         High Quality Assets                                                                                                                                       E-commerce Resistant
• Focused on affluent and populous US                                                                                                               • Low margin is impediment to grocery and home
  Eastern seaboard markets with higher                                                                                                                improvement products delivery
  spending power, lower supply and lower
  supply growth                                                                                                                                     • Grocery & Necessity Property tenants have been
                                                                                                                                                      successful in adopting omnichannel strategy
• Majority of the tenants are considered
  essential businesses                                                                                                                              • Large number of service-sector tenants with
                                                                                                                                                      limited online alternatives

             1.   Grocery & Necessity Properties only. Computation included forward committed leases, excluding forward committed leases, the WALE is 8.0 years as at 30 June 2022.
             2.   As at 30 June 2022. Computation included forward committed leases for Grocery and Necessity Properties.
             3.   Based on 2H 2021 and 1H 2022 total distribution of US5.96 cents and unit price as at 31 August 2022 of US$0.625.
                                                                                                                                                                                                       33
34

          Thank You                                    UHREIT Website          Follow us on Linkedin

            For enquiries, please contact:
       Ms Wong Siew Lu, CFA, CA (Singapore)            https://www.uhreit.com/
     Head of Investor Relations and Sustainability     https://www.linkedin.com/company/uhreit/
             Email: wongsiewlu@uhreit.com
80 Raffles Place #28-21 UOB Plaza 2 Singapore 048624

                                                                                          34
Appendix

           Lawnside Commons, New Jersey
Appendix
Locations of UHREIT’s Self-Storage Properties

                                                                                                 • Undersupply of Self-Storage
                                                                                                   facilities in New York Metro Area
                       Newark Liberty                                   Manhattan
                        Int’l Airport
                                                       Jersey City

  Millburn
Self-Storage
                                                                                                 • Regional access to New York
                                                          Statue of
                                        Port Newark        Liberty                  Brooklyn       City and metropolitan areas via
                                                                                                   major highways and public
                                                                                                   transportation

                                                                                                 • Approximately 30 minutes away
                                                                                                   from Newark Liberty International
                                    Staten Island                                                  Airport and Port Newark
                  Carteret                                 Self-Storage Supply1
                Self-Storage                               (Sq ft per Capita)

                                                                                       6.1       • Surrounded by a mix of
                                                                                                   residential, commercial, industrial
                                                                      3.1
                                                                                                   and office developments
                                                            NY-Newark-Jersey        US Average
                                                             City, NY-NJ-PA

               1.   Cushman & Wakefield Self-Storage Data Services.
Appendix
 Trust Structure
                                                                   Unitholders

                                                   Ownership of Units        Distributions
                                Trustee Services                                              Management Services
                Trustee                                                                                                     REIT Manager
                                 Trustee Fees                                                   Management Fees
                                                                                                                                                       Tax Efficient Structure

                       100.0% Ownership         Dividends                                          100.0% Ownership
                                                                                                                                      Management   • No U.S. corporate tax (21%) and U.S.
                                                                                  Dividends
                                                                                                                                      Agreement      withholding tax (30%)
                                                                                    Singapore Intercompany Loan
                                    Singapore Sub 1
                                                                                                Subs1
                                                                                                                                                   • No Singapore corporate tax (17%) and
                    100.0% voting shares        Distributions                                                                                        withholding tax (10%)
Singapore

United States
                                                                                                                                                   • Minimal taxes incurred
                                                                                         Loan         Interest                U.S. Asset
                                                                                                                               Manager
                                      Parent US REIT

                       100.0% Ownership         Distributions

                                       U.S. Holding
                                           LLC

                       100.0% Ownership         Distributions

                                        Property
                                       Holding LLC

                                       Properties

                  1.   There are two wholly owned Singapore Intercompany Loan Subsidiaries extending intercompany loans to the Parent US REIT.
Appendix
Strong Self-Storage Demand Drivers

                                       Steadily
                                     increasing
                                     consumer                                              •   In addition to 'life event' demand drivers (e.g., moving, divorce), the
                                     awareness                                                 storage industry continues to benefit from Covid-related needs, including:
                                                                                               1) businesses storing inventory; 2) decluttering for home offices; and 3)
                                                                                               storage of apartment furnishings for those who moved temporarily1
                                                                                           •   COVID-related demand materially increased storage utilization rates, and
                                                                                               much of this demand is likely to become sticky consumer behavior2
                                                                        Driven by 5 Ds     •   The surge in remote work caused homeowners to increase the amount of
 Smaller housing                       Demand                          - Death, Divorce,       dedicated space for home offices and home gyms in their residences,
  arrangements                         Drivers                           Decluttering,         driving massive demand for self-storage. Green Street forecasts that 70%
                                                                       Downsizing and          of U.S. employees will work from home at least one day per week in the
                                                                          Dislocation          near future, a substantial increase from a 12% projection prior to the
                                                                                               pandemic3
                                                                                           •   Move-in rates have historically trailed in-place rates. However, strong
                                                                                               demand, high occupancy levels, and limited new supply have caused
                                                                                               overall move-in rates to surpass in-place rents1
                                   Increasingly
                                      mobile
                                    population

         1.   Green Street U.S. Self-Storage Outlook (January 2022).
         2.   Cushman & Wakefield Research.
         3.   Real Estate Alert (14 December 2021).
Appendix
               Income Stability & Diversification Across the Portfolio

                                                                                                            North Carolina, 4.7%     Virginia,                            North Carolina,   Virginia,
                                                    Self-                                                                             3.4%                                     4.7%          3.7%
  Self-                                                                                    Massachusetts,                                                  Massachusetts,
Storage,                                           Storage                                     7.0%                                                            7.6%                                     New York,
                                                                                                                                          New York,
 9.9%                                               7.4%                                                                                                                                                 28.3%
                                                                                                                                           27.6%
                                                                                                                                                            Pennsylvania,
                                                                                           Pennsylvania,                                                       8.8%
                                                                                              7.8%

                                                                Net Property                                                                                                      Net Property
                 Base Rent                                                                                             Base Rent
                                                                 Income by                                                                                                         Income by
                by Segment1                                                                                           by Location1
                                                                  Segment1                                                                                                          Location1
                                                                                                                                                           Maryland,
                                                                                             Maryland,                                                      11.4%
                                                                                              10.8%

                                                                                                                                                  New                                                    New
  Grocery &                                                                                         Florida,                                     Jersey,    Florida,                                    Jersey,
                                             Grocery &
  Necessity,                                                                                        12.7%                                        26.0%      10.6%                                       24.9%
                                             Necessity
   90.1%                                      92.6%

                       1.   Based on 1H 2022 Base Rental Income and Net Property Income.
Appendix
      Portfolio Overview - Grocery & Necessity Properties
                                                                                                                                                   Committed                          Property Value
   Property Name                   Location                 Land Tenure            Completion Year                   NLA (Sq Ft)                                       WALE (years)
                                                                                                                                                   Occupancy1                          (US$ Million)
Garden City Square -
                                   New York                    Freehold                     2012                        121,000                       100.0%               10.4            48.0
BJ's Wholesale Club
Garden City Square -
                                   New York                    Freehold                     2013                         55,000                       100.0%               8.0             21.0
LA Fitness
Albany ShopRite -
                                   New York                    Freehold                     2012                         65,000                       100.0%               9.8             23.7
Supermarket
Albany ShopRite - Gas
                                   New York                    Freehold                     1991                           915                        100.0%               9.8             4.4
Station
Price Chopper Plaza                New York                    Freehold                      2011                        84,295                       100.0%               10.7            20.9

Wallkill Price Chopper             New York                    Freehold                     1990                        137,795                        95.8%               5.4             13.0

Hudson Valley Plaza2               New York                    Freehold                     1996                        673,370                        88.3%               4.9             49.4

Wallington ShopRite              New Jersey                   Leasehold                     2015                         94,027                       100.0%               18.0            16.3

Stop & Shop Plaza                New Jersey                    Freehold                     1999                         84,167                       100.0%               10.3            25.5

Towne Crossing                   New Jersey                    Freehold                     1998                         92,000                        93.4%               3.1             12.5

Lawnside Commons                 New Jersey                    Freehold                     1970                        151,076                       100.0%               6.2             34.6

                 Information as at 30 June 2022.
                 1. Computation included forward committed leases.
                 2. The occupancy rate of Hudson Valley Plaza is calculated based on the NLA of 673,370 sq ft minus the non-functional static space of 67,616 sq ft.
Appendix
     Portfolio Overview - Grocery & Necessity Properties (Cont’d)
                                                                                                                                    Committed     WALE     Property Value
  Property Name                Location                   Land Tenure               Completion Year                NLA (Sq Ft)
                                                                                                                                    Occupancy1   (years)    (US$ Million)
                                                                                                                      318,323
St. Lucie West                   Florida                     Freehold                        1992                (with New Publix     95.8%       7.7           88.3
                                                                                                                       Store)

Big Pine Center                  Florida                     Freehold                        1984                    93,150           93.5%       4.2           9.1

Arundel Plaza                  Maryland                      Freehold                        1997                    282,039          100.0%      9.3           45.2

Parkway Crossing               Maryland                      Freehold                        1967                    260,241          100.0%      6.3           27.4

BJ's Quincy                Massachusetts                     Freehold                        2009                    84,360           100.0%      7.8           34.8

Fairhaven Plaza            Massachusetts                     Freehold                        1999                    81,085           100.0%      6.6           19.6

Lynncroft Center           North Carolina                    Freehold                        2002                    182,925          99.0%       4.4           25.1

Colonial Square                 Virginia                     Freehold                        1967                    168,326          97.4%       5.8           26.5

Penrose Plaza               Pennsylvania                     Freehold                        1970                    258,494          94.1%       7.8           55.2

Upland Square2              Pennsylvania                     Freehold                        2009                    400,674           N.A.       N.A.          N.A.

                   Information as at 30 June 2022.
                   1. Computation included forward committed leases.
                   2. The Upland Square acquisition closed on 28 July 2022 after the 1H 2022 reporting period.
Appendix
     Portfolio Overview - Self-Storage Properties
                                                                                                           Property Value
   Property Name                 Location        Land Tenure   Completion Year   NLA (Sq Ft)   Occupancy
                                                                                                            (US$ Million)

Carteret
                                New Jersey        Freehold          2017           74,150        94.7%          22.2
Self-Storage

Millburn
                                New Jersey        Freehold          2018           80,943        97.5%          24.5
Self-Storage

               Information as at 30 June 2022.
You can also read