Managing agricultural & port derived pollution in the Great Barrier Reef - success and failure
←
→
Page content transcription
If your browser does not render page correctly, please read the page content below
Managing agricultural & port derived
            pollution in the Great Barrier Reef –
                    success and failure
R. Kelley

 Jon Brodie

 Chief Research Scientist
 Science leader, Catchment to Reef Research Group, TropWATER, James Cook
 University, Townsville, Australia.

 7th GEOSS Asia-Pacific Symposium
 Asia-Pacific Biodiversity Observation Network
 Tokyo, Japan, 2014

                           catchment to reef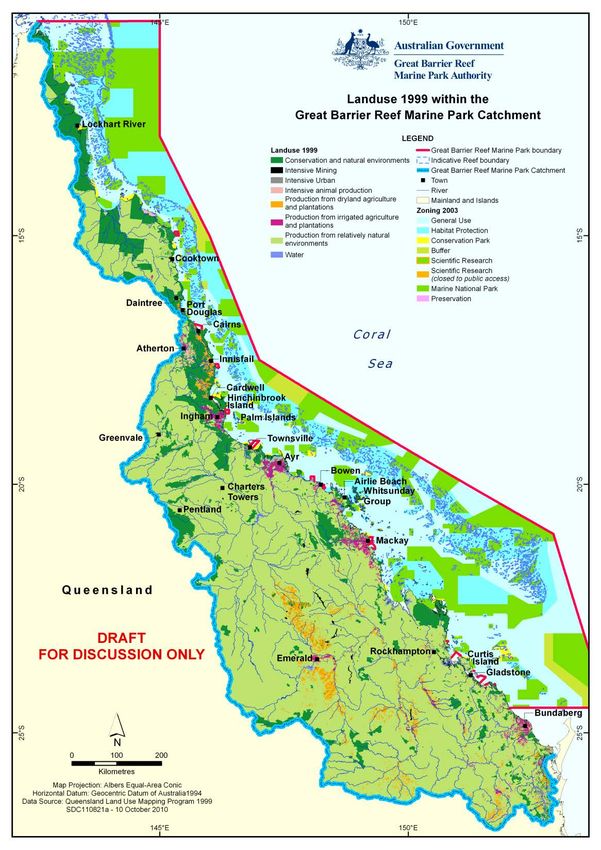
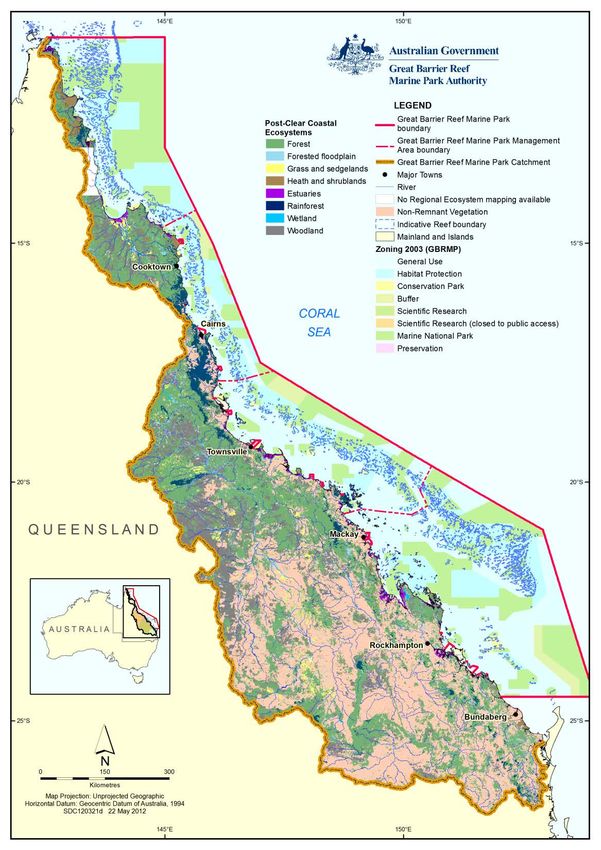
The Great Barrier Reef (GBR)
                          The “Reef”
                          350,000 km 2
                          3000 coral reefs
                          Large seagrass meadows
                          Dugongs, turtles, whales, fisheries
                          2000 km N to S
    Cairns
                          GBR Catchment
      Townsville
                          400,000 km2
       Abbot Point
                          Sugarcane, beef grazing, urban, mining,
                          grains, cotton, horticulture
              Hay Point

             Gladstone
                          Ports
                          Major – Cairns, Townsville, Abbot Point,
                          Hay Point, Gladstone

                          Marine Park – 1975
                          World Heritage - 1981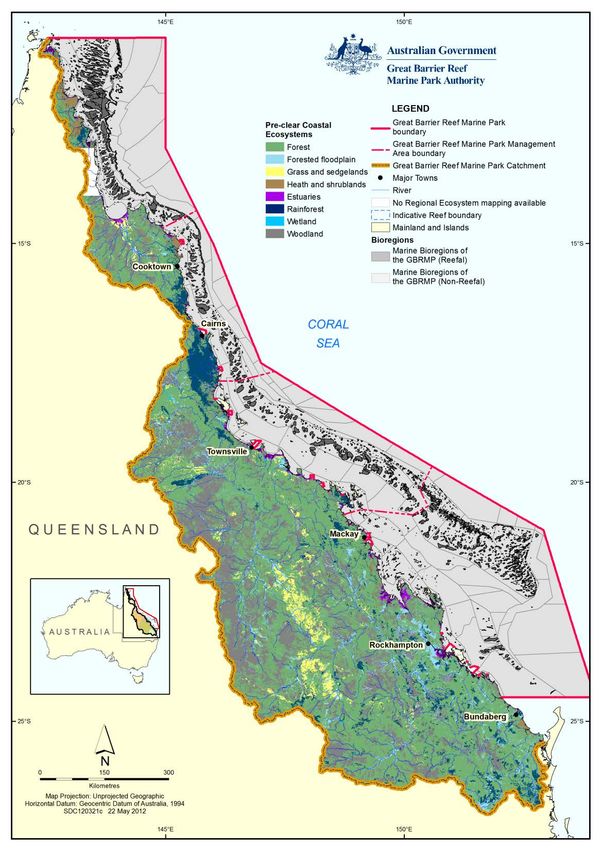
GBR catchment
scale

       Cape York

Wet Tropics            Burdekin

                                  Mackay-Whitsunday

                                          Fitzroy

                   Burnett-Mary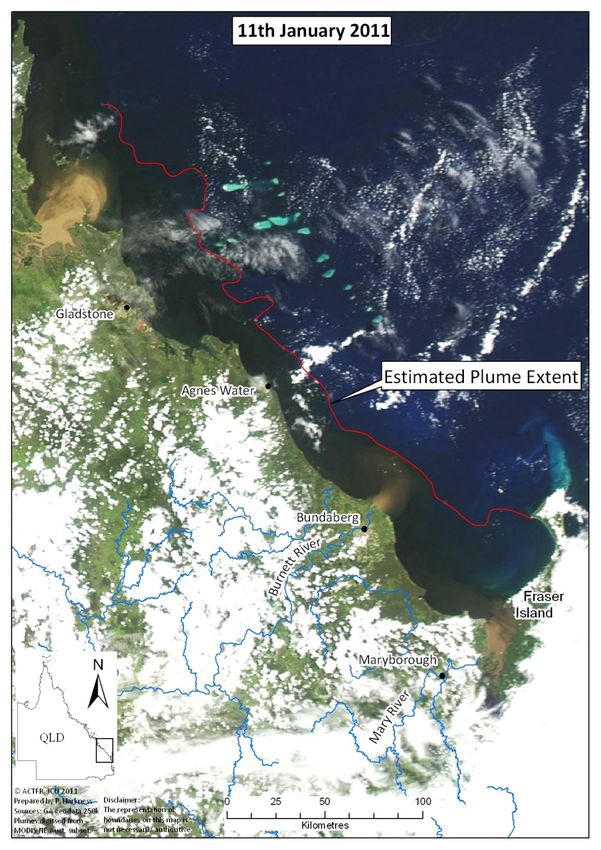
Catchment landuses
  Sugarcane                  Beef grazing

Large scale coal mining      Large and expanding ports

                     Urban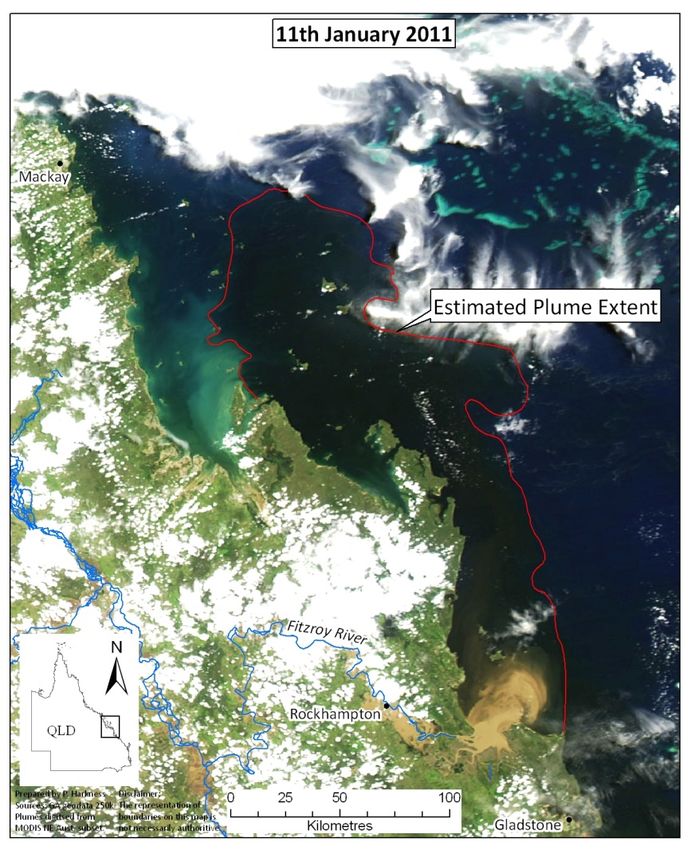
Sediment, nutrient and pesticide loads to
the GBR

             •Sediment – 5 times increase since 1850 –
             sourced mainly from erosion in grazing lands.

             •Total Nitrogen – 6 times increase since 1850
             – Particulate N loads mainly from erosion in
             grazing lands, nitrate from fertiliser use in
             sugarcane, cotton, horticulture, grains.

             •Total Phosphorus – 9 times increase since
             1850 – Particulate P loads also from grazing
             lands.

             •PSII herbicides (atrazine, diuron, tebuthiuron
             and others) – 28 tonnes ( no natural load) –
             from sugarcane, grains cropping and weed
             control in grazing lands.

             Loads from Kroon et al 2012; source information
             from Waterhouse et al. 2012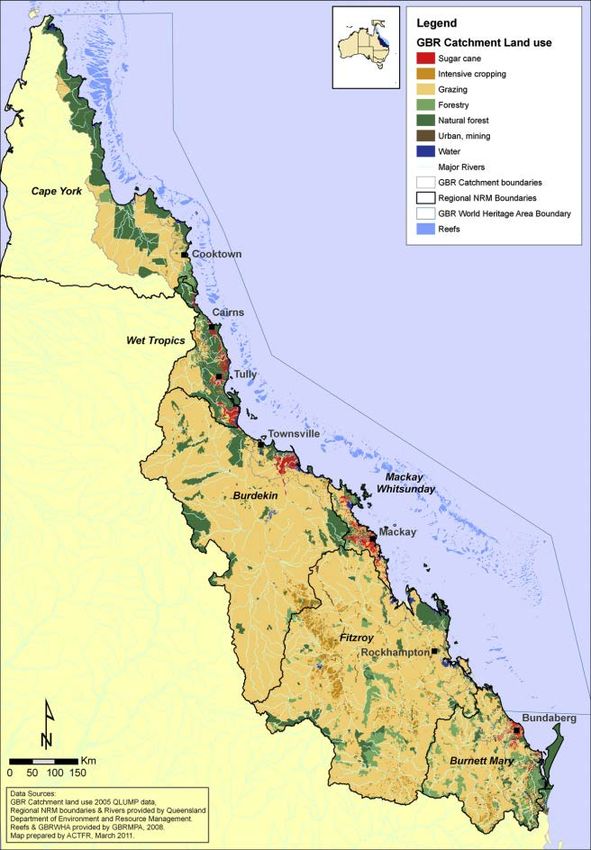
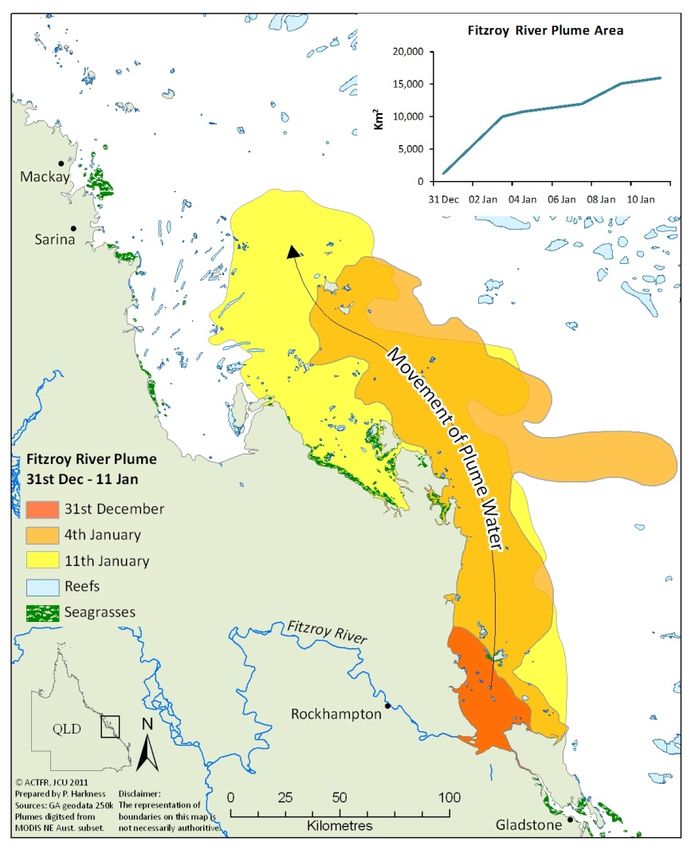
River discharge
MODIS Image
              Pollutants discharged in large
              river flow events in wet season
              producing huge flood plumes

                                      Direct
                                      effects

               Keppel
               Reefs
               (Alison
               Jones)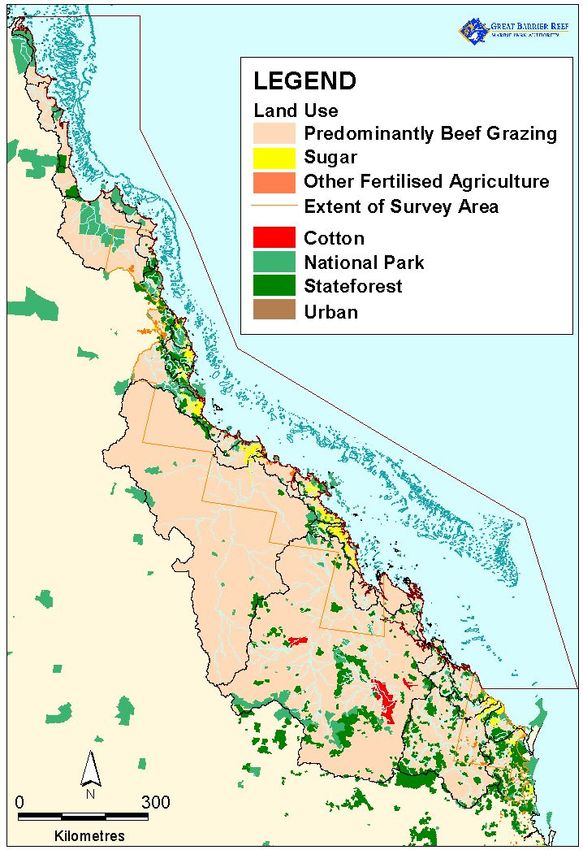
Flood plumes
Plumes studied using MODIS, Landsat and other
RS platforms plus sampling in the plume
History of management
• Marine Park Act – 1975
• Great Barrier Reef Marine Park Authority –
  established 1975
• World Heritage listing 1981
• Zoning complete by about 1990
• More than $A 1 billion spent on management,
  research, monitoring since 1975

However management over the first 20 years focussed
  largely on tourism and exclusion of fishing only in the
  small area of no-take zones. Traditional fisheries
  management prevailed as well by the Qld. Gov.
Terrestrial runoff management
• Scientific consensus – 2001 (after 20 years of
  research and monitoring) (Williams et al. 2001)
• Reef Plan 2003
• Reef Rescue program funded 2008 - $A200 million
  over 5 years
• Scientific Consensus Statement 2 – 2008 (Brodie et
  al. 2008
• Reef Plan 2009, 2013
• Scientific Consensus Statement 3 – 2013 (Brodie et
  al. 2013)
• Reef Rescue 2 funded 2013 – 2018 - A$200
        million
• Queensland Gov. actions (> A$200 million)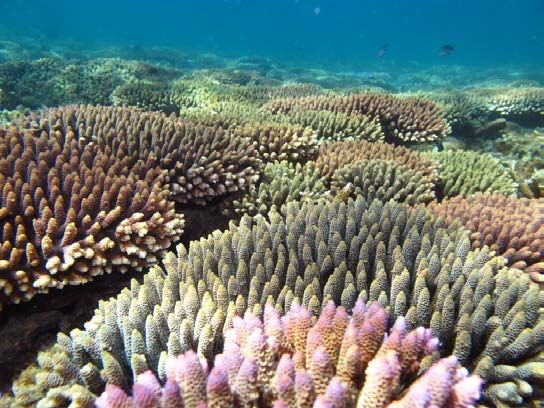
Some success under Reef
            Plan
Reef Rescue and Qld. Gov. investment 2009 –
2011 with farmer and grazier cooperation and
financial support.
• Nitrogen discharges down by 7% (2013 target
   50%)(new 2018 target at about 36%)
• Suspended Sediments down by 6% (~
   360,000 tonnes) (2013 target 20%)( new
   2018 target 20%)
• Herbicides (PS II) down by 15% (2013 target
   50%)(new 2018 target 60%)
HOWEVER
Coral reef degradation
Dugong loss
Seagrass lossCoral cover decline (mid-shelf reefs
Coral
mainly)
cover in Coral
cover in Coral
~1960 = Coral
1986 = cover in
40 – 55% cover in
(Bruno and Selig 28% 2004 =
2007; Bellwood et al.
2004; Hughes et al.
(Sweatman et al. 22% 2012 =
2011)
2011) (Sweatman et al.
2011)
14% (De’ath et
al. 2012) (note 11%
south of Cooktown)
Coral cover in
2020? – see
Inner-shelf reefs also in
De’ath et al.
decline (Thompson et al.
2012 – 5%?
2013)Declining seagrass cover
• Abundance decreased significantly since 2009 in all habitats
• 2010/11 abundances lowest on monitoring record
• 2011/12 abundances improving but remain low
McKenzie LJ, Collier C, Waycott M (2012) Reef Rescue Marine Monitoring Program: Nearshore Seagrass,
Annual Report for 2010–2011. Fisheries Queensland, Cairns. www.seagrasswatch.orgStatus of the GBR
(from Brodie and Waterhouse 2012)
• Coral cover from about 50% fifty years ago to less than 14%
currently (11% south of Cooktown) and predicted to decline
further (Hughes et al. 2011; De’ath et al. 2012)
• Dugong populations continue to decline
• Seagrass in trouble especially associated with both chronic
stress and extreme events (Devlin et al. 2012; Petus et al.
2014).
• Shark populations declining (Robins et al. 2006)
• Crown of thorns starfish outbreaks started again in 2009 for the
4th ‘wave’ (Fabricius et al. in prep.)
• Increasing inshore turbidity (Fabricius et al. 2013, 2014)
• Increasing incidence of coral diseases
• Increasing water temperatures
• Declining calcification (e.g. Cooper et al. 2009)Status of GBRWHA and water quality
Scientific consensus statement on water quality in the Great Barrier Reef (Brodie
et al 2013)
• The overarching consensus is that key GBR ecosystems are showing declining trends in condition due
to continuing poor water quality, cumulative impacts of climate change and increasing intensity of
extreme events.
• The decline of marine water quality associated with terrestrial runoff from the adjacent catchment is a
major cause of the current poor state of many of the key marine ecosystems of the GBR.
• The greatest water quality risks to the GBR are from nitrogen discharge, associated with crown of
thorns starfish outbreaks and their destructive effects on coral reefs, and fine sediment discharge
which drives light reduction for seagrass ecosystems and inshore coral reefs. Pesticide inputs pose
a risk to freshwater and some inshore and coastal habitats.
• Recent extreme weather– heavy rainfall, floods and tropical cyclones – have had severe impacts on
marine water quality and GBR ecosystems. Climate change is predicted to increase the intensity of
extreme weather events.
• The main source of excess nutrients, fine sediments and pesticides from GBR catchments is from
diffuse source pollution from agriculture.
• The use of improved land and agricultural management practices is proven to reduce the runoff of
suspended sediment, nutrients and pesticides at the paddock scale.Crown of thorns starfish again • Three waves of outbreaks 1962 – 1975; 1978 – 1990; 1993 – 2005; 2009 - ? • Now well understood to be linked to increased nutrient discharge from the land (Brodie et al. 2005; Fabricius et al. 2010) • Removal of fish predators may also be linked. No-fishing zones have less COTS? (Sweatman et al 2009) • Largest cause of coral mortality on the GBR (Osborn et al. 2011; Hughes et al. 2011; De’ath et al. 2012) • Fourth wave of outbreaks now started off Cairns north region (where all the other waves began) (Fabricius et al. in prep.) in 2009 • We can now expect high coral mortality from COTS in the central GBR over the next 10 years.
Why has management failed
• Early emphasis on tourism management – which was not
  the main issue.
• Fishing only comprehensively managed by 2005
• Terrestrial runoff only started to be managed by 2009
• Pesticide management still an issue due to ineffectiveness
  of Australian Government pesticide regulator
• Climate change not managed at all
• Port development poorly managed and in contrast to other
  issues management seems to be getting worse e.g.
  Gladstone Port, Abbot Point
• Difficulties of getting scientific consensus, political
  agreement , organizational structure and a funded
  management response.
Port dredging and spoil
                dumping
• Average annual suspended sediment discharge to GBR =
  about 9 million tonnes
• Anthropogenic contribution = 6 million tonnes (agriculture)
• Amount reduced by Reef Rescue so far (2011) = about
  360,000 tonnes
• Dredge spoil amount to be dumped over next decade = ~
  100 million tonnes – about 10 million tonnes per year
• i.e. twice the total anthropogenic river discharge per year
• Governance arrangements currently very poor (Grech et
  al. 2013; Brodie 2014), could be improved but little
  willingness to do so.
• UNESCO concerns
Gladstone
• Large scale dredging for CSG terminals on Curtis Island.
• Coincident fish, sharks, crabs, prawns disease outbreaks.
• Compliances monitoring and environmental oversight not
adequate to determine causation.
• Recent Australian Gov. review finds numerous flaws in
environmental management system, both in design and
implementation, including poor cooperation between
Queensland and Australian Government
2011
2005Abbot Point
spoil
dumping
Dumping
area to be
determined
Planned to
dredge 3
million cubic
metres and
dump spoil in
GBR Marine
Park (5 million
tonnes)What were the options • Long jetty (trestle) and no dredging • Medium length jetty and dredge < 500,000 m3 • Dredge 3 million m3 and dump in GBRMP • Dredge 3 million m3 and dump behind bund wall reclamation • Dredge 3 million m3 and dispose of spoil on land
What was chosen and
            permitted?
Dredge 3 million m3 and dump in GBRMP

Was any adequate analysis of the options on the basis
of relative protection of the GBRWHA, feasibility and
cost done? – NO

So in the end the cheapest, quickest and dirtiest (for the
GBRWHA) option chosen
Now many court cases (3 at present)!
1. Against EPBC permit; 2. Against Sea Dumping
permit; 3. Against GBRMP Act permit
Comparison of management
Agricultural sources
1. Reef Plan
2. Reef Rescue
Some
3. “Good” governance success
4. Reduction in loads
Port sources
1. “Corrupt” process for EIS and compliance monitoring
2. Poor governance
3. Massive increase in dredging & loads Failure
4. Lack of intent for “good” managementConclusions – prognosis for the GBR • Climate change has made extreme temperature conditions worse • Extreme rainfall (and cyclone activity) experienced on the east coast has been influenced by a warming climate • It is highly likely that extreme weather events will become even more severe in Australia So: • Prognosis poor in the face of further crown of thorns starfish, bleaching, increased extreme weather, increasing port development • Hence the need to continue the things we can do – terrestrial runoff management; enforcing the Marine Park zoning; better coastal management (ports) – improving resilience • UNESCO concerns – GBRWHA on “World Heritage in danger” list. Brodie and Waterhouse 2012; De’ath et al. 2012; Grech et al. 2013
Thank you

Thank you to AP-BON and Japanese Ministries of
Environment and Science for supporting my
participation.
You can also read