INVESTOR PRESENTATION - MAY 2022 - ENLINK MIDSTREAM LLC
←
→
Page content transcription
If your browser does not render page correctly, please read the page content below
Investor Presentation
                                                   May 2022

INTEGRITY   |   INNOVATION   |   SAFETY   |   PEOPLE   |   EXCELLENCE
FORWARD-LOOKING STATEMENTS
•   This presentation contains forward-looking statements within the meaning of the federal securities laws. Although these statements reflect the current views, assumptions and
    expectations of our management, the matters addressed herein involve certain assumptions, risks and uncertainties that could cause actual activities, performance, outcomes
    and results to differ materially from those indicated herein. Therefore, you should not rely on any of these forward-looking statements. All statements, other than statements of
    historical fact, included in this press release constitute forward-looking statements, including but not limited to statements identified by the words “forecast,” “may,” “believe,”
    “will,” “should,” “plan,” “predict,” “anticipate,” “intend,” “estimate,” “expect,” "continue," and similar expressions. Such forward-looking statements include, but are not limited to,
    statements about guidance, projected or forecasted financial and operating results, expected financial and operations results associated with certain projects, acquisitions, or
    growth capital expenditures, future operational results of our customers, results in certain basins, future results or growth of our CCS business, future cost savings or operational
    initiatives, profitability, financial or leverage metrics, the impact of weather-related events such as Winter Storm Uri on us and our financial results and operations, the impact of
    any customer billing disputes and litigation arising out of Winter Storm Uri, future expectations regarding sustainability initiatives, our future capital structure and credit ratings, the
    impact of the COVID-19 pandemic or variants thereof on us and our financial results and operations, objectives, strategies, expectations, and intentions, and other statements
    that are not historical facts. Factors that could result in such differences or otherwise materially affect our financial condition, results of operations, or cash flows include, without
    limitation (a) the impact of the ongoing coronavirus (COVID-19) pandemic, including the impact of the emergence of any new variants of the virus on our business, financial
    condition, and results of operations, (b) potential conflicts of interest of Global Infrastructure Partners (“GIP”) with us and the potential for GIP to compete with us or favor GIP’s
    own interests to the detriment of our other unitholders, (c) adverse developments in the midstream business that may reduce our ability to make distributions, (d) competition for
    crude oil, condensate, natural gas, and NGL supplies and any decrease in the availability of such commodities, (e) decreases in the volumes that we gather, process, fractionate,
    or transport, (i) our ability or our customers’ ability to receive or renew required government or third party permits and other approvals, (j) increased federal, state, and local
    legislation, and regulatory initiatives, as well as government reviews relating to hydraulic fracturing resulting in increased costs and reductions or delays in natural gas production
    by our customers, (k) climate change legislation and regulatory initiatives resulting in increased operating costs and reduced demand for the natural gas and NGL services we
    provide, (l) changes in the availability and cost of capital, including as a result of a change in our credit rating, (m) volatile prices and market demand for crude oil, condensate,
    natural gas, and NGLs that are beyond our control, (n) our debt levels could limit our flexibility and adversely affect our financial health or limit our flexibility to obtain financing
    and to pursue other business opportunities, (o) operating hazards, natural disasters, weather-related issues or delays, casualty losses, and other matters beyond our control, (p)
    reductions in demand for NGL products by the petrochemical, refining, or other industries or by the fuel markets, (q) our dependence on significant customers for a substantial
    portion of the natural gas and crude that we gather, process, and transport, (r) construction risks in our major development projects, (s) challenges we may face in connection
    with our strategy to enter into new lines of business related to the energy transition, (t) impairments to goodwill, long-lived assets and equity method investments, and (u) the
    effects of existing and future laws and governmental regulations, and other uncertainties. These and other applicable uncertainties, factors, and risks are described more fully in
    EnLink Midstream, LLC’s and EnLink Midstream Partners, LP’s filings with the Securities and Exchange Commission, including EnLink Midstream, LLC’s and EnLink Midstream Partners,
    LP’s Annual Reports on Form 10-K, Quarterly Reports on Form 10-Q, and Current Reports on Form 8-K. Neither EnLink Midstream, LLC nor EnLink Midstream Partners, LP assumes any
    obligation to update any forward-looking statements.
•   The EnLink management team based the forecasted financial information included herein on certain information and assumptions, including, among others, the producer
    budgets / forecasts to, which EnLink has access as of the date of this presentation and the projects / opportunities expected to require growth capital expenditures as of the date
    of this presentation. The assumptions, information, and estimates underlying the forecasted financial information included in the guidance information in this presentation are
    inherently uncertain and, though considered reasonable by the EnLink management team as of the date of its preparation, are subject to a wide variety of significant business,
    economic, and competitive risks and uncertainties that could cause actual results to differ materially from those contained in the forecasted financial information. Accordingly,
    there can be no assurance that the forecasted results are indicative of EnLink's future performance or that actual results will not differ materially from those presented in the
    forecasted financial information. Inclusion of the forecasted financial information in this presentation should not be regarded as a representation by any person that the results
    contained in the forecasted financial information will be achieved.
                                                                                                                                                        May 2022 Investor Presentation             2
INDEX

 INVESTMENT HIGHLIGHTS       …………..……….……………......... 4

 1Q22 FINANCIAL RESULTS      ……………...………………............ 10

 2022 UPDATED GUIDANCE       ……………...………………............ 14

 CARBON SOLUTIONS            ………………………………………. 19

 EXECUTION PLAN PRIORITIES   ………………………………………. 29

 APPENDIX                    ……….………................................ 36

                                                           May 2022 Investor Presentation   3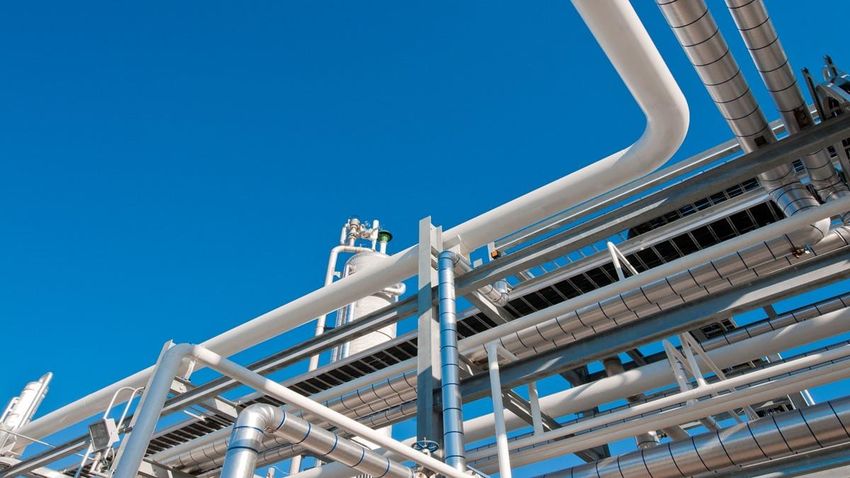
BECOMING THE FUTURE OF MIDSTREAM

                                           Integrated Business Model

Focused On
Environmentally
Responsible Operations                        Large-Scale, Cash-Flow-
                                                  Generating Platform
                              CREATING
                             SUSTAINABLE
                                VALUE
  Delivering Energy                                    Powered by
  Solutions for the Future                   Operational Excellence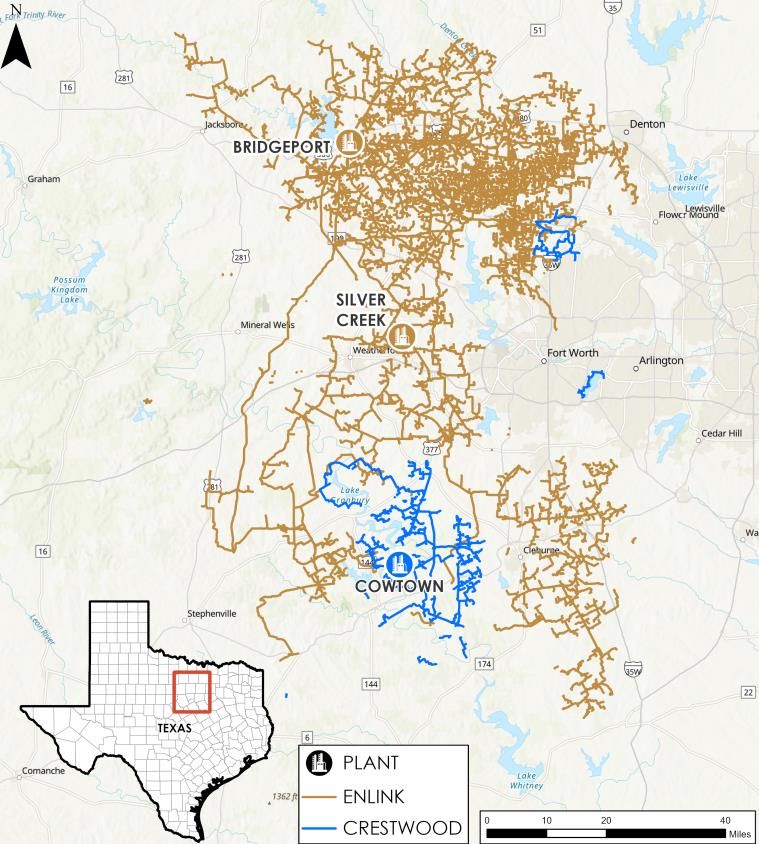
INTEGRATED BUSINESS MODEL
   PREMIER PRODUCTION BASINS CONNECTED TO KEY DEMAND CENTERS
                                                                                                                              ---------------------------------- Our Footprint --------------------------------

                                                                                                                              Permian             Louisiana              Oklahoma                  North TX

                                                                                                                                                              ----------------- Service Type -----------------
                                                                                                                            Basin / Geography               Natural Gas             NGL             Crude

                                                                                                                            Permian Basin                         ✓                   ✓                ✓
                                                                                                                            Gulf Coast                            ✓                   ✓
                                                                                                                            Haynesville                           ✓
                                                                                                                            Anadarko Basin                        ✓                   ✓                ✓
                                                                                                                            Barnett                               ✓                   ✓
                                                                                                                            Marcellus / Utica                     ✓                   ✓                ✓

              ~1,100                                       22                               ~5.5                                   7                       ~320,000                               ~12,100
       Employees Operating                             Processing                     Bcf/d Processing                                                   bbl/d Fractionation
                                                                                                                            Fractionators                                                        Miles of Pipeline
         Assets in 7 States                             Facilities                        Capacity                                                            Capacity

Note: Ascension Pipeline is 50% owned by a joint venture with a Marathon Petroleum Corp. subsidiary. Delaware Basin gas G&P assets are 49.9%
owned by Natural Gas Partners.                                                                                                                                               May 2022 Investor Presentation          5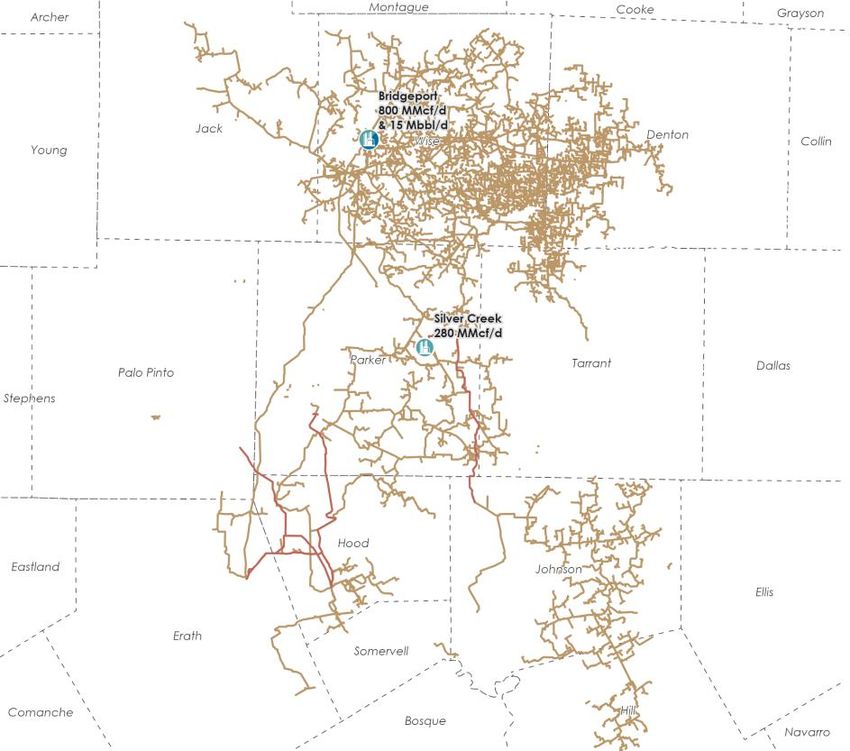
LARGE SCALE, CASH-FLOW-GENERATING PLATFORM
   ROBUST FREE CASH FLOW CREATES SIGNIFICANT FINANCIAL FLEXIBILITY

                                                                                                                                      ($MM)
                                                                                                                                                                              345

           Consistently delivering FCFAD of >$300MM                                                                                          311             314
                                                                                                                                                                                           Consistent
                                                                                                                                                                                            FCFAD
                                                                                                                                             2020            2021           Updated        Generation
                     o Attractive FCFAD yield of ~7%1                                                                                                                         2022
                                                                                                                                                                            Guidance
                                                                                                                                                                            Midpoint

                                                                                                                                                     2020               2021

           Significant leverage reduction over last 2                                                                            Debt Paydown
                                                                                                                                    ($MM)
                                                                                                                                                     (136)                                 Leverage
           years                                                                                                                                                       (235)               Reduction
                                                                                                                                                    4Q20     4Q21           1Q22

                                                                                                                                 Leverage2          4.1x      3.9x          3.8x

           Pivoting to more balanced use of FCFAD
                                                                                                                                    ($MM)
                                                                                                                                                                                   1,220
                                                                                                                                                                     +16%
                                                                                                                                            1,039            1,050                         Growth in
                     o Investing in growing the business
                                                                                                                                                      +7%
                                                                                                                                   MVC                                                     Underlying
                                                                                                                                                                                            Business3
                                                                                                                                            2020             2021           Updated 2022
                     o Increasing returns to unitholders                                                                                                                     Guidance
                                                                                                                                                                              Midpoint
1Source:FactSet market cap as of 3/31/2022. ENLC free cash flow after distributions based on 2022 guidance midpoint of $345MM.
2Calculated according to revolving credit facility agreement leverage covenant, which excludes cash on the balance sheet.
3Referenced growth in the underlying business is adjusted EBITDA.                                                                                                  May 2022 Investor Presentation       6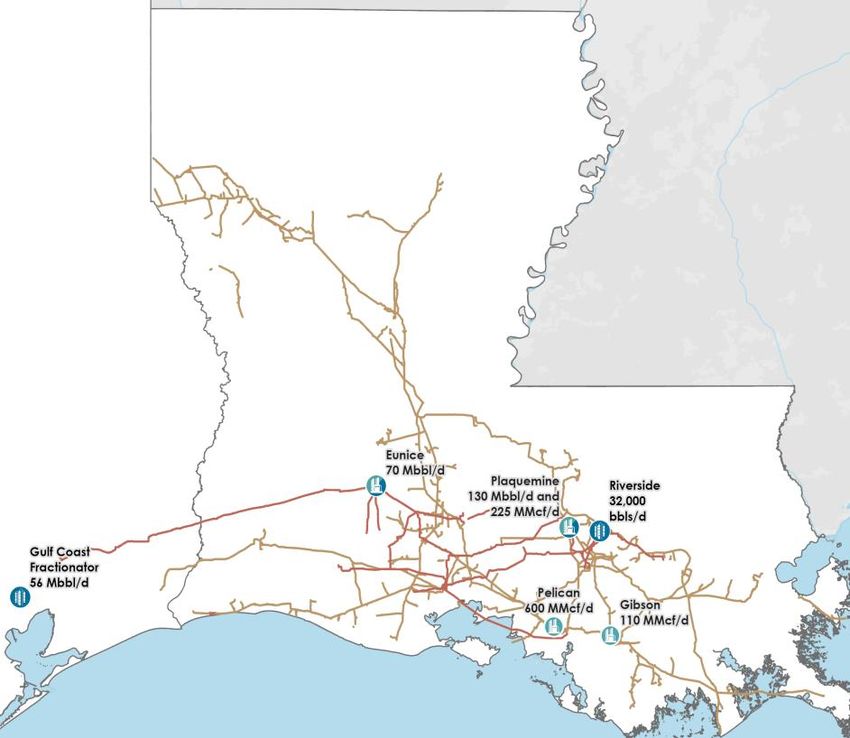
POWERED BY OPERATIONAL EXCELLENCE
THE ENLINK WAY MINDSET

                              Leading,      Customer
                            experienced      centric             GIP
                             operations      mindset         operational
                                team
                                                               support

   2020 Mastio Quality                                                         Peer-leading cost
                                                 Deploying
    Award – Overall            Low-cost,
                                                   new                       structure reduction in
                                efficient
  Winner/Highest Score         operator
                                                technology                   2020 and maintaining
                                                                            cost-efficient structure in
                                                                            growth and inflationary
                                            Strong                                environment
                                            Safety
                                            Focus

Experienced operational                                                    Achieved company record in
excellence team driving   Safe and efficient operations                     2021 for lowest recordable
    efficiency gains                                                          injury rate (TRIR) at 0.44
                          Low-cost, scalable platform
                                                                               May 2022 Investor Presentation   7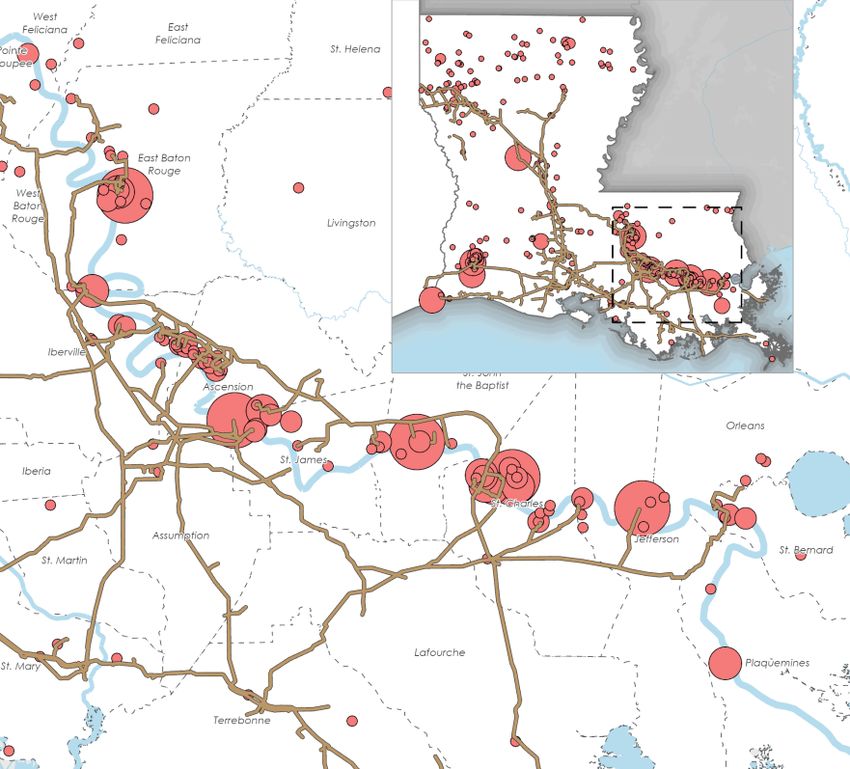
DELIVERING ENERGY SOLUTIONS FOR THE FUTURE
STRATEGIC ADVANTAGE IN BUILDING LOUISIANA CCS BUSINESS

    EnLink’s Mississippi River Corridor Assets
                                                         The EnLink Advantage: Relationships,
                                                             Expertise, Assets, & Location
                                                 Relationships:                   Expertise:
                                                 Connected to industrial          Decades of building and
                                                 customers in Mississippi River   operating pipeline systems
                                                 corridor; relationships with     in Louisiana
                                                 Oxy Low Carbon Ventures
                                                 and Talos offer full solutions

                                                 Assets:                          Location:
                                                 Extensive, redundant,            Close proximity to 80MM
                                                 pipeline systems with            metric tonnes of CO2
                                                 ability to repurpose pipe        emissions and 500 million
                                                 for CCS service                  metric tonnes of
                                                                                  sequestration capacity

                                                                                       May 2022 Investor Presentation   8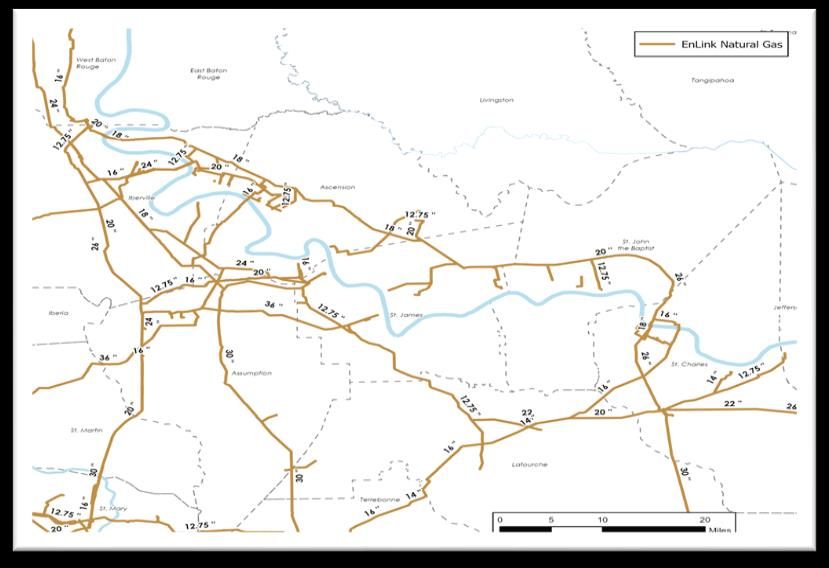
FOCUSED ON ENVIROMENTALLY RESPONSIBLE OPERATIONS
      DRIVING TOWARD A LOWER-CARBON, SUSTAINABLE FUTURE

                                                    • Completed Projects in 2021 for:
                                                      ✓ 1,500 MT Methane Reduction
                                                      ✓ 38,000 MT CO2e Reduction                                                              2050
                                                                                                                                              Net Zero2
                                                    • On-track to meet 2024 goal:
                                                      through 1Q22, accomplished
                                                      ~40% of 2024 goal
                                                                                                                     2030
                                                                                                                                              Greenhouse
                                                                                         2024                          Pursuing a path
                                                                                                                       to reach a 30%
                                                                                                                       reduction1 in
                                                                                                                                              Gas Emissions
                                                                                           30% reduction1              our total CO2e
                                                       November
                                                                                           in methane                  emissions
                                                              2021                         emissions                   intensity
                                                                                           intensity
                                                                Agreement to                                       How We’re Doing It:
                                                                capture and sell
                                      March                     ~100,000 metric                             Innovation, Process Improvements
                                         2021                   tonnes of CO2           • Replacing pneumatic devices to lower-emitting or zero-emitting alternatives
                                                                per year at             • Increasing usage of renewable energy to power our operations
                                              EnLink joined     Bridgeport              • Converting natural gas-driven equipment to run on electricity
                                                                                        • Implementing carbon capture technologies for reuses or sequestration
                                                                                        • Utilizing voluntary optical gas imaging monitoring programs
                                                                                        • Installing emission control equipment to reduce and minimize emissions

1As   compared to 2020 scope 1 emissions levels.
2Scope   1 and scope 2 emissions.                                                                                                          May 2022 Investor Presentation   9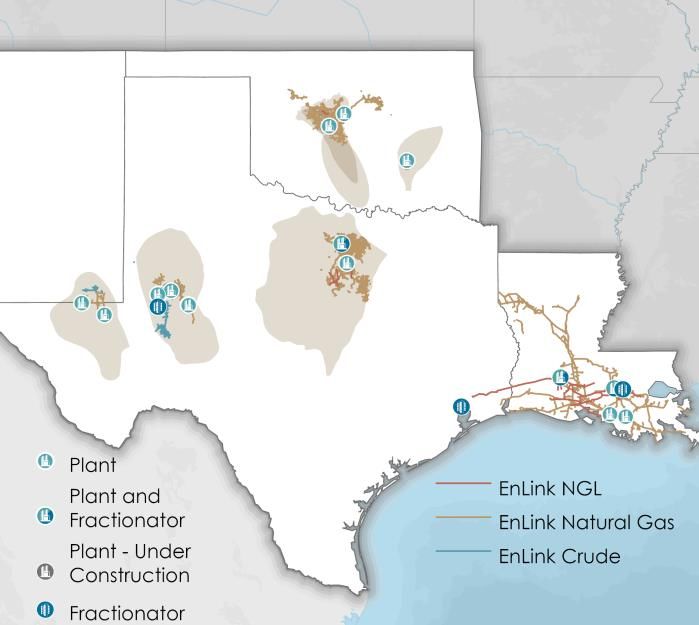
1Q22 FINANCIAL
    RESULTS
1Q22 FINANCIAL RESULTS
ADJUSTED EBITDA YEAR-OVER-YEAR GROWTH OF 22%
$MM, unless noted 1Q22
Record Quarterly Results
• Highest quarterly Adjusted EBITDA in
company history
Net Income (Loss) $66.0
• Permian volumes and segment profit
Adjusted EBITDA, net to EnLink1 $304.3 both grew 12% sequentially and 46% and
62%, respectively, YoY4
Capex, net to EnLink, & Plant Relocation Costs2 $65.7
Net Cash Provided by Operating Activities $307.7 Robust Free Cash Flow Generation
• Strong execution, cost control, and
Free Cash Flow After Distributions1 $104.9 timing of capex resulted in strong FCFAD
Declared Distribution per Common Unit $0.1125
• Redeemed $50MM of Series B Preferred
units and repurchased $23MM5 of
As of March 31, 2022 common units
Debt-to-Adjusted EBITDA3 3.8x Strong Producer Activity & Outlook
• Robust commodity prices are driving
Amount Outstanding on $1.75BN Revolving Credit Facility $0 increased producer activity across all
segments
Cash, net to EnLink $56 • Expect significant growth to continue in the
Permian and now also in Oklahoma in 2023
1Non-GAAP measure defined in the appendix. 2Includes $8.9MM and $2.4MM for 1Q22 in Permian and Oklahoma, respectively, for relocation costs related to plant
relocation classified as operating expenses in accordance with GAAP related to the relocation of a natural gas processing plant from Oklahoma to Midland, Texas, referred
to as “Project Phantom”. 3Calculated according to revolving credit facility agreement leverage covenant, which excludes cash on the balance sheet. 4Excluding plant
relocation costs and unrealized derivatives. 5Includes $6MM of common units repurchased from GIP pursuant to the previously disclosed Unit Repurchase Agreement dated
February 15, 2022 and which settled on May 2, 2022. These represent GIP’s pro-rata share of aggregate units repurchased from February 15 through March 31, 2022. May 2022 Investor Presentation 11SEGMENT RESULTS OVERVIEW
POSITIVE VOLUME MOMENTUM DRIVES IMPROVED SEGMENT RESULTS
Segment Results ($MM) 1Q21 2Q21 3Q21 4Q21 1Q22 Quarterly Highlights
Permian Gas Segment Profit 35.8 28.1 58.4 60.1 50.4 Permian
Permian Crude Segment Profit 7.0 15.9 10.7 13.7 22.6 • Sustained, robust producer activity in Midland
• Growing volumes in Delaware supported by a
Total Segment Profit 42.8 44.0 69.1 73.8 73.0 diverse customer base
Plant Relocation OPEX1 6.0 10.0 8.8 0.1 8.9 • Excluding plant relocation costs and unrealized
derivative activity, segment profit increased ~62% vs.
Unrealized Derivatives Loss/(Gain) 5.3 7.9 (10.2) 4.7 5.9 1Q21
Louisiana Gas Segment Profit 12.9 10.6 5.9 18.3 14.1 Louisiana
• Benefited from expected seasonal activity,
Louisiana NGL Segment Profit 63.1 47.8 50.1 85.8 69.4 opportunity processing, and robust NGL/frac pricing
ORV Crude Segment Profit 6.2 8.9 7.7 7.6 7.0 • Gas volumes grew 16% vs. 1Q21
Total Segment Profit 82.2 67.3 63.7 111.7 90.5 • Excluding unrealized derivative activity, segment
profit increased ~17% vs. 1Q21
Unrealized Derivatives Loss/(Gain) 0.4 9.4 8.8 (19.3) 5.6
Oklahoma Gas Segment Profit 53.2 78.4 84.2 96.4 81.5 Oklahoma
Oklahoma Crude Segment Profit 2.3 7.2 2.9 3.0 4.3 • Excluding plant relocation costs and impact from Uri,
segment profit grew ~29% vs. 1Q21
Total Segment Profit 55.5 85.6 87.1 99.4 85.8
• Favorable commodity pricing drove improved
Plant Relocation OPEX1 1.6 0.2 0.0 1.6 2.4 operator rig activity
Unrealized Derivatives Loss/(Gain) 1.8 5.3 2.3 (9.4) 7.1
North Texas
North Texas Gas Segment Profit 76.9 57.9 60.0 56.1 63.0 • BKV initiated new drilling program in March 2022 and
continues with re-frac program commenced in 2021
Unrealized Derivatives Loss/(Gain) 0.4 1.2 0.3 3.5 (3.5)
Note: Includes segment results associated with non-controlling interests. Segment results include realized and unrealized
derivatives and Plant Relocation OPEX. 1Project War Horse and Project Phantom. May 2022 Investor Presentation 12STRONG PERFORMANCE & POSITIVE OULOOK ACROSS PORTFOLIO
MOMENTUM BUILDING IN 2022 SUPPORTING SIGNIFICANTLY HIGHER VOLUME OUTLOOK FOR 2023
Strong Growth in Permian Significant Increase in Activity in
and Louisiana: Oklahoma and North Texas:
• Permian gathering volumes increased 12% • Expecting significant volume growth in
sequentially in 1Q22 & 46% YoY Oklahoma in 2023 driven by current
producer activity and plans
• Tiger plant came on line in the Delaware
Basin at the end of 4Q21 • Existing assets can accommodate ~25%
more processing volume (post Phantom
• Continuation of capital light approach with
move) to support growth
Project Phantom, which adds 200 MMcf/d of
capacity • BKV led industry with refrac activity in 2021
• Downstream demand in Louisiana remains with more than 200 refracs in North Texas1
strong from petrochem and industrial • BKV and others adding rig activity in 2022
consumers; business supported by attractive driving potential for modest growth in 2023
economics and growing NGL supply from
G&P segments
1Enervus.
May 2022 Investor Presentation 132022 UPDATED GUIDANCE
RAISING 2022 FINANCIAL GUIDANCE
   STRONGER ACTIVITY DRIVES IMPROVED OUTLOOK FOR 2022 AND 2023

         $MM, unless noted                                                     Initial                    Updated1                                Adjusted EBITDA Growth
                                                                                                                                                  • Midpoint now implies ~16% growth over 2021
         Net Income (GAAP)                                                $230 - $310                   $315 - $375                               • Growing producer momentum in supportive
                                                                                                                                                    commodity environment drives improved
         Adjusted EBITDA, net to EnLink2,3                             $1,110 - $1,190               $1,190 - $1,250                                outlook in 2022 and 2023
         Capex, net to EnLink, & Plant                                                                                                            Robust Free Cash Flow
                                                                          $285 - $325                   $325 - $365
         Relocation Costs4                                                                                                                        • Increased midpoint represents the 3rd
            Growth Capex, net to EnLink, & Plant                                                                                                    consecutive year of FCFAD in excess of
                                                                           $230 - $260                   $280 - $310                                $300MM, despite increased investment in our
            Relocation Costs
                                                                                                                                                    asset base
            Maintenance Capex, net to EnLink                                 $55 - $65                     $45 - $55
                                                                                                                                                  Capital Discipline
         Free Cash Flow After             Distributions2                  $285 - $345                   $320 - $370                               • Incremental 2022 investment supports significant
                                                                                                                                                    volume growth in 2023
         Annualized 1Q22 Distribution per                                                                                                         • Capital spend leverages existing infrastructure to
                                                                           $0.45/unit                    $0.45/unit
         Common Unit                                                                                                                                drive high return, low risk, and quick payback
                                                                                                                                                    projects
          Updated Commodity Price Assumptions (average):                                                                                     Balance Sheet Strength
     ▪      NGL basket $1.08/gallon and Henry Hub $6.50/MMBtu                                                                                • Strong financial position provides ample flexibility
                                                                                                                                             • Increasing return of capital to common unitholders,
                                                                                                                                                   while investing in the business

1Reflects
       updated 2022 Guidance issued May 3, 2022. 2Non-GAAP measures are defined in the appendix. 3Adjusted EBITDA does not reflect the one-time
$45MM expense related to Project Phantom. 4Includes $45MM classified as operating expense for GAAP purposes.                                                           May 2022 Investor Presentation    15
INCREASED 2022 SEGMENT GUIDANCE
GROWTH ACROSS EACH OF THE FOUR SEGMENTS, OUTLOOK FOR 2023 STENGTHENS
Previous Updated 2022 Segment Profit Guidance1
2021 2022 Segment
Segment
Segment Segment Profit Less
Capex
Profit Profit Low Mid High % of Total Capex
$MM Midpoint
PERMIAN $2302 $3203 $320 $3403 $360 ~25% $185 $155
Plant Relocation
Expense $252 $403 $403
LOUISIANA $325 $355 $370 $375 $380 ~30% $35 $340
OKLAHOMA $3282 $3453 $350 $3603 $370 ~25% $55 $305
Plant Relocation
Expense $32 $53 $53
NORTH TEXAS $251 $230 $240 $245 $250 ~20% $15 $230
1Reflects
updated 2022 Guidance issued May 3, 2022. 2Permian and Oklahoma include $24.9MM and $3.3MM, respectively, related to War Horse plant relocation as an
operating expense in segment profit in accordance with GAAP. 3Permian and Oklahoma include $40MM and $5MM, respectively, related to Phantom plant relocation as an May 2022 Investor Presentation 16
operating expense in segment profit in accordance with GAAP.2022 CAPITAL EXPENDITURES & PLANT RELOCATION COSTS
DISCIPLINED, LOW RISK, QUICK PAYBACK CAPITAL EXPENDITURES PROGRAM
2022 Total Capital Expenditures, Net to EnLink Total Capital Expenditures, Net to EnLink,
and Plant Relocation Costs and Plant Relocation Costs ($MM)
$325MM – $365MM $646 ▼ ~47%
(vs. 2019)
Permian1
65% $325 – $365
2022E $219 $220
3% Corporate
4%
North Texas
10%
18% Louisiana 2019 2020 2021 Updated 2022
Guidance
Oklahoma1
Well connects Maintenance Plant Other
Incremental 2022 investment supports significant volume 2022 projects focused on highly efficient well connect
growth in 2023 capital and additional Permian processing capacity
1Permianand Oklahoma include $40MM and $5MM, respectively, of plant relocation costs, which are classified as operating expense in
accordance with GAAP. May 2022 Investor Presentation 172022 CAPITAL ALLOCATION
BALANCED CAPITAL ALLOCATION APPROACH
2022E Distributable Cash Flow
$345
Uses of DCF
FCFAD
$860MM Growth Capex &
Plant Relocations
Maintain significant
20% distribution
Disciplined growth FCFAD and financial $220
increase in 4Q21 $295
flexibility Common
Distributions
2022E FCFAD
$50 1Q22 Pfd B
Financial Flexibility
Repurchase
Return of Capital
$170 $345MM to Common
Repurchased Expect to increase $125 Unitholders
Repurchased Opportunity to
$23MM of return of capital by Growth
incremental fund incremental
common units1 25%+ through Projects/Leverage
$50MM of Pfd B in high return
under $100MM buybacks and Reduction
1Q22 authorization in 1Q distributions projects
1Includes$6MM of common units repurchased from GIP pursuant to the previously disclosed Unit Repurchase Agreement dated February 15, 2022 and which settled on
May 2, 2022. These represent GIP’s pro-rata share of aggregate units repurchased from February 15 through March 31, 2022. May 2022 Investor Presentation 18BECOMING
THE FUTURE
OF MIDSTREAM
CREATING
SUSTAINABLE
VALUE
CARBON SOLUTIONS
Strategic advantage in
building a scalable
CCS businessWHAT IS CCS?
PROVEN MIDSTREAM BUSINESS CAPACITY
TECHNOLOGY
CCS utilizes existing proven technology
Transporting CO2 is very similar to Class VI sequestration wells are similar
Capture technology is very similar to moving hydrocarbons to disposal wells
natural gas gathering, compression
and processing
May 2022 Investor Presentation 20UNPARALLELED NEED FOR GLOBAL CCS
The IEA’s Net Zero by 2050 Scenario outlines a 7,600 8,000
carbon reduction pathway that is compliant with 7,000
the Paris Agreement 5,600 6,000
Annual Million Metric Tonnes
5,000
4,000
To meet net-zero emissions globally, CCS is
expected to account for ~37% of all CO2 3,000
reduction from industry 1,600 2,000
1,000
40
CCS 0
Material efficiency
Hydrogen
Bioenergy
Other renewables Global CO2 captured will have to increase to
Electrification ~7.6 billion metric tonnes per year by 2050
Other fuel shifts
Energy efficiency
Source: IEA - Net Zero by 2050, A Roadmap for the Global Energy Sector.
May 2022 Investor Presentation 21SIGNIFICANT OPPORTUNITY FOR ENLINK IN LOUISIANA
LOUISIANA IS ONE OF THE HIGHEST INDUSTRIAL CO2 EMITTERS IN THE COUNTRY
Total U.S. CO2 Emissions 5.2 billion1 metric
Tonnes of CO2
Total Industrial & Power
CO2 Emissions Industry is 47% of
total CO2
Louisiana Industrial & Power LA 2nd largest
• Louisiana has the 2nd highest industrial CO2
CO2 Emissions Industrial CO2
emissions in the United States2
emitter2
80MM
• The Mississippi River corridor makes up nearly 2/3
Mississippi River corridor CO2 Metric of Louisiana's total industrial CO2 emissions
Tonnes of
CO2
Source: EPA. 1EPA Greenhouse Gas Inventory Data Explorer 2019. 2EPA FLIGHT Tool.
May 2022 Investor Presentation 22INCREASED POTENTIAL UNDER EXPANDED 45Q
SIGNIFICANT BIPARTISAN SUPPORT FOR INCREASED 45Q CREDITS AND DIRECT PAY
Estimated Capture Cost per Industry2 100
($/tonnes)
90
Proposed1 45Q Credit for
Current economics sufficient Dedicated Storage
80
for emitters EnLink is
70
targeting
60
Mississippi River corridor has Current 45Q Credit for
50
gas processing, ammonia, Dedicated Storage
chemicals and hydrogen 40
30
▪ Average Estimated Cost
20
Opportunity significantly
expands with proposed 10
changes to 45Q 0
1ProposedHouse Reconciliation as of 10/28/2021 and CATCH ACT. Includes prevailing wage requirements 2Great Plains Institute “Transport Infrastructure for
Carbon Capture and Storage” June 2020. May 2022 Investor Presentation 23BEST POSITIONED TO PROVIDE CCS IN LOUISIANA
ENLINK HAS ALL THE ELEMENTS FOR A FULL-SERVICE CCS BUSINESS
✓ Customer-focused mindset with decades of relationships in the Louisiana market
✓ Extensive experience operating transportation assets, including compression, dehydration,
pumping and pipelines, with 4,000 miles of pipe located in Louisiana
✓ Decades of experience structuring and executing commercial contracts to
accommodate customer needs
✓ Significant experience operating cryogenic and amine process equipment with 22
processing facilities across the country
✓ Experienced engineering, operations, commercial and back-office staff, with 230 of our
1,100 employees based in Louisiana
✓ Access to significant acreage position for future sequestration sites with ample capacity in
close proximity to existing pipeline infrastructure
May 2022 Investor Presentation 24ENLINK’S CARBON CAPTURE BUSINESS POTENTIAL
UNIQUE EXISTING FOOTPRINT IN ONE OF THE LARGEST EMITTING AND STORAGE STATES
• Louisiana is the 2nd largest industrial CO2 emitting1 state in the
United States
o Heavy concentration along the Mississippi River corridor with
80 million metric tonnes of CO2 per year
• Louisiana has the 2nd largest sequestration potential2 due to its
geology
• EnLink currently connects to, or has pipeline within several miles
of the majority of industrial emitters in the region
• Existing large-diameter pipelines are well-suited for CO2 service
• EnLink would need minimal newbuild pipelines, resulting in a
significant competitive cost advantage
1EIA Total carbon dioxide emissions state rankings 2018 report 2Great Plains Institute “Transport Infrastructure for Carbon Capture and Storage”.
May 2022 Investor Presentation 25ENLINK CARBON SOLUTIONS STRATEGY
DEVELOP COMPLETE PACKAGE AND BECOME THE PREFERRED CCS OPERATOR IN LOUISIANA
Secure CCS Agreements
•Provide economic solution to industrial emitters
•Outstanding CCS proposals representing significant amounts of CO2 in Louisiana
Baton Rouge Area
Total Emissions (mtpa): 19.2
Total Emitter Count: 33
Repurpose Existing Pipeline to Benefit All Parties
•Improves project timeline and economics
St. Charles Area
Total Emissions (mtpa): 28.0 •Reduces impact in environmentally sensitive areas
Total Emitter Count: 27
Geismar Area
Scale Up
Total Emissions (mtpa): 7.9
Total Emitter Count: 25
Donaldsonville Area •Network with many CO2 input points and sequestration locations
Total Emissions (mtpa): 14.2 •Lower marginal cost of adding customers and sequestration sites
Total Emitter Count: 13
Align with Companies that Bring Assets and Expertise
•Signed LOI with Oxy Low Carbon Ventures for CO2 transportation
•Full-service CCS offering with Talos Energy (NYSE: TALO), including access to 26,000 acres
providing estimated sequestration capacity of over 500 million metric tonnes
•Expect additional future relationships for sequestration and/or complementary services
Source: EPA.
May 2022 Investor Presentation 26SIGNED FIRST CUSTOMER: OXY LOW CARBON VENTURES
PROVIDE CO2 TRANSPORTATION TO OLCV IN THE MISSISSIPPI RIVER CORRIDOR
Letter of Intent with Oxy Low Carbon Ventures
• EnLink executed LOI for a Transportation Service Agreement (TSA) with Oxy Low Carbon Ventures, LLC
(OLCV), a subsidiary of Occidental (NYSE: OXY), to provide CO2 transportation services for OLCV along the
Mississippi River Corridor from Waggaman to Baton Rouge
• EnLink would utilize existing and newbuild pipelines and related infrastructure to transport CO 2
• Pipelines would connect to OLCV’s planned sequestration facility in Livingston Parish, where OLCV has
secured pore space lease of over 30,000 acres
May 2022 Investor Presentation 27SIGNED MOU WITH TALOS TO PROVIDE FULL CCS SOLUTION
CO2 CAPTURE, TRANSPORTATION AND SEQUESTRATION SERVICES
A JOINT SERVICE OFFERING
• Recently executed MOU provides for complete CCS service offering
o EnLink provides midstream assets and expertise
o Talos provides subsurface assets and expertise
• Focused on the Mississippi River corridor from New Orleans to Baton
Rouge
• Talos provides subsurface operating expertise with extensive
knowledge of Gulf Coast geology
o Long history operating in the onshore & offshore Gulf Coast Region
• Talos recently executed agreements with a large landowner in
southern Louisiana providing significant CO2 sequestration sites
o Approximately 26,000 surface acres in Iberville, St. James, Assumption and
Lafourche Parishes providing capacity of over 500 million metric tonnes for
permanent carbon sequestration in the area
o Excellent structural geology and rock properties for CO2 service
o Very proximate to existing EnLink pipelines that are well suited for conversion to
CO2 service
• EnLink has identified existing pipelines that will be utilized for CO 2
transportation
May 2022 Investor Presentation 28EXECUTION PLAN PRIORITIES
2022 EXECUTION PLAN PRIORITIES
FOCUSED ON DRIVING SUSTAINABLE VALUE
Financial
Operational Strategic Sustainability
Discipline &
Excellence Growth & Safety
Flexibility
Rigorous program centered on Delivering significant Deliberate and Disciplined ~90% of EnLink’s current
innovation and continuous deleveraging, while investing Growth business is natural gas and
improvement in the business • Strong producer activity natural gas liquids focused
• Closed 25 operational Robust FCFAD generation drives strengthening the growth
• • Sustainability and safety are
excellence initiatives in 2021, financial flexibility outlook for 2022 and 2023
integrated into all aspects of
delivering process efficiencies volumes and cash flow
our business
and savings • Increased 2022 financial • Potential downstream
guidance 6% at midpoint, • Carbon capture project at
projects with attractive
• Implement remote operations at which implies 16% growth over Bridgeport plant advances
2021 returns in lower commodity
processing plants emission reduction goals,
price environment
while generating modest
• Utilize technology to automate • Put in place attractive AR • Validation of CCS strategy profit
processes facility and have grown and and opportunity with
improved pricing twice • First quarter of 2022 marked
additional
• Mobile operator application the first time in 1Q with no
• Pivoting to more balanced commercialization with Oxy
rolled out across EnLink recordable injuries
capital allocation that includes Low Carbon Ventures
higher returns to equity holders; • Created Supplier Code of
• Technology and innovation Conduct covering human
drive next level of efficiency instituted unit repurchase
program and labor rights
Innovation & continuous improvement reducing costs, reducing carbon footprint & enhancing profitability companywide
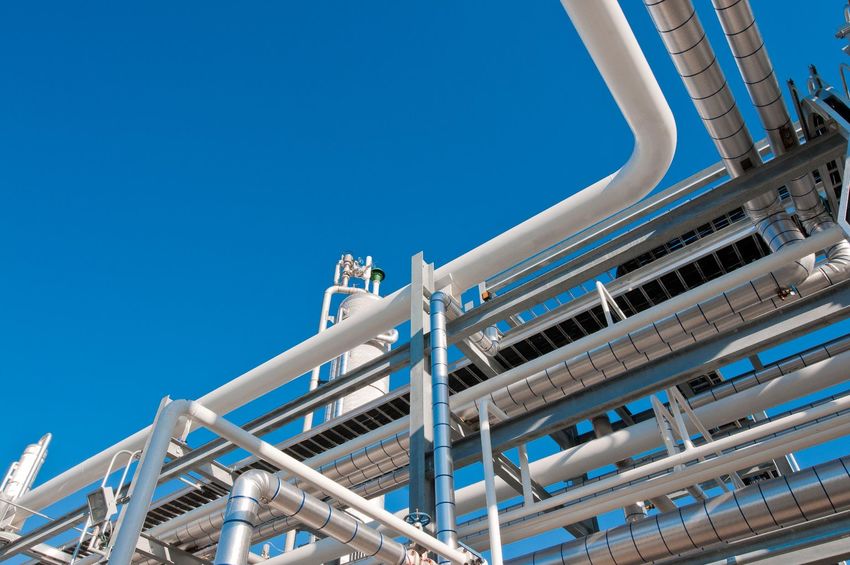
May 2022 Investor Presentation 30MATTERHORN EXPRESS PIPELINE
EXPANDING DOWNSTREAM EXPOSURE THROUGH PERMIAN TAKEAWAY TRANSPORTATION INVESTMENT
Matterhorn Express Pipeline
• Transportation capacity of up to 2.5 Bcf/d from
Waha to Katy, TX through 490 miles of 42” pipe
• Direct connections to processing facilities in the
Midland Basin through approximately 75-mile
lateral
Permian Basin
Waha • Final investment decision reached May 2022
• Expected in-service date 3Q24
• Equity partners include WhiteWater Midstream
(operator), EnLink (15% interest), Devon and
MPLX
• Project financing to be put in place at the
partnership level
• EnLink’s total expected 15% equity investment:
~$100MM of which ~$70MM is expected to be
spent in 2022 with the balance in 2023
May 2022 Investor Presentation 31CRESTWOOD NORTH TEXAS ACQUISITION1
SIGNIFICANT SYNERGIES AND REDEPLOYMENT OF ASSETS RESULT IN ATTRACTIVE ECONOMICS
Deployment of “The EnLink Way” Creates Significant Value
• Significant synergies, minimal integration capital, and significant capital avoidance – Plan to
integrate with EnLink’s footprint and redeploy assets to EnLink’s other segments, including the
Permian segment in the near-term and the Carbon Solutions business in the future
• Significant reduction to EnLink’s 2023 capital expenditures as a result of redeployment of
acquired assets, mostly compression
• Improves emission intensity profile in North Texas segment with high mix of electric compression
• Potential additional CCUS opportunities aimed at meeting carbon intensity reduction
objectives
Asset Overview
• Expands position in prolific producing basin with proximity to incremental LNG exports along
Gulf Coast
• 500 miles of lean and rich gas gathering pipeline
• Includes three processing plants with 425 MMcf/d of capacity (available for future relocation)
Attractive Economics
• $275 million cash consideration
• ~4x EBITDA and high teens unlevered return, driven by operational synergies and
redeployment of assets
o Upside from potential incremental drilling
• High 2023E DCF and FCFAD accretion and leverage neutral
• No change to EnLink’s balanced capital allocation approach
1EnLinkhas entered into a definitive agreement to acquire Crestwood’s North Texas gathering and
processing assets for $275 million, subject to certain customary adjustments and regulatory approval. May 2022 Investor Presentation 32CAPITAL-LIGHT APPROACH TO PERMIAN GROWTH
MEETING ROBUST GOWTH WITH HIGH-RETURN, CAPITAL-EFFICIENT PROJECTS
Creative, Capital Light Expansion of Processing Increasing Midland Capacity ~70% with
Capacity Capital Light Expansions
• Continue to expand Midland processing volumes for 863
minimal capex through design improvements and
optimizing asset footprint
• 2021 legacy expansions for ~$5MM
663
o Midmar West: 15 MMcf/d
o Midmar East: 20 MMcf/d 568
Phantom
o Riptide: 20 MMcf/d 513 (+200 MMcf/d)
War Horse
• Project War Horse for ~$35MM Legacy
and
Expansion
o Initial Plant relocation: 80 MMcf/d Expansions (+95 MMcf/d)
(+55 MMcf/d)
o Plant optimization: 15 MMcf/d
• Project Phantom for ~$80MM
o 200 MMcf/d
Early 2021 Mid 2021 Exit 2021 Exit 2022
• Total Permian capital expenditures, net to EnLink and Midland Processing Capacity (MMcf/d)
Plant relocation costs saved ~$145MM versus Added new capacity forAMPLE FINANCIAL FLEXIBILITY
SUBSTANTIAL LIQUIDITY AND LONG-TERM DEBT MATURITY PROFILE PROVIDES FINANCIAL FLEXIBILITY
Revolving Financial Flexibility
Credit Facility
($MM)
✓ Ba1 / BB+ / BB+
✓ Leverage ratio of 3.8x
✓ No near-term senior note maturities
$1.75B
✓ 32% of long-term senior notes mature in 20+ years
1,750
undrawn
500
$35MM
undrawn 315
15 Years 450
721
522 491 500 499
350
2022 2023 2024 2025 2026 2027 2028 2029 2030 2031 2032 2033 2034 2044+
Senior Notes Undrawn Capacity Term Loan A/R Facility
May 2022 Investor Presentation 34FOURTH ANNUAL SUSTAINABILITY REPORT ISSUED
VISIT HTTP://SUSTAINABILITY.ENLINK.COM FOR 2021 ESG PROGRESS AND PERFORMANCE DATA
• Adopted near-term emissions targets, including a 30% reduction1 in scope 1 methane emissions intensity by 2024; reduced
~1,500 MT of methane emissions and ~38,000 MT of CO₂e in 2021
Sustainability is in • Received emissions reduction incentive grants from the Texas Commission on Environmental Quality, totaling up to $4.4MM for
EnLink’s DNA 13 projects that are anticipated to save ~57 MT of nitrogen oxide emissions each year, equal to over 7,000 MT of CO₂e
• Supporting climate change research through participation in research project led by the University of Oklahoma to study the
impact of greenhouse gas emissions
• Achieved EnLink’s lowest TRIR at 0.44, which is 38% better than the 2020 GPA Midstream Division One TRIR average2 of 0.715
• Supported communities through volunteering over 740 hours during our Month of Service & made available 50,000 gallons of
propane to Louisianans following Hurricane Ida
• Ended 2021 with 31% women and 20% minorities in corporate management roles, better than the industry average3
• Achieved 100% management participation in “inclusive leadership training” and 100% completion of annual, companywide
“Preventing Workplace Harassment”
• Adopted Supplier Code of Conduct that outlines expectations for human rights, labor practices, environment and safety
responsibilities, ethics, and asset protection
• New in 2022: Launched a diversity recruitment tool to better reach and track diverse hires
• Strengthened governance through formation of a Sustainability Committee of our Board of Directors
• Sustainability is 15% of our 2021 companywide bonus plan, which is a 50% increase over previous year’s plan
• Targeted executive compensation at market median (50th percentile) for each executive with 80% of compensation tied to
performance-driven incentives
• Continued to evolve cybersecurity & achieved 100% employee participation in required cybersecurity training
• Shared four years of ESG performance data and utilized SASB framework
• Coming soon: Adopting the Energy Infrastructure Council & GPA Midstream’s ESG reporting template in summer 2022
ESG Rating Improvement: EnLink scored in top third of companies and improved our score by 15.5 points,
the highest improvement among our peer group in the Wells Fargo Midstream ESG Scorecard, issued January 13, 2022
1Ascompared to 2020 scope 1 emissions levels. 22021 industry numbers were not yet available as of 5/3/22. 3EnLink demographic data as of 12/31/21; industry average from
Wells Fargo Midstream ESG Scorecard, published 1/13/22.
May 2022 Investor Presentation 35APPENDIX
1Q22 CAPITAL EXPENDITURES AND RELOCATION COSTS
   CAPITAL-LIGHT FOCUS AND INCREMENTAL DRILLING ACTIVITY DRIVE HIGH-RETURN PROJECTS

                            Capital Expenditures1                                            Capital Spending by Project Type1                               Capital Spending by Segment1
                                         ($MM)                                                            Net to EnLink       ($MM)2                                   Net to EnLink (1Q22)

                  Segment                                      1Q22                        ✓ Continued to connect highly
                                                                                             accretive wells in Permian and                                                                    57%
                  Permian                                      $43.1                         STACK                                                                                            Permian
                                                                                           ✓ Project Phantom is underway                                    27%
                  Louisiana                                     $5.7                                                                                      Oklahoma

                  Oklahoma                                     $17.8
                                                                                                                    $17                   Plants
                  North Texas                                   $3.1                                                                                                          $66MM
                                                                                                                     $8               Crude Connects
                  Corporate                                     $1.6
                                                                                                                    $14               Maintenance
                  Total                                        $71.3
                                                                                                                                          Natural Gas
                  JV Contributions                            ($5.6)                                                $24                   Well Connects           2%
                                                                                                                                                                  Corp     9%           5%
                  Net to EnLink                                $65.7                                                                                                     Louisiana North Texas
                                                                                                                  1Q22

1Includes$8.9MM and $2.4MM for 1Q22 Permian and Oklahoma, respectively, for relocation costs related to plant relocations classified as
operating expenses in accordance with GAAP. 2Totals may not sum due to rounding.                                                                                           May 2022 Investor Presentation   37
2021-2022 ADJUSTED EBITDA BRIDGE
2022 FORECASTED TO BE ANOTHER YEAR OF STRONG GROWTH
Adjusted EBITDA forecasted to grow over 16% at the
midpoint over 2021
$1,190 – 1,250
$1,110 – 1,190
$1,040 $1,050 (+) Strong
$970 (+) Permian & LA
Commodity
Environment,
(+) Increased Growth, Growth
Producer OK & NTX Accelerating in
Activity, Stability All Segments
Improved
Commodity
Environment &
Cost Efficiencies
Initial 2021 Revised 2021 2021 Actual Previous 2022 Updated 2022
Guidance Guidance Guidance Guidance
Midpoint Midpoint
Continued Commodity Strength Drives Higher Activity and Sets Stage for Growth in 2023
May 2022 Investor Presentation 38QUARTERLY VOLUMES (PERMIAN, LOUISIANA)
Permian
GAS GATHERING GAS PROCESSING CRUDE
(1,000 MMBtu/d) (1,000 MMBtu/d) (Mbbls/d)
1,347
158 150 151
1,201 1,256
122
1,112 1,139 108
1,026 1,063
926 958
876
1Q21 2Q21 3Q21 4Q21 1Q22 1Q21 2Q21 3Q21 4Q21 1Q22 1Q21 2Q21 3Q21 4Q21 1Q22
Louisiana
GAS TRANSPORTATION CRUDE - ORV NGL FRACTIONATION
(1,000 MMBtu/d) (Mbbls/d) (Mbbls/d)
18 184 189 191
2,338 2,498 169 168
2,151 2,139 2,014
16 16
15 15
1Q21 2Q21 3Q21 4Q21 1Q22 1Q21 2Q21 3Q21 4Q21 1Q22 1Q21 2Q21 3Q21 4Q21 1Q22
Note: Includes volumes associated with non-controlling interests. May 2022 Investor Presentation 39QUARTERLY VOLUMES (OKLAHOMA, NORTH TEXAS)
Oklahoma
GAS GATHERING GAS PROCESSING CRUDE
(1,000 MMBtu/d) (1,000 MMBtu/d) (Mbbls/d)
24 24
20 19
1,016 997 1,018 1,001 955 1,040 1,004 1,041 1,030 18
937
1Q21 2Q21 3Q21 4Q21 1Q22 1Q21 2Q21 3Q21 4Q21 1Q22 1Q21 2Q21 3Q21 4Q21 1Q22
North Texas
GAS GATHERING (1,000 GAS PROCESSING
MMBtu/d) (1,000 MMBtu/d)
1,357 1,377 1,378 1,397 1,364
625 628 628 646 614
1Q21 2Q21 3Q21 4Q21 1Q22 1Q21 2Q21 3Q21 4Q21 1Q22
May 2022 Investor Presentation 40QUARTERLY SEGMENT PROFIT & VOLUMES
3 Months Ended
$ amounts in millions unless otherwise noted Mar. 31, 2021 Jun. 30, 2021 Sep. 30, 2021 Dec. 31, 2021 Mar. 31, 2022
Permian
Segment Profit $42.8 $44.0 $69.1 $73.8 $73.0
Adjusted Gross Margin $31.0 $71.4 $106.4 $102.4 $118.3
Gathering and Transportation (MMBtu/d) 925,600 1,025,900 1,111,800 1,201,000 1,347,100
Processing (MMBtu/d) 876,100 958,400 1,062,800 1,139,200 1,256,300
Crude Oil Handling (Bbls/d) 108,200 121,900 157,500 150,100 150,700
Louisiana
Segment Profit $82.2 $67.3 $63.7 $111.7 $90.5
Adjusted Gross Margin $111.4 $99.0 $94.2 $144.0 $123.5
Gathering and Transportation (MMBtu/d) 2,151,300 2,139,300 2,013,900 2,338,400 2,497,700
NGL Fractionation (Bbls/d) 169,200 184,000 167,900 188,900 191,300
Crude Oil Handling (Bbls/d) 15,000 15,200 17,600 15,700 15,900
Brine Disposal (Bbls/d) 1,400 2,900 3,300 3,200 3,000
Oklahoma
Segment Profit $55.5 $85.6 $87.1 $99.4 $85.8
Adjusted Gross Margin $75.2 $103.4 $106.9 $122.1 $106.8
Gathering and Transportation (MMBtu/d) 937,300 1,016,200 996,900 1,018,100 1,000,700
Processing (MMBtu/d) 955,400 1,040,000 1,004,400 1,041,200 1,029,500
Crude Oil Handling (Bbls/d) 17,500 23,800 20,000 19,300 23,800
North Texas
Segment Profit $76.9 $57.9 $60.0 $56.1 $63.0
Adjusted Gross Margin $96.1 $77.8 $79.3 $75.4 $84.6
Gathering and Transportation (MMBtu/d) 1,356,900 1,377,400 1,377,600 1,397,200 1,364,000
Processing (MMBtu/d) 624,600 627,600 627,900 645,700 614,300
Note: Includes segment profit and volumes associated with non-controlling interests.
May 2022 Investor Presentation 41MIDLAND PLATFORM
Midland Overview
Multi-commodity strategy
• ~663 MMcf/d Midland Basin cryogenic
processing capacity as of the end of
1Q22:
o 7 processing facilities in operation
o Project Phantom continues to be on
pace for 2H22 in-service
• ~1,500 miles of pipeline
May 2022 Investor Presentation 42DELAWARE PLATFORM
Delaware Overview
Multi-commodity strategy
• 635 MMcf/d Delaware Basin
processing capacity:
• ~200 miles of pipeline
Note: Delaware JV is owned 50% by NGP. May 2022 Investor Presentation 43LOUISIANA PLATFORM
Louisiana Overview
Serving a growing
demand-pull market
• 5 fractionators along the Gulf Coast
o ~220 Mbbl/d of fractionation
capacity in Louisiana
• 710 MMcf/d operating natural gas
processing capacity
• 3 natural gas processing facilities with
4,000 miles of pipeline
• Cajun-Sibon NGL pipeline capacity of
~185 Mbbl/d
• 17.6 Bcf natural gas storage capacity
Note: Ascension Pipeline is 50% owned by a joint venture with a Marathon Petroleum Corp. subsidiary. EnLink owns a
38.75% interest in Gulf Coast Fractionators, which owns and operates a 145 Mbbl/d fractionator. May 2022 Investor Presentation 44CENTRAL OKLAHOMA PLATFORM
Central Oklahoma Overview
Size, Scale, & Diversification
• Operating ~960 MMcf/d of
Central Oklahoma gas
processing capacity to support
STACK development
• ~2,200 miles of pipeline
May 2022 Investor Presentation 45NORTH TEXAS PLATFORM
North Texas Overview
Anchor position in
the Barnett
• 1.08 Bcf/d operating natural gas
processing capacity
o 2 operating natural gas
processing facilities
• 15 Mbbl/d of fractionation
capacity
• ~4,200 miles of pipeline
Private
E&Ps
May 2022 Investor Presentation 46CAPITALIZATION
($ in MM) 3/31/22
Cash and cash equivalents, net to EnLink 56.4
$1.75Bn Unsecured Revolving Credit Facility due January 2024 0.0
$350MM A/R Securitization due September 2024 315.0
ENLK 4.400% Senior unsecured notes due 2024 521.8
ENLK 4.150% Senior unsecured notes due 2025 720.8
ENLK 4.850% Senior unsecured notes due 2026 491.0
ENLC 5.625% Senior unsecured notes due 2028 500.0
ENLC 5.375% Senior unsecured notes due 2029 498.7
ENLK 5.600% Senior unsecured notes due 2044 350.0
ENLK 5.050% Senior unsecured notes due 2045 450.0
ENLK 5.450% Senior unsecured notes due 2047 500.0
Net Debt 4,290.9
Series B Preferred Units 812.5
Series C Preferred Units 400.0
Members Equity1 4,743.9
Total Capitalization 10,247.3
1Based on market value as of 3/31/2022. Unit price: $9.65, Units outstanding: 491,599,189 Common units: 483,364,767; outstanding restricted units: 8,234,422.
May 2022 Investor Presentation 47STRONG DIVERSE COUNTERPARTIES
Strong Counterparty Credit Ratings Top 10 Counterparties Limited Price Exposure
(% of FY 2021 Revenues) (% of FY 2021 Revenues) (Contract Types as % of 2021 Adjusted Gross Margin)
% of
Secured Credit Rating Industry Revenue
Collateral1
BBB Chemical 14.4%
BB
BBB Refining 13.1%
BBB- E&P 6.1%
BBB ~80%ENLINK ORGANIZATIONAL STRUCTURE
Public ENLC Global Infrastructure
Holders Partners (GIP)
Non-economic
managing interest
~48% ~42%
EnLink Midstream
Class C Unitholders1 Manager, LLC
~10% non-
economic interest EnLink Midstream, LLC
NYSE: ENLC
Series C Pref. EnLink Midstream Series B. Pref.
Unitholders Partners, LP Unitholders1
Operating Assets
Note: The ownership percentages are based upon 3/31/2022 data. 1Series B Preferred Units are convertible into ENLC units. ENLC ownership interests
are shown for voting purposes and include the ENLC Class C units that the Series B Preferred unitholders received for voting purposes only. May 2022 Investor Presentation 49GLOBAL INFRASTRUCTURE PARTNERS OVERVIEW
GIP IS A STRONG, SUPPORTIVE SPONSOR WITH SIGNIFICANT ENERGY INVESTING EXPERIENCE
Leading Asset Manager Significant Midstream Experience Supportive Sponsor
▪ $20+ billion of natural resources ✓ Operational value creation is
infrastructure investments to-date central to GIP’s investing approach
Current Investments: ✓ Dedicated “business improvement
team” of 44 experienced
✓ Global Infrastructure Partners professionals that apply best-in-
(“GIP”) is an independent class industrial tool kits to improve
infrastructure investor and one of performance of companies
largest infrastructure fund managers
in the world with ~$81 billion in AUM1 ✓ Ongoing initiatives with EnLink
management focused on:
• GIP IV is the largest infrastructure
fund raised to date at $22 billion Pluto 2
• Driving costs out and enhancing
the profitability of the business
✓ 43 current portfolio companies2 with
Realized Investments:
~99,000 employees and $61 billion in • Winning new commercial
combined revenues opportunities
✓ Deep and balanced team of 257 • Optimizing plant availability
professionals with industry, investing
and operating experience • Managing fuel efficiency and
improving sustainability across
the platform
1As of 12/31/2021. 2Including announced investments and exits.
May 2022 Investor Presentation 50UPDATED 2022 GUIDANCE RECONCILIATION OF NET INCOME TO ADJUSTED
EBITDA, DISTRIBUTABLE CASH FLOW AND FREE CASH FLOW AFTER DISTRIBUTIONS
Updated 2022 Outlook (1)
As of May 3, 2022
Net income of EnLink (2) 345
Interest expense, net of interest income 217
Depreciation and amortization 604
Income from unconsolidated affiliate investments (2)
Distribution from unconsolidated affiliate investments 1
Unit-based compensation 21
Income taxes 54
Plant relocation costs (3) 45
Other (4) (7)
Adjusted EBITDA before non-controlling interest 1,278
Non-controlling interest share of adjusted EBITDA (5) (58)
Adjusted EBITDA, net to EnLink 1,220
Interest expense, net of interest income (217)
Maintenance capital expenditures, net to EnLink (6) (50)
Preferred unit accrued cash distributions (7) (91)
Other (2)
Distributable cash flow 860
Common distributions declared (220)
Growth capital expenditures, net to EnLink & plant relocation costs (3)(6) (295)
Free cash flow after distributions 345
1) Represents the forward-looking net income guidance of EnLink Midstream, LLC for the year ended December 31, 2022. The forward-looking net income guidance excludes the potential impact of gains or losses on derivative activity, gains or losses on disposition of assets,
impairment expense, gains or losses as a result of legal settlements, gains or losses on extinguishment of debt, the financial effects of future acquisitions, proceeds from the sale of equipment, and repurchases of common units or ENLK Series B Preferred Units. The exclusion
of these items is due to the uncertainty regarding the occurrence, timing and/or amount of these events.
2) Net income includes estimated net income attributable to (i) NGP Natural Resources XI, L.P.'s ("NGP") 49.9% share of net income from the Delaware Basin JV, (ii) Marathon Petroleum Corp.'s ("Marathon") 50% share of net income from the Ascension JV.
3) Includes operating expenses that are not part of our ongoing operations incurred related to the relocation of equipment and facilities from the Thunderbird processing plant in the Oklahoma segment to the Permian segment.
4) Includes (i) estimated accretion expense associated with asset retirement obligations and (ii) estimated non-cash rent, which relates to lease incentives pro-rated over the lease term.
5) Non-controlling interest share of adjusted EBITDA includes estimates for (i) NGP’s 49.9% share of adjusted EBITDA from the Delaware Basin JV, (ii) Marathon's 50% share of adjusted EBITDA from the Ascension JV.
6) Excludes capital expenditures that are contributed by other entities and relate to the non-controlling interest share of our consolidated entities.
7) Represents the cash distributions earned by the ENLK Series B Preferred Units and ENLK Series C Preferred Units. Cash distributions to be paid to holders of the ENLK Series B Preferred Units and ENLK Series C Preferred Units are not available to common unitholders.
May 2022 Investor Presentation 51PREVIOUSLY ISSUED 2022 GUIDANCE RECONCILIATION OF NET INCOME TO ADJUSTED
EBITDA, DISTRIBUTABLE CASH FLOW AND FREE CASH FLOW AFTER DISTRIBUTIONS
2022 Outlook (1)
As of Feb 15, 2022
Net income of EnLink (2) 270
Interest expense, net of interest income 216
Depreciation and amortization 604
Income from unconsolidated affiliate investments (2)
Distribution from unconsolidated affiliate investments 1
Unit-based compensation 21
Income taxes 54
Plant relocation costs (3) 45
Other (4) (2)
Adjusted EBITDA before non-controlling interest 1,207
Non-controlling interest share of adjusted EBITDA (5) (57)
Adjusted EBITDA, net to EnLink 1,150
Interest expense, net of interest income (217)
Maintenance capital expenditures, net to EnLink (6) (60)
Preferred unit accrued cash distributions (7) (95)
Distributable cash flow 778
Common distributions declared (218)
Growth capital expenditures, net to EnLink & plant relocation costs (3)(6) (245)
Free cash flow after distributions 315
1) Represents the forward-looking net income guidance of EnLink Midstream, LLC for the year ended December 31, 2022. The forward-looking net income guidance excludes the potential impact of gains or losses on derivative activity, gains or losses on disposition of assets,
impairment expense, gains or losses as a result of legal settlements, gains or losses on extinguishment of debt, the financial effects of future acquisitions, proceeds from the sale of equipment, and repurchases of common units or ENLK Series B Preferred Units. The exclusion
of these items is due to the uncertainty regarding the occurrence, timing and/or amount of these events.
2) Net income includes estimated net income attributable to (i) NGP Natural Resources XI, L.P.'s ("NGP") 49.9% share of net income from the Delaware Basin JV, (ii) Marathon Petroleum Corp.'s ("Marathon") 50% share of net income from the Ascension JV.
3) Includes operating expenses that are not part of our ongoing operations incurred related to the relocation of equipment and facilities from the Thunderbird processing plant in the Oklahoma segment to the Permian segment.
4) Includes (i) estimated accretion expense associated with asset retirement obligations and (ii) estimated non-cash rent, which relates to lease incentives pro-rated over the lease term.
5) Non-controlling interest share of adjusted EBITDA includes estimates for (i) NGP’s 49.9% share of adjusted EBITDA from the Delaware Basin JV, (ii) Marathon's 50% share of adjusted EBITDA from the Ascension JV.
6) Excludes capital expenditures that are contributed by other entities and relate to the non-controlling interest share of our consolidated entities.
7) Represents the cash distributions earned by the ENLK Series B Preferred Units and ENLK Series C Preferred Units. Cash distributions to be paid to holders of the ENLK Series B Preferred Units and ENLK Series C Preferred Units are not available to common unitholders.
May 2022 Investor Presentation 52RECONCILIATION OF NET CASH PROVIDED BY OPERATING ACTIVITIES
TO ADJUSTED EBITDA AND FREE CASH FLOW AFTER DISTRIBUTIONS
Three Months Ended
3/31/2021 6/30/2021 9/30/2021 12/31/2021 3/31/2022
Net cash provided by operating activities $225.8 $176.4 $197.0 $258.1 $307.7
Interest expense (1) 55.9 55.6 55.1 54.4 53.7
Payments to terminate interest rate swaps (2) - 1.3 0.5 - -
Utility credits, net of usage (3) 40.4 3.4 (5.6) (5.6) (5.6)
Accruals for settled commodity swap transactions 0.1 (2.6) (2.1) 6.7 (2.2)
Distributions from unconsolidated affiliate investment in excess of earnings 3.6 0.1 0.1 0.1 0.2
Costs associated with the relocation of processing facilities (4) 7.6 10.2 8.8 1.7 11.3
Other (5) 1.2 1.4 (0.2) - 1.7
Changes in operating assets and liabilities, which (provided) used cash:
Accounts receivable, accrued revenues, inventories, and other 17.5 91.7 167.6 (3.3) 172.7
Accounts payable, accrued product purchases, and other accrued liabilities (95.6) (67.7) (153.2) (11.8) (222.6)
Adjusted EBITDA before non-controlling interest 256.5 269.8 268.0 300.3 316.9
Non-controlling interest share of adjusted EBITDA from joint ventures (6) (7.1) (12.3) (11.6) (13.9) (12.6)
Adjusted EBITDA, net to ENLC 249.4 257.5 256.4 286.4 304.3
Growth capital expenditures, net to ENLC (7) (15.9) (40.0) (33.2) (76.2) (40.5)
Maintenance capital expenditures, net to ENLC (7) (4.7) (7.5) (6.9) (7.0) (13.9)
Distributions declared on common units (46.7) (46.7) (46.6) (55.2) (55.5)
Interest expense, net of interest income (60.0) (60.0) (60.1) (58.6) (55.1)
ENLK preferred unit accrued cash distributions (8) (23.0) (23.0) (23.0) (25.3) (23.5)
Relocation costs associated with the relocation of processing facility (4) (7.6) (10.2) (8.8) (1.7) (11.3)
Non-cash interest expense 2.2 2.4 2.7 2.2 -
Payments to terminate interest rate swaps (2) - (1.3) (0.5) - -
Other (9) 0.5 0.3 0.5 2.8 0.4
Free cash flow after distributions $94.2 $71.5 $80.5 $67.4 $104.9
1) Net of amortization of debt issuance costs and discount and premium, which are included in interest expense, but not included in net cash provided by operating activities, and non-cash interest income/(expense), which is netted against interest expense, but not included in
adjusted EBITDA.
2) Represents cash paid for the early terminations of our interest rate swaps due to the partial repayments of the Term Loan in May and September 2021.
3) Under our utility agreements, we are entitled to a base load of electricity and pay or receive credits, based on market pricing, when we exceed or do not use the base load amounts.
4) Represents cost incurred that are not part of our ongoing operations related to the relocation of equipment and facilities from the Thunderbird processing plant and Battle Ridge processing plant in the Oklahoma segment to the Permian segment. The relocation of equipment
and facilities from the Battle Ridge processing plant was completed in the third quarter of 2021 and we expect to complete the relocation of equipment and facilities from the Thunderbird processing plant in the fourth quarter of 2022
5) Includes current income tax expense; transaction costs; and non-cash rent, which relates to lease incentives pro-rated over the lease term.
6) Non-controlling interest share of adjusted EBITDA from joint ventures includes NGP’s 49.9% share of adjusted EBITDA from the Delaware Basin JV, Marathon Petroleum Corporation’s 50.0% share of adjusted EBITDA from the Ascension JV.
7) Excludes capital expenditures that were contributed by other entities and relate to the non-controlling interest share of our consolidated entities.
8) Represents the cash distributions earned by the Series B Preferred Units and Series C Preferred Units, which are not available to common unitholders.
9) Includes current income tax expense, and proceeds from the sale of surplus or unused equipment and land, which occurred in the normal operation of our business and did not include major divestitures.
May 2022 Investor Presentation 53You can also read