Q1 2022 Earnings Conference Call - NASDAQ: EQIX Presented on April 27, 2022 - Equinix's Investor
←
→
Page content transcription
If your browser does not render page correctly, please read the page content below
Q1 2022 Earnings
Conference Call
NASDAQ: EQIX
Presented on April 27, 2022
© 2022 Equinix.com 1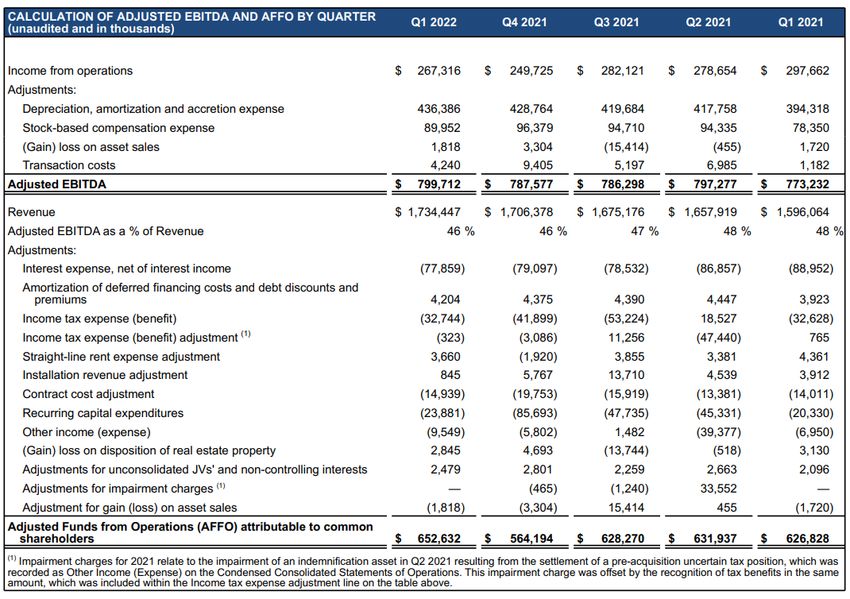
Public Disclosure Statement
Forward-Looking Statements
Except for historical information, this presentation contains forward-looking statements which include words such as “believe,” “anticipate,”
and “expect”. These forward-looking statements involve risks and uncertainties that may cause Equinix’s actual results to differ materially
from the expectations discussed in such forward-looking statements. Factors that might cause such differences include, but are not limited
to, risks to our business and operating results related to the COVID-19 pandemic; the current inflationary environment; increased costs to
procure power and the general volatility in the global energy market; the challenges of acquiring, operating and constructing IBX data
centers and developing, deploying and delivering Equinix products and solutions; unanticipated costs or difficulties relating to the
integration of companies we have acquired or will acquire into Equinix; a failure to receive significant revenues from customers in recently
built-out or acquired data centers; failure to complete any financing arrangements contemplated from time to time; competition from
existing and new competitors; the ability to generate sufficient cash flow or otherwise obtain funds to repay new or outstanding
indebtedness; the loss or decline in business from our key customers; risks related to our taxation as a REIT and other risks described
from time to time in Equinix filings with the Securities and Exchange Commission. Refer to our annual report on Form 10-K filed with the
SEC on February 18, 2022. In addition, the COVID-19 pandemic and the global economic climate may amplify many of the risks described
above and in our filings. Equinix does not assume any obligation to update the forward-looking information contained in this presentation.
Non-GAAP Information
This presentation contains references to certain non-GAAP financial measures. For definitions of terms including, but not limited to, “Cash
Gross Profit,” “Cash Gross Margins,” “Cash SG&A,” “Adjusted EBITDA,” “Funds From Operations,” “Adjusted Funds From Operations,”
and “Adjusted Net Operating Income,” and a detailed reconciliation between the non-GAAP financial results presented in this presentation
and the corresponding GAAP measures, please refer to the supplemental data and the appendix of this presentation.
© 2022 Equinix.com 2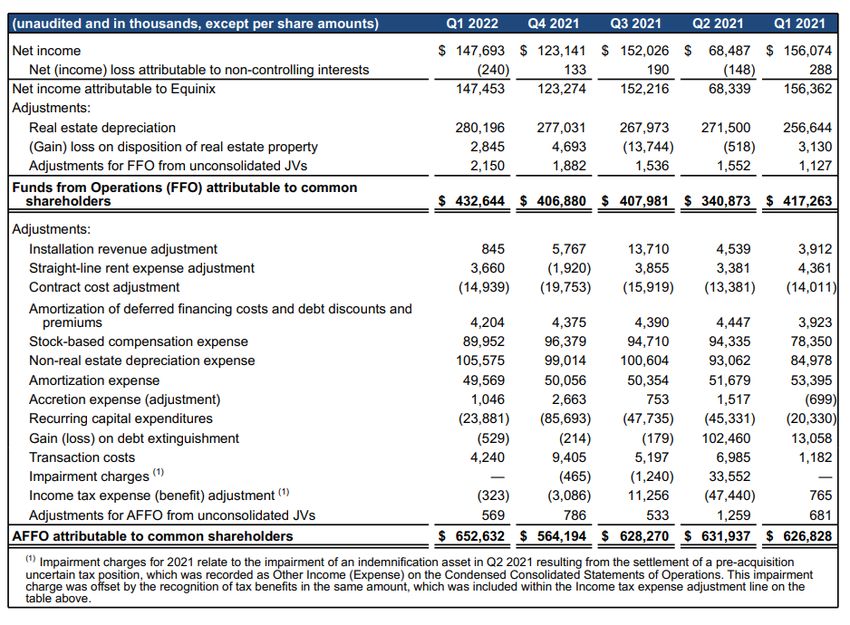
Q1 2022 Financial Highlights
Revenues Recurring Revenues Non-recurring Revenues Revenues Growth
Q1 22
QoQ YoY
($M) $1,706 $1,734
$1,596 $1,658 $1,675
As-reported 2% 9%
Normalized and (1)
2% 10%
$1,511 $1,564 $1,603 $1,642 Constant Currency
$1,542
(1)
Normalized MRR 3% 10%
Q1 21 Q2 21 Q3 21 Q4 21 Q1 22 Adjusted EBITDA Q1 22
Adjusted EBITDA & AFFO Growth QoQ YoY
As-reported 2% 3%
$6.98 $7.01 $6.94 $6.22 $7.16 AFFO per Share (Diluted)
Normalized and (1)
Adjusted EBITDA AFFO 2% 5%
Constant Currency
$773 $797 $786 $788 $800
Q1 22
Adjusted EBITDA AFFO Growth
margin of 46.1% QoQ YoY
or 46.4%
$653 excluding As-reported 16% 4%
$627 $632 $628 $564 integration costs
Normalized and
(1) 15% 6%
Constant Currency
Q1 21 Q2 21 Q3 21 Q4 21 Q1 22
Delivered our 77th quarter of consecutive quarterly revenue growth with record net bookings and healthy interconnection
activity benefiting from our global reach and interconnected ecosystems
(1) Revenues and adjusted EBITDA normalized for acquisitions, integration costs related to acquisitions and other adjustments. Normalized MRR excludes non-recurring revenues. AFFO normalized for the incremental net interest expense related to acquisition
financing and other gains and losses. Constant currency assumes average FX rates used in our financial results remain the same over the comparative periods and removes the impact of gains or losses related to balance sheet remeasurement
© 2022 Equinix.com 3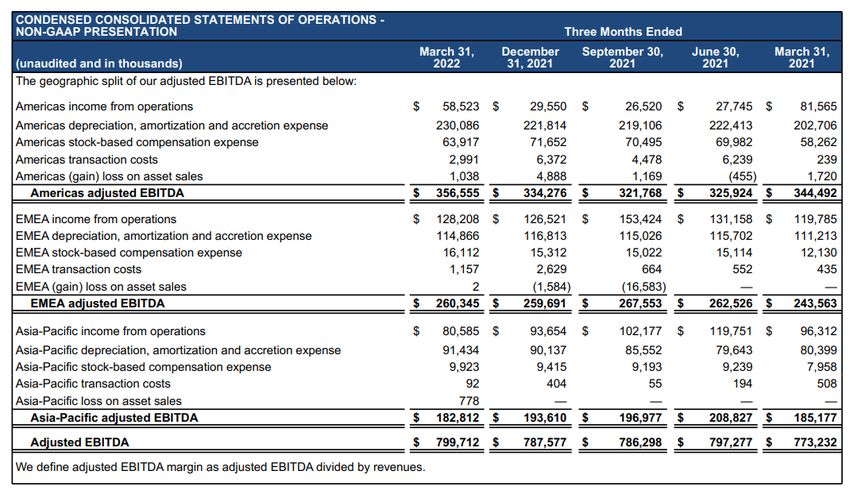
Q1 2022 Consolidated Results
(1)
(2)
(3)
(3)(4)
(3)
(1) Q1 22 Actual includes a negative foreign currency impact of approximately $5 million when compared to Q4 21 average FX rates, a negative foreign currency impact of approximately $2 million when compared to our prior FX guidance rates, and a negative
foreign currency impact of approximately $31 million when compared to Q1 21 average FX rates, including the net effect from our hedging transactions
(2) Q1 22 Actual includes a minimal foreign currency impact when compared to Q4 21 average FX rates, a negative foreign currency impact of approximately $1 million when compared to our prior FX guidance rates, and a negative foreign currency impact of
approximately $14 million when compared to Q1 21 average FX rates, including the net effect from our hedging transactions
(3) All non-financial metrics exclude assets sold to the xScale Joint Ventures (“JVs”), and assets acquired from GPX and Packet
(4) MRR per Cab excludes xScale JVs, Infomart non-IBX tenant income and GPX and Packet acquisitions. MRR per Cab up $23 QoQ on a constant currency basis. Constant currency basis assumes average FX rates used in our financial results remain the same
over the comparative periods
© 2022 Equinix.com 4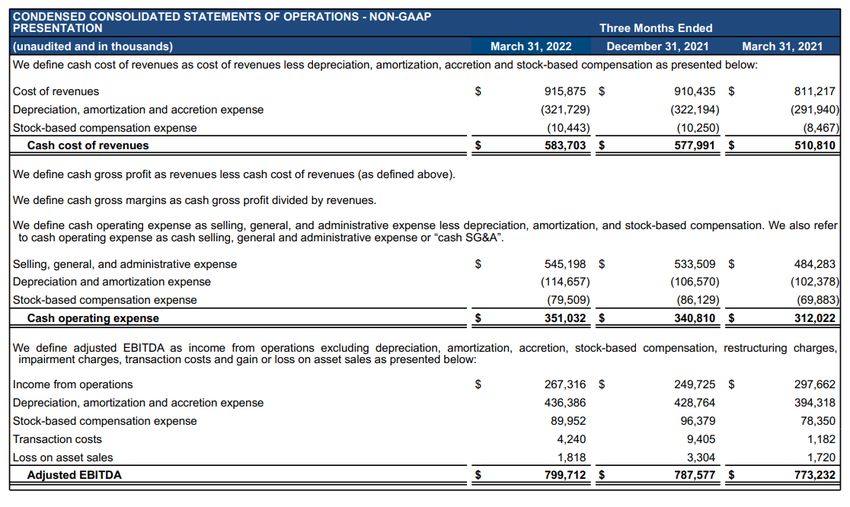
Americas Performance
Revenues
($M) Q1 22
Revenues Growth
QoQ YoY
$782 $800
$726 $751 $763 As-reported 2% 10%
Normalized and (1)
2% 10%
Constant Currency
(2)
Normalized MRR 2% 9%
Adjusted EBITDA Q1 22
Q1 21 Q2 21 Q3 21 Q4 21 Q1 22 Growth QoQ YoY
Adjusted EBITDA As-reported 7% 4%
Adjusted EBITDA Adjusted EBITDA Margin
Normalized and (1)
6% 3%
$344 $357 Constant Currency
$326 $334
$322
47.5%
(3)
44.5% Cross-connects Cabs Billing MRR per Cab Utilization
43.4%
42.7%
42.2%
170,800 104,900 $2,338 77%
1% QoQ 2% QoQ Constant Currency
QoQ $13
As-reported QoQ $4
Q1 21 Q2 21 Q3 21 Q4 21 Q1 22
(1) Constant currency assumes average FX rates used in our financial results remain the same over the comparative periods. Normalized for acquisitions and integration costs related to acquisitions
(2) Normalized MRR excludes non-recurring revenues
(3) MRR per Cab excludes Infomart non-IBX tenant income, Packet and xScale JV fee income; Q1 step-down driven by one-off adjustments in prior quarter
© 2022 Equinix.com 5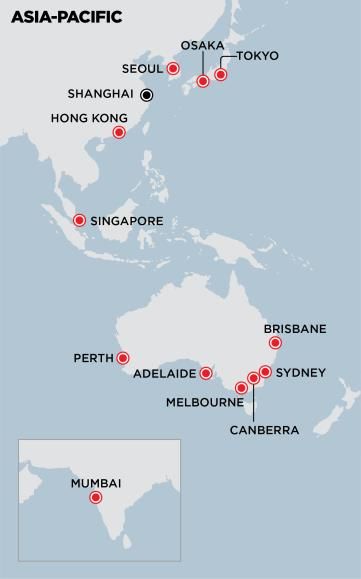
EMEA Performance
Revenues
Revenues Q1 22
($M)
Growth QoQ YoY
$545 $553 $550 (3)
$538
$519 As-reported 1% 6%
Normalized and (1)
1% 9%
Constant Currency
(2)
Normalized MRR 3% 9%
Adjusted EBITDA Q1 22
Q1 21 Q2 21 Q3 21 Q4 21 Q1 22 Growth QoQ YoY
(3)
Adjusted EBITDA As-reported 0% 7%
Adjusted EBITDA Adjusted EBITDA Margin Normalized and (1)
1% 10%
Constant Currency
$268 $260
$263 $260
$244
(4)
48.8% 49.1% Cross-connects Cabs Billing MRR per Cab Utilization
47.0% 46.9% 47.3%
141,200 108,100 $1,603 84%
1% QoQ 1% QoQ Constant Currency
QoQ $37
As-reported QoQ $18
Q1 21 Q2 21 Q3 21 Q4 21 Q1 22
(1) Constant currency assumes average FX rates used in our financial results remain the same over the comparative periods. Normalized for integration costs related to acquisitions and other adjustments
(2) Normalized MRR excludes non-recurring revenues
(3) Impacted by FX headwinds
(4) MRR per Cab excludes xScale JV fee income
© 2022 Equinix.com 6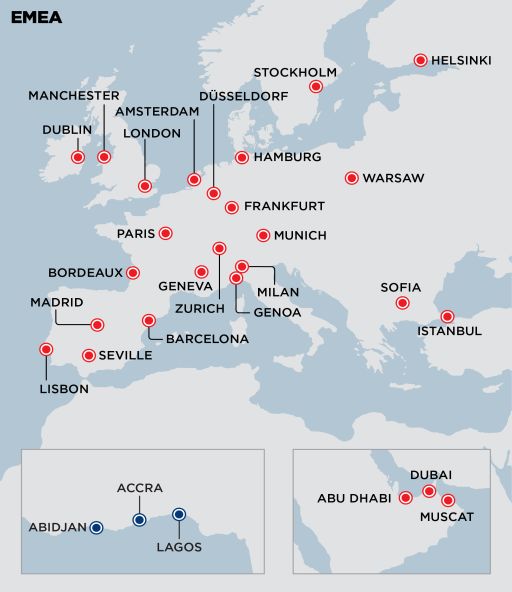
Asia-Pacific Performance
Revenues Revenues Q1 22
($M) Growth QoQ YoY
$369 $371 $384
$351 $367
As-reported 3% 9%
Normalized and (1)
4% 13%
Constant Currency
(2)
Normalized MRR 5% 14%
Adjusted EBITDA Q1 22
Q1 21 Q2 21 Q3 21 Q4 21 Q1 22 Growth QoQ YoY
Adjusted EBITDA As-reported 6% 1%
Adjusted EBITDA Adjusted EBITDA Margin
Normalized and (1)
6% 2%
$209 Constant Currency
$197 $194
$185 $183
(3)
Cross-connects Cabs Billing MRR per Cab Utilization
56.5% 53.7% (4)
52.7% 52.2%
47.7% 75,400 60,400 $2,009 82%
2% QoQ 2% QoQ Constant Currency
QoQ $49
As-reported QoQ $38
Q1 21 Q2 21 Q3 21 Q4 21 Q1 22
(1) Constant currency assumes average FX rates used in our financial results remain the same over the comparative periods. Normalized for integration costs related to acquisitions
(2) Normalized MRR excludes non-recurring revenues
(3) MRR per Cab excludes GPX and xScale JV fee income; MRR per Cab step-up due to mix and power price increase
(4) Q1 margin impacted by inflated power rates in Singapore, as previously guided
© 2022 Equinix.com 7
Capital Structure
(1)(2)
Capital Market Updates Available Liquidity
• On April 5, we issued $1.2B of 3.90% Green Senior Notes due 2032. We used treasury locks to $5.6B
hedge a significant portion of interest rate risk associated with this offering, reducing the effective
coupon to 3.35% Ratings
Baa2 / BBB / BBB
• On April 7, Moody’s upgraded Equinix’s credit ratings to Baa2 (1)
(3)(4) Net Leverage Ratio
($M) Debt Maturity Profile
3.8x
(1)(3)
$1,710
Total Gross Debt
$1,300 £ $1,200
$11.8B
$1,200 $1,200
$1,100 (6)
$1,000 $1,050 $1,000 Green Notes
$ € $ $664 $4.9B
$ $500 $500 $500 (1)(3)(5)
$ Blended Borrowing Rate
€
1.72%
(1)(3)
Weighted Average Maturity
2022 2023 2024 2025 2026 2027 2028 2029 2030 2031 2032 2033 2050 2051 2052
9.0 years
USD Senior Notes Green Senior Notes (1)(3)
Fixed Rate Debt
GBP TLA Green Senior Notes Issued April 5, 2022
(1) Based on balances as of March 31, 2022, excluding the $1.2 billion bond offering completed on April 5, 2022 (4) Excludes mortgage payable and other loans payable
94%
(2) Includes cash, cash equivalents and our $4B undrawn revolver; excludes restricted cash and outstanding (5) Includes the impact of cross-currency swaps, treasury locks and swap locks
balance of letters of credit (6) Includes the $1.2 billion bond offering completed on April 5, 2022; value of EUR Green Notes based on
(3) Excludes finance leases EUR-USD exchange rate at time of issuance in February 2021
© 2022 Equinix.com 8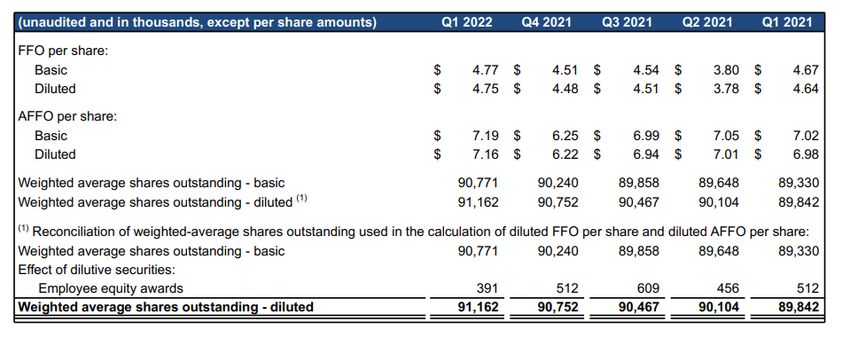
Capital Expenditures
Recurring Capital Expenditures 5.0%
($M)
$86 • Recurring capital expenditures have
8%
2.7% 2.8% 5% historically trended between 2% and 5% of
revenues, annually
$45 $48
17% 13% 1.4% • Maintenance capital expenditures can vary by
1.3% 12% 87%
17%
$24 quarter based on maintenance schedules and
$20
23% 75% 32% payment terms
15% 66% 25%
61% 43%
Q1 21 Q2 21 Q3 21 Q4 21 Q1 22
Installation Sustaining IT & Network Maintenance % of Revenues
Non-recurring Capital Expenditures • Major projects opened in Muscat and
$732 Singapore since last earnings call
$647 $631
32% • ~55% of expansion cabinets are in metros that
$543
28% 23% generate >$100M of annual revenues,
22%
$389 leveraging established ecosystem density and
36% 16%
42%
37% 42% installed customer base
40%
36% 34% 35% 32%
44%
Q1 21 Q2 21 Q3 21 Q4 21 Q1 22
APAC EMEA AMER
© 2022 Equinix.com 9
(1) (2)
Stabilized IBX Growth
Stabilized, Expansion & New IBXs Stabilized IBX Profitability ($M)
Last Quarter
$12,598 $4,843 $3,340 $115
Reported
# of IBXs Q1 22 Revenues ($M) $16,000
$14,000 $13,470 27% annual Cash Gross
9 Expansion: Profit on Gross PP&E
22%
(3) investment (5)
$343 $12,000
57 Growth YoY
Stabilized: $10,000
Stabilized: 2% of
230 87%
Utilized
6%(3)(6)
39% of Investment 69% Cash Gross
Profit Margin Revenues
$8,000
Growth
164 YoY
$6,000 $5,223
$1,327
$3,615
$4,000
$2,000
$116
$-
Investment (Q1 22 Gross (4) Trailing 4-Qtr Trailing 4-Qtr Trailing 4-Qtr Cash
PP&E) Revenues Cash Gross Profit Maintenance Capital
Expenditures
(1) Reference appendix for IBX definitions of Stabilized, Expansion and New
(2) Excludes GPX and Packet acquisitions, Infomart non-IBX tenant income, non-IBX assets and xScale JVs
(3) YoY growth on a constant currency basis assumes average FX rates used in our financial results remain the same over the comparative periods
(4) Includes real estate acquisition costs, finance leases and all capital expenditures associated with stabilized IBXs since opening
(5) Cash generation on gross investment calculated as trailing four quarters as-reported cash gross profit divided by Gross PP&E as of Q1 22
(6) Stabilized total revenues growth YoY is 4% on an as-reported basis
© 2022 Equinix.com 10(1)(8)
2022 Financial Guidance
($M except AFFO per Share) FY 2022 Q2 2022
(2) (3)
Revenues $7,291 - 7,341 $1,809 - 1,829
(4) (5)
Adjusted EBITDA $3,344 - 3,374 $828 - 848
Adjusted EBITDA Margin % ~46% ~46%
Recurring Capital Expenditures $168 - 178 $33 - 43
% of revenues ~2% ~2%
Non-recurring Capital Expenditures (6)
$2,097 - 2,337
(incudes xScale)
(7)
AFFO $2,650 - 2,680
(7)
AFFO per Share (Diluted) $28.93 - 29.26
Expected Cash Dividends ~$1,130
(1) This guidance excludes the announced Entel acquisition which is expected to close in Q2 2022. Guidance includes the expected results of xScale joint ventures we expect to close in 2022
(2) Guidance includes a negative foreign currency impact of approximately $3M compared to Q1 22 FX guidance rates, including the net effect from our hedging transactions
(3) Guidance includes minimal foreign currency impact compared to Q1 22 FX guidance rates and a positive foreign currency benefit of approximately $8M compared to Q1 22 average FX rates, including the net effect from our hedging transactions
(4) Guidance includes a positive foreign currency benefit of approximately $2M compared to Q1 22 FX guidance rates, including the net effect from our hedging transactions and $25M of estimated integration costs related to acquisitions
(5) Guidance includes a positive foreign currency benefit of approximately $1M compared to Q1 22 FX guidance rates and approximately $4M of positive foreign currency benefit compared to Q1 22 average FX rates, including the net effect from our hedging
transactions and $7M of estimated integration costs related to acquisitions
(6) Includes xScale non-recurring capital expenditures guidance of $37 - 87M which we expect will be reimbursed from both current and future xScale JVs
(7) Includes $25M of estimated integration costs related to acquisitions
(8) Guidance excludes any future capital market activities the Company may undertake in the future
© 2022 Equinix.com 11FY22 Guidance (2)
Revenues Adjusted EBITDA
Raise revenues guidance by $89M Raise adjusted EBITDA guidance excluding integration costs by $42M; increase
integration costs by $5M
($M)
Normalized (1) 46.0% As-reported Margin 45.9%
Constant Currency ~10%
YoY Growth
Margin excl. Integration 46.3%
46.2% Costs
$7,291 - 7,341 3,369 - 3,399
25
42 3,344 - 3,374
89
$3,327 - 3,357
$7,202 - 7,252
1 2 3
(2)
Prior Guidance Guidance Adjustment FY22 Guidance Prior Guidance ex. Guidance Adjustment FY22 Guidance ex. Integration Costs FY22 Guidance
Integration Costs Integration Costs
1 Raise revenues guidance 2 Raise adjusted EBITDA guidance 3 Integration cost guidance
Prior Full Year Guidance $7,202 - 7,252M Prior Full Year Guidance $3,327 - 3,357M
Foreign Exchange ($3M) Prior Full Year Guidance ($20M)
Foreign Exchange +$2M
MainOne Acquisition +$50M Guidance Adjustment ($5M)
MainOne Acquisition +$20M Total Integration Costs ($25M)
Guidance Adjustment +$42M Guidance Adjustment +$20M
Current Guidance $7,291 - 7,341M Current Guidance $3,369 - 3,399M
(1) FY21 normalized for the acquisition of GPX and a negative foreign currency impact of approximately $35M
between December 31, 2021 spot rates and FY21 average FX rates. FY22 normalized for the acquisition of
© 2022 Equinix.com
MainOne 12
(2) FY22 adjusted EBITDA normalized for $25M of integration costs related to acquisitionsQ2 22 Guidance
Revenues Adjusted EBITDA
As-reported Margin
46.1% 46.4% 46.5% 46.1%
($M) 2 - 5%
3 - 4% $828 - 848
$1,809 - 1,829 $828 - 848
$0
$1,793 - 1,813 $16
$809
$800 $10
$1,742
$1,734 $8
(1)
(1) (2) (3)
Q1 22 Normalizing Q1 22 Q2 22 MainOne Q2 22 Q1 22 Normalizing Q1 22 Q2 22 Guidance MainOne & Q2 22
Reported Normalized Guidance Guidance Reported Normalized excl. MainOne Integration Guidance
excl. MainOne & Integration Costs
Costs
(1) Q1 22 revenues normalized for a positive foreign currency benefit of approximately $8M between Q2 22 FX guidance rates and Q1 22 average FX rates
(2) Q1 22 adjusted EBITDA normalized for a positive foreign currency benefit of approximately $4M between Q2 22 FX guidance rates and Q1 22 average FX rates and $5M of integration costs
(3) Represents $7M of MainOne adjusted EBITDA and $7M of integration costs related to acquisitions
© 2022 Equinix.com 13(1)
FY22 AFFO and AFFO per Share Guidance
Raise underlying AFFO by $22M and MainOne contribution of $9M; offset incremental debt financing costs of $22M and higher
(2)
integration cost of $5M; Normalized AFFO per share growth of 7 - 8% Share Count (Diluted)
($M except AFFO per Share) (3) AFFO per Share (Diluted)
Normalized AFFO
Constant Currency 8 - 10%
YoY Growth
90.4M 91.6M 91.6M 1 Raise underlying AFFO guidance;
offsetting incremental debt
$27.11 $29.09 - 29.42 $28.93 - 29.26
Prior Full Year Guidance $2,646 - 2,676M
8 - 9%
EBITDA excluding integration costs +$42M
$9
($22) $2,675 - 2,705 Integration costs ($5M)
$2,666 - 2,696 $22 Interest Expense ($29M)
$0 ($25) Recurring Capital Expenditures ($10M)
$2,650 - 2,680
Other +$6M
$2,451 Current Guidance $2,650 - 2,680M
1
2 FY22 Adjusted EBITDA to AFFO Guidance
FY22 Adjusted EBITDA Guidance $3,344 - 3,374M
2 Interest Expense ($352M)
Tax Expense ($160M)
FY21 As- Prior FY22 FX Underlying MainOne(4) Incremental FY22 Integration FY22 Recurring Capital Expenditures ($173M)
reported Guidance ex. AFFO Debt Guidance ex. Costs Guidance Other ($9M)
(5)
Integration Adjustment Financing Integration
Costs Costs Current Guidance $2,650 - 2,680M
(1) AFFO and AFFO per share guidance excludes any future capital market activities
(2) AFFO per Share growth normalized for $25M of integration costs related to acquisitions, foreign exchange impact and other adjustments
(3) AFFO growth normalized for acquisitions, $25M of integration costs related to acquisitions, foreign exchange impact and other adjustments
(4) Includes ~$8M of financing costs
(5) Incremental debt financing primarily related to the Entel acquisition which is expected to close in Q2 2022
© 2022 Equinix.com 14Dividend Outlook
Annual Cash Dividend
($M) ~10%
+10%
~$1,130
$1,030
$936
$826
$727
2022E Cash Dividend of ~$1,130M
• Expected growth of our annual cash dividend
consistent with our strong operating
44% 43% 43% 42% 42%
Payout Payout Payout Payout Payout performance
Ratio Ratio Ratio Ratio Ratio
2018 2019 2020 2021 2022 E (1)
• Second quarter dividend of $3.10 to be paid
on June 15, 2022
Annual Cash Dividend per Share
+8%
+8%
$12.40 • 2022E cash dividend payout of ~$1,130M
$11.48
$10.64 ( 10% YoY) and $12.40 per share ( 8% YoY)
$9.84
$9.12
2018 2019 2020 2021 2022 E
(1) Excludes future financing activity
© 2022 Equinix.com 15Supplemental Financial
and Operating Data
All the Right All the Right All the Right
PLACES PARTNERS POSSIBILITIES
Place Infrastructure Connect to Everything Seize Opportunity with
Wherever You Need It You Need to Succeed Agility, Speed and Confidence
Global Footprint Global Ecosystem Experience
244 data centers across The most dynamic global ecosystem 20+ years of deep expertise
69 metros in 30 countries of 10,000+ companies including designing and implementing
on 6 continents 50%+ of Fortune 500 customer architectures
Resilient Platform Service Providers Self-Service
99.9999% uptime and 2,000+ networks and ~3,000 cloud Digital tools and services to secure, control
5-layer physical security and IT service providers and manage your hybrid environment
Sustainability Leader Interconnection Services Insight
First data center company Award-winning portfolio of physical and We can help customers benchmark
to commit to supply virtual interconnections, including the their progress and accelerate it through
100% clean and worldwide reach of Equinix Fabric™. proven best practices and insights derived
renewable energy In total, 428,000+ connections globally from industry and customer trends
© 2022 Equinix.com 16Equinix Overview
(1)
• Global footprint: 244 data centers in 69 metros
Unique Portfolio of Data • Network dense: 2,000+ networks; 100% of Tier 1 Network Routes
Center Assets • Cloud dense: ~3,000 Cloud & IT service providers
• Interconnected ecosystems: 428,000+ Total Interconnections
• 2022 expected YoY revenues growth of ~10% on a normalized and constant currency basis (2)
Attractive Growth Profile • 77 quarters of sequential revenues growth
• 6% (3) same store recurring revenues growth, 69% cash gross margin (4)
• Industry-leading development yields
Proven Track Record • ~27% yield on gross PP&E invested on stabilized assets
• 10-year total annualized return including dividends as of YE 2021 was ~25%
• Own 126 of 244 Data Centers, 18.0M of 28.2M gross sq. ft.
Long-term Control of Assets • Owned assets generate 60% of recurring revenues (5)
• Average remaining lease term of >18 years including extensions
• Long history of development success through expansions, campuses and known demand pipeline
Development Pipeline • Expect typical new build to be >80% utilized in 2-5 years
• Expect typical new build to be cash flow breakeven within 6-12 months
• Investment grade corporate credit ratings by S&P (BBB), Fitch (BBB) and Moody’s (Baa2)
Balance Sheet Flexibility • Conservative leverage levels with significant access to capital and financial flexibility
• Leverage of 3.8x (net debt to LQA adjusted EBITDA)
• Strong yield (MRR per cabinet) across all regions and expect yields to remain firm
Stable Yield
• Levers on yield: 2 - 5% pricing escalators on existing contracts, interconnection and power density
(1) All stats are as of Q1 22
(2) FY21 normalized for the acquisition of GPX and a negative foreign currency impact of approximately $35M between December 31, 2021 spot rates and FY21 average FX rates. FY22 normalized for the acquisition of MainOne
(3) YoY same store recurring revenues growth on a constant currency basis assumes average FX rates used in our financial results remain the same over the comparative periods
(4) Trailing 4-Qtr cash gross profit
(5) Excludes xScale JVs
© 2022 Equinix.com 17Pressing Our Advantage in All Markets
Equinix global reach expanding across 69 metro areas and 30 countries
6 Continents 30 Countries 69 Metro areas 244 Data centers
AMERICAS EMEA ASIA-PACIFIC
27 Metros 29 Metros 13 Metros % of Customers in Platform Equinix
• Geographic footprint is
104 Data Centers 88 Data Centers 52 Data Centers (1)
Multiple Locations
unmatched and remains
Multi-Metro a unique differentiator
Customers
• Multi-region deployments
89% outpace single-region
Multi-Region deployments
Customers
Expansion strategy
75% • Capture first-mover
In All 3 Regions advantage in future
(2)
global hubs
Approved Expansions
(2)
Approved Expansions Approved Expansions (2) 63%
24 • Use unique market
1
11 11 intelligence for prudent
Opened 2 2
capital allocation
Newly Approved 23 3
Previously Announced 9
6
(1) Derived from Q1 22 recurring revenues
(2) Includes xScale JV‘s
© 2022 Equinix.com 18xScale: Amplifying Our Balance Sheet to Extend Cloud Leadership
Phase Phase
Phase Cost
Recent Activity JV Status
Opening ($M)
Capacity
(MW)
Leasing
(MW)
• Closed our Australian JV with PGIM in Q1 2022,
Mexico City 3x-1 JV Ready Q3 2022 $58 4 0
which is expected to provide more than 55
Americas
megawatts of capacity in the Sydney market when
São Paulo 5x JV Q4 2022 $17 2 2
fully built out
• Closed our South Korean JV with GIC in April 2022, Frankfurt 11x-1 JV Q2 2022 $209 14 14
which is expected to provide more than 45
megawatts to the Seoul market Dublin 5x-1 JV Q3 2022 $247 19 19
Overview
EMEA
Frankfurt 9x-2 JV Q3 2022 $43 8 8
• Equinix owns 20% of the JVs while receiving fees
for managing and operating facilities Madrid 3x-1 (1) JV Q3 2022 $121 7 2
• Our global portfolio expected to be more than $8 London 11x-2 JV Q4 2022 $51 9 9
billion across 36 facilities with more than 720
megawatts of power capacity when fully built out Sydney 9x-1 JV Q2 2022 $172 14 0
APAC
Benefits Osaka 2x JV Q3 2022 $34 5 0
• JV structures enable pursuit of strategic Hyperscale Capacity Under
83 55
deployments to minimize dilution of Equinix returns Development
Total Portfolio
(1)
and limits consumption of balance sheet and
investment capacity Operational
JV Open 94 78
(2)(2)
Data Centers
(1) Equinix will be leasing MD6, a portion of Madrid 3x from the EMEA 2 JV
(2) Operational data centers includes eight unconsolidated xScale JV data centers
Total Portfolio(3) 177 133
(3) Includes all operational xScale facilities and announced projects
© 2022 Equinix.com 19Customer Revenues Mix
Diversified Revenues across Customer, Region and Industry segments
Customers and Churn
Q1 22 Revenues Mix Top 10 Customers (1)
Rank Type of Customer %MRR Region Count IBX Count
1 Cloud & IT 2.6% 3 76
2 Cloud & IT 2.6% 3 76
EMEA 3 Cloud & IT 2.3% 3 56
Enterprise 32% 4 Cloud & IT 1.9% 3 82
34% INT
19% Asia- 5 Network 1.9% 3 135
Network
23% Recurring
Pacific 6 Network 1.9% 3 143
22%
Recurring Revenues Total Revenues 7 Cloud & IT 1.5% 3 45
MIS &
Revenues by Other by Geography 8 Network 1.3% 3 148
CDM
7%
Vertical
Colo
$1,642M 7% 9
10
Cloud & IT
Cloud & IT
1.3%
1.1%
3
3
36
39
74%
Top 10 18.2% 18.6% (2)
Cloud & IT Americas Top 50 38.1% 39.2%
36% 46%
Global New Customer Count & Churn %
Q1 21 Q2 21 Q3 21 Q4 21 Q1 22
Gross New Global Customers (3) 260 270 280 270 270
MRR Churn (4) 2.0% 2.3% 2.1% 2.0% 1.8%
(1) Top Customers as of Q1 22; Excludes GPX and Packet acquisitions
(2) Top Customers as of Q1 21
(3) Gross New Global Customers excludes acquisitions and customers added through the channel and is based on the count of unique global parents
(4) MRR Churn is defined as a reduction in MRR attributed to customer terminations divided by MRR billing at the beginning of the quarter
© 2022 Equinix.com 20Non-Financial Metrics (1)
(2)
(1) Non-financial metrics exclude xScale JVs and GPX and Packet acquisitions
(2) MRR per Cab excludes xScale JVs, Infomart non-IBX tenant income and GPX and Packet acquisitions. MRR per Cab includes Brazil, Colombia, Axtel, Bell Canada assets and Bit-isle MIS beginning in Q4 21
© 2022 Equinix.com 21Equinix Announced Retail IBX Expansions (1)
As of Q1 2022 Cabinet
Equivalent
2022 2023 2024 Total Capex(1) Capacity In Expansion Highlights
IBX Data Center Status Q1 Q2 Q3 Q4 Q1 Q2 Q3 Q4 Q1 Q2 $US millions Ownership Future Phases
MX2 phase 2 (Mexico City) Previously Announced 850 $54 Owned 1,050 • We have 43 major builds underway
TR2 phase 4 (Toronto) Previously Announced 300 $24 Owned -
CL3 phase 2 (Calgary) Previously Announced 550 $38 Owned - across 29 markets in 20 countries
DC21 phase 2 (Washington D.C.) Previously Announced 950 $32 Owned 1,325 including 9 xScale builds
KA1 phase 2 (Kamloops) Previously Announced 250 $22 Owned -
LA4 phase 4 (Los Angeles)
AT1 phases 6 & 7 (Atlanta)
Previously Announced
Newly Approved
350
575
$22
$43
Owned
Leased
-
-
• We had 3 openings in 2 metros –
BG2 phase 1 (Bogotá) Previously Announced 550 $45 Owned 550 Muscat and Singapore
DC16 phase 1 (Washington D.C.) Newly Approved 3,200 $198 Owned 3,200
Americas Sellable IBX Cabinet Adds - 850 300 2,100 - 1,125 3,200 - - - $476 • Estimated FY22 ending cabinet
GN1 phase 1 (Genoa) Open 200 $21 Owned -
MU4 phase 1 (Munich) Open 950 $69 Owned 4,150 equivalent capacity of ~354,000
MC1 phase 2 (Muscat) Open 475 $19 Owned / JV -
IL2 phase 3 (Istanbul) Previously Announced 525 $15 Owned -
LD7 phase 2 (London) Previously Announced 2,275 $111 Owned* -
MD2 phase 4 (Madrid) Previously Announced 375 $16 Leased -
MA5 phase 1 (Manchester) Previously Announced 1,025 $78 Owned 975
PA10 phase 1 (Paris) Previously Announced 1,525 $163 Owned 725
LD8 phase 4 (London) Previously Announced 550 $36 Leased -
ML5 phase 2 (Milan) Previously Announced 500 $20 Owned -
MD6 phase 1 (Madrid) Previously Announced 600 $5 Leased 375
ZH5 phase 4 (Zurich) Previously Announced 250 $42 Owned 700
GV2 phase 3 (Geneva) Previously Announced 300 $22 Leased -
FR5 phase 5 (Frankfurt) Previously Announced 650 $43 Owned 250
PA6 phase 2 (Paris) Previously Announced 275 $16 Leased -
BX1 phase 2 & 3 (Bordeaux) Previously Announced 525 $44 Owned -
DX3 phase 1 (Dubai) Previously Announced 900 $61 Owned* 900
SN1 phase 1 (Salalah) Previously Announced 125 $7 Owned / JV 125
SO2 phase 2 (Sofia) Previously Announced 350 $12 Owned -
BX1 phase 4 (Bordeaux) Previously Announced 275 $21 Owned -
FR13 phase 1 (Frankfurt) Previously Announced 1,125 $104 Owned 550
EMEA Sellable IBX Cabinet Adds 1,625 5,725 1,900 300 925 1,900 275 1,125 $922
SG5 phase 2 (Singapore) Open 775 $67 Owned* -
SG5 phase 3 (Singapore) Open 700 $19 Owned* - Subject to long-term ground lease
TY11 phase 3 (Tokyo) Previously Announced 900 $31 Leased -
*
ME2 phase 2 (Melbourne) Previously Announced 500 $16 Owned 1,500 (1) Sellable cabinet equivalents and capital expenditures are
OS3 phase 2 (Osaka) Previously Announced 400 $19 Leased 1,225 approximate and may change based on final construction details
SG5 phase 4 (Singapore) Previously Announced 600 $26 Owned* 1,400
SY6 phase 2 (Sydney) Newly Approved 500 $43 Owned 1,475
TY11 phase 4 (Tokyo) Newly Approved 675 $55 Leased -
MB3 phase 1 (Mumbai) Newly Approved 1,375 $86 Owned 4,150
Asia-Pacific Sellable IBX Cabinet Adds - 2,375 500 1,000 500 - - 675 - 1,375 $361
Global Sellable IBX Cabinet Adds 1,625 8,950 2,700 3,400 1,425 3,025 3,475 1,800 - 1,375 $1,760
© 2022 Equinix.com 22Real Estate Ownership and Long-Term Leases
(1)
Own 126 of 244 Data Centers, totaling 18.0M of 28.2M total gross square feet
Recurring Revenues by Global Lease Portfolio Expiration Waterfall
(3)
Ownership (2)
% Leases Renewing by Square Footage
Last Possible Expiration Date
67%
Owned Lease
60% >=2037
25%
8% 6%
3% 3% 4%
0% 1% 1% 2% 1% 1% 0% 1% 1% 2%
LeaseSame Store Operating Performance (1)
Revenues ($M) Cash Cost, Gross Profit and PP&E ($M)
Cash Cost Trailing 4-Qtr
Inter- Services/ Total Non- Total of Cash Gross Cash Gross Gross Cash Return on
Category Colocation connection Other Recurring recurring Revenues Revenues Profit Margin % PP&E Gross PP&E %
Q1 2022 Stabilized $956 $255 $63 $1,274 $53 $1,327 $415 $912 69% $13,470 27%
Q1 2021 Stabilized $923 $233 $62 $1,218 $60 $1,278 $362 $917 72% $13,195 27%
Stabilized YoY % 4% 9% 2% 5% -11% 4% 15% -1% -3% 2% 0%
(2)
Stabilized @ CC YoY % 5% 11% 6% 6% -7% 6% 17% 1% -3% 4% 0%
Q1 2022 Expansion $242 $53 $23 $318 $25 $343 $129 $214 62% $6,806 12%
Q1 2021 Expansion $199 $45 $22 $266 $20 $286 $108 $177 62% $6,068 10%
Expansion YoY % 22% 17% 5% 20% 28% 20% 19% 21% 0% 12% 2%
Q1 2022 Total $1,198 $308 $87 $1,592 $78 $1,670 $544 $1,126 67% $20,276 22%
Q1 2021 Total $1,122 $278 $84 $1,484 $79 $1,564 $470 $1,094 70% $19,263 21%
Total YoY % 7% 10% 3% 7% -1% 7% 16% 3% -3% 5% 0%
(1) Excludes GPX and Packet acquisitions, Infomart non-IBX tenant income and xScale JVs
(2) YoY growth on a constant currency basis assumes average FX rates used in our financial results remain the same over comparative periods
© 2022 Equinix.com 24Consolidated Portfolio Operating Performance (1)
Cabinets Billed Q1 22 Revenues ($M)
Total Cabinet Owned % of
Cabinet Cabinets Utilization Total Total
Category # of IBXs Capacity Billed % Recurring Recurring
Americas
Owned (2) 58 97,700 73,700 75% $513
Leased 45 38,400 31,200 81% $217
Americas Total 103 136,100 104,900 77% $729 70%
EMEA
Owned (2) 38 88,600 72,500 82% $335
Leased 41 40,700 35,600 87% $181
EMEA Total 79 129,300 108,100 84% $516 65%
Asia-Pacific
Owned(2) 20 28,300 22,600 80% $106
Leased 28 45,500 37,800 83% $251
Asia-Pacific Total 48 73,800 60,400 82% $357 30%
EQIX Total 230 339,200 273,400 81% $1,602 60%
Other Real Estate
Owned (3) $10
Other Real Estate Total $10 100%
Acquisition Total (4) 2 $5 0%
Combined Total 232 339,200 273,400 81% $1,618 60%
(1) Excludes Packet, non-IBX assets and xScale JVs; Acquisition IBX level financials are based on allocations which will be refined as integration activities continue
(2) Owned assets include those subject to long-term ground leases
(3) Includes Infomart non-IBX tenant income
(4) Includes GPX in IBX count; acquisition cabinet counts are excluded
© 2022 Equinix.com 25Data Center Portfolio Composition
Metro Count Stabilized Expansion New Acquisition xScale Owned Leased
Atlanta 5 AT2, AT3, AT4, AT5 AT1 AT4 AT1, AT2, AT3, AT5 Change Summary (1)
Bogota 1 BG1 BG1
Boston 1 BO2 BO2
Calgary 3 CL1, CL2 CL3 CL3 CL1, CL2
Expansion to Stabilized
Chicago 5 CH1, CH2, CH4, CH7, CH3 CH3, CH7 CH1, CH2, CH4 CH3
Culpeper 4 CU1,CU2, CU3 CU4 CU1, CU2, CU3, CU4 DA6
Dallas 8 DA1, DA2, DA3, DA4, DA6, DA7, DA9 DA11 DA1, DA2, DA3, DA6, DA9, DA11 DA4, DA7 DC14
DC1, DC2, DC3, DC4, DC5, DC6, DC7, DC10, DC1, DC2, DC4, DC5, DC6, DC11, DC12, DC13,
Washington DC/Ashburn 15
DC11, DC12, DC13, DC14, DC97
DC15, DC21
DC14, DC15, DC21
DC3, DC7, DC10, DC97 MO1
Denver 2 DE1 DE2 DE2 DE1 NY5
Houston 1 HO1 HO1 RJ2
Kamloops 1 KA1 KA1
Los Angeles 5 LA1, LA2, LA3 LA4, LA7 LA4, LA7 LA1, LA2, LA3
Mexico City 2 MX1, MX2 MX1, MX2 New to Expansion
Miami 4 MI2, MI3, MI6 MI1 MI1, MI6 MI2, MI3 DA11
Monterrey 1 MO1 MO1 DC15
Montreal 1 MT1 MT1
New York 10 NY1, NY2, NY4, NY5, NY7, NY8, NY9, NY11, NY6 NY2, NY4*, NY5*, NY6*, NY11 NY1, NY7, NY8, NY9, NY13
DC21
NY13
Ottawa 1 OT1 OT1
Philadelphia 1 PH1 PH1
Rio de Janiero 2 RJ1, RJ2 RJ2* RJ1
Sao Paulo 5 SP1, SP2 SP3, SP4 SP5x SP1, SP2, SP3, SP5x SP4
Seattle 3 SE2, SE3 SE4 SE4 SE2, SE3
SV1, SV2, SV3, SV4, SV5, SV6, SV8, SV10,
Silicon Valley 14 SV11 SV1, SV5, SV10, SV11, SV14, SV15, SV16 SV2, SV3, SV4, SV6, SV8, SV13, SV17
SV13, SV14, SV15, SV16, SV17
St. John 1 SJ1 SJ1
Toronto 6 TR1,TR4, TR5 TR2,TR6, TR7 TR2, TR6, TR7 TR1, TR4, TR5
Vancouver 1 VA1 VA1
Winnipeg 1 WI1 WI1
Americas 104 77 25 1 0 1 59 45
Status Change
* Subject to long-term ground lease
(1) Stabilized/Expansion/New IBX categorization are
reset annually in Q1
© 2022 Equinix.com 26Data Center Portfolio Composition
Metro Count Stabilized Expansion New Acquisition xScale Owned Leased
Abidjan 1 Abidjan 1 Abidjan 1
Abu Dhabi
Accra
1
1
AD1
Accra 1 Accra 1
AD1
Change Summary (1) (2)
Amsterdam 9 AM1, AM2, AM3, AM5, AM6, AM8 AM4, AM7, AM11 AM1*, AM2*, AM3*, AM4*, AM5, AM6, AM7* AM8, AM11
Barcelona 1 BA1 BA1 Expansion to Stabilized
Bordeaux 1 BX1 BX1
Dubai 2 DX1, DX2 DX1, DX2
LD4
Dublin 4 DB1, DB2, DB3, DB4 DB3, DB4 DB1, DB2 WA1
Dusseldorf 1 DU1 DU1 SL1
East Netherlands 2 EN1, ZW1 EN1, ZW1
Frankfurt 7 FR2, FR4, FR6, FR7 FR5 FR8 FR9x FR2, FR4, FR5, FR6, FR8, FR9x FR7
Geneva 2 GV1, GV2 GV1,GV2 New to Expansion
Genoa 1 GN1 GN1 MC1
Hamburg 1 HH1 HH1
Helsinki 5 HE3, HE4, HE6 HE5, HE7 HE6, HE7 HE3, HE4, HE5
Istanbul 1 IL2 IL2
Stabilized to Expansion
Lagos 2 Lagos 1, Lagos 2 Lagos 1, Lagos 2 AD1
Lisbon 1 LS1 LS1 LD8
London 10 LD3, LD4, LD5, LD6, LD9 LD7, LD8, LD10 LD11x, LD13x LD4*, LD5*, LD6*, LD7* LD3, LD8, LD9, LD10, LD11x, LD13x
Madrid 2 MD1 MD2 MD1, MD2
SK1
Manchester 4 MA1, MA2, MA3, MA4 MA1, MA2, MA3, MA4
Milan 4 ML2, ML3, ML4 ML5 ML3, ML5 ML2, ML4 MainOne Acquisition
Munich 3 MU1, MU3 MU4 MU4 MU1, MU3 Abidjan 1
Muscat 1 MC1 MC1
Paris 9 PA1, PA2, PA3, PA4, PA5, PA6, PA7 PA8x, PA9x PA2, PA3, PA4, PA8x, PA9x* PA1, PA5, PA6, PA7 Accra 1
Seville 1 SA1 SA1 Lagos 1
Sofia 2 SO1 SO2 SO1, SO2 Lagos 2
Stockholm 3 SK3 SK1, SK2 SK2 SK1, SK3
Warsaw 3 WA1, WA2 WA3 WA3 WA1, WA2
Zurich 3 ZH2 ZH4, ZH5 ZH5 ZH2, ZH4
EMEA 88 52 22 5 4 5 45 43
Adelaide 1 AE1 AE1
Brisbane 1 BR1 BR1
Canberra 1 CA1 CA1*
Hong Kong 5 HK2, HK3, HK5 HK1, HK4 HK1, HK2, HK3, HK4, HK5
Melbourne 4 ME1, ME5 ME2, ME4 ME1, ME2, ME4, ME5
Mumbai 2 MB1, MB2 MB1, MB2
Osaka 4 OS1, OS99 OS3 OS2x OS2x OS1, OS3, OS99
Status Change
Perth 3 PE1, PE2 PE3 PE1, PE2*, PE3*
Subject to long-term ground lease
Seoul 1 SL1 SL1 *
Singapore 5 SG1, SG2, SG3 SG4 SG5 SG3, SG5 SG1, SG2, SG4 (1) Stabilized/Expansion/New IBX categorization are
Shanghai 5 SH1, SH2, SH3, SH5 SH6 SH3 SH1, SH2, SH5, SH6 reset annually in Q1
Sydney 8 SY1, SY2, SY3, SY4, SY7, SY8 SY5, SY6 SY1, SY2, SY4*, SY5, SY6, SY7 SY3, SY8
(2) Acquired MainOne sites on 4/1/2022
Tokyo 12 TY1, TY2, TY3, TY4, TY5, TY6, TY7, TY8, TY9, TY11 TY12x TY10*, TY12x TY1, TY2, TY3, TY4, TY5, TY6, TY7, TY8, TY9,
TY10 TY11
APAC 52 35 10 3 2 2 22 30
Total 244 164 57 9 6 8 126 118
© 2022 Equinix.com 27(1)
Adjusted Corporate NOI ($M, except # of IBXs)
Calculation Of Adjusted Corp NOI Q1 2022 Q4 2021 Q3 2021 Q2 2021 Q1 2021
(1)
# of IBXs 232 232 230 225 224
(2)
Recurring Revenues $1,618 $1,581 $1,545 $1,529 $1,497
Recurring Cash Cost of Revenues Allocation (508) (497) (471) (454) (434)
Cash Net Operating Income 1,110 1,085 1,074 1,074 1,062
Operating Lease Rent Expense Add-back (3) 44 46 46 47 47
Regional Cash SG&A Allocated to Properties (176) (173) (163) (165) (168)
(3)
Adjusted Cash Net Operating Income $978 $957 $957 $956 $941
Adjusted Cash NOI Margin 60.4% 60.5% 61.9% 62.6% 62.9%
Reconciliation of NOI Cost Allocations
Non-Recurring Revenues (NRR) (2) $84 $86 $98 $93 $81
Non-Recurring Cash Cost of Revenues Allocation (54) (54) (67) (64) (46)
Net NRR Operating Income $30 $32 $31 $28 $35
Total Cash Cost of Revenues (2) $562 $551 $538 $518 $480
Non-Recurring Cash Cost of Revenues Allocation (54) (54) (67) (64) (46)
Recurring Cash Cost of Revenues Allocation $508 $497 $471 $454 $434
Regional Cash SG&A Allocated to Stabilized & Expansion Properties $172 $167 $159 $162 $166
Regional Cash SG&A Allocated to New Properties 4 7 4 3 2
Total Regional Cash SG&A 176 173 163 165 168
Corporate Cash SG&A in HQ Functions Not Allocated to Regions NOI (4) 159 158 157 147 141
Total Cash SG&A (5) $335 $332 $319 $312 $309
Corporate HQ SG&A as a % of Total Revenues 9.2% 9.3% 9.3% 8.9% 8.8%
(1) Excludes Packet, non-IBX assets and xScale JVs
(2) Excludes revenues and cash cost of revenues from Packet, non-IBX assets and xScale JVs
(3) Adjusted NOI excludes operating lease expenses
(4) SG&A costs not directly supporting a regional portfolio
(5) Excludes SG&A related to non-IBX assets, xScale JVs and integration costs
© 2022 Equinix.com 28Adjusted NOI Composition – Organic
(1)
Q1 2022 Q1 2022
Total Cabinet Recurring Quarterly
# of Cabinet Cabinets Utilization Revenues Adjusted NOI
Category IBXs Capacity Billed % ($M) ($M) % NOI
Stabilized
Owned (2) 69 142,800 124,200 87% $742 $485 50%
Leased 95 96,000 82,800 86% $532 $313 32%
Stabilized Total 164 238,800 207,000 87% $1,274 $798 82%
Expansion
Owned(2) 39 64,200 41,600 65% $202 $106 11%
Leased 18 27,800 21,600 78% $116 $64 7%
Expansion Total 57 92,000 63,200 69% $318 $170 17%
New
Owned (2) 8 7,600 3,000 39% $10 -$1 0%
Leased 1 800 200 25% $1 $0 0%
New Total 9 8,400 3,200 38% $10 -$1 0%
Other Real Estate
Owned (3) - - - - $10 $7 1%
Other Real Estate Total - - - - $10 $7 1%
Combined
Owned(2) 116 214,600 168,800 79% $964 $598 61%
Leased 114 124,600 104,600 84% $648 $377 39%
Combined Total 230 339,200 273,400 81% $1,613 $974 100%
(1) Excludes GPX and Packet acquisitions, non-IBX assets and xScale JVs
(2) Owned assets include those subject to long-term ground leases
(3) Includes Infomart non-IBX tenant income
© 2022 Equinix.com 29Components of Net Asset Value
Operating Portfolio Q1 22 Quarterly
Ownership Reference
Adjusted NOI Adjusted NOI ($M)
Stabilized Owned Adjusted NOI Segments $485
Stabilized Leased Adjusted NOI Segments $313
Expansion Owned Adjusted NOI Segments $106
Expansion Leased Adjusted NOI Segments $64
Other Real Estate Owned Adjusted NOI Segments $7
Quarterly Adjusted NOI (Stabilized, Expansion & Other Real Estate Only) $976
Other Operating Income
Acquisition Net Operating Income (1) $3
Quarterly Non-Recurring Operating Income $30
Unstabilized Properties
New IBX at Cost $1,033
Development CIP and Land Held for Development $1,079
Other Assets
Cash and Cash Equivalents Balance Sheet $1,695
(2)
Restricted Cash Balance Sheet $12
Accounts Receivable, Net Balance Sheet $780
Assets Held for Sale Balance Sheet $115
(3)
Prepaid Expenses and Other Assets Balance Sheet $1,131
Total Other Assets $3,734
Liabilities
Book Value of Debt (4) Balance Sheet $11,677
Accounts Payable and Accrued Liabilities (5) Balance Sheet $1,048
Dividend and Distribution Payable Balance Sheet $17
(6)
Deferred Tax Liabilities and Other Liabilities Balance Sheet $640
Total Liabilities $13,382
Other Operating Expenses
Annualized Cash Tax Expense $145
Annualized Cash Rent Expense (7) $356
Diluted Shares Outstanding (millions) Estimated 2022 Fully Diluted Shares 92.8
(1) Includes GPX (5) Consists of accounts payable and accrued expenses and accrued property, plant and equipment
(2) Restricted cash is included in other current assets and other assets in the balance sheet (6) Consists of other current liabilities and other noncurrent liabilities, less deferred installation revenue, asset retirement
(3) Consists of other current assets and other noncurrent assets including JV investments, less restricted cash, debt issuance obligations and dividend and distribution payable
costs, and contract costs (7) Includes operating lease rent payments and finance lease principal and interest payments; excludes equipment and office
(4) Excludes finance lease and operating lease liabilities leases
© 2022 Equinix.com 30Shares Forecast (M)
Fully Diluted Weighted Average Shares Common Stock Outstanding
91.0
-0.3 ~91.6
0.5 90.6
~91.4 90.0
89.8
89.6
0.8 1.6 1.7
1.6
1.4 1.4
90.6
Shares Est. Employee Est. Shares Est. Weighted Est. Weighting Est. Fully Diluted Q1 21 Q2 21 Q3 21 Q4 21 Q1 22
Outstanding @ Equity Awards Outstanding Dilutive of All Share Weighted Avg
12/31/21 - Actual @ 12/31/22 Unvested Shares Activities Shares O/S @ Common Stock Outstanding (As-reported)
12/31/22 Unissued Shares Associated with Employee Equity Awards
Forecasted Weighted-Average Weighted-Average
Actual/Forecasted Shares - Fully Diluted Shares - Shares -
Shares (For NAV) Basic Fully Diluted
Shares outstanding at the beginning of the year 90.57 90.57 90.57 90.57
(1)
RSUs vesting 0.66 0.66 0.43 0.43
ESPP purchases(1) 0.15 0.15 0.10 0.10
(2)
Dilutive impact of unvested employee equity awards - 1.43 - 0.51 (3)
0.81 2.24 0.53 1.03
(4) For Diluted
Shares outstanding - Forecast 91.38 92.82 91.10 91.61 AFFO/Share
(1) Represents forecasted shares expected to be issued for employee equity awards
(2) Represents the dilutive impact of employee equity awards that were granted, but unvested as of year end
(3) Represents the dilutive impact of employee equity awards that were granted, but unvested as of year end and any employee equity awards to be issued in 2022. The weighted-average shares are calculated on the same basis as diluted
EPS for U.S. GAAP purposes
(4) Excludes any potential equity financings the Company may undertake in the future
© 2022 Equinix.com 31Capital Expenditures Profile
($M)
© 2022 Equinix.com 32FX Rates, Hedging and Currencies
(4)
Currency % of Revenues
Revenue FX Rates
(2)
Blended (4)
Guidance Blended % of CHF
Currency Hedge Rate Guidance (3) (4) GBP
Rate (1) (2) Hedge % Revenues 1%
Rate EUR
9%
HKD
USD 1.00 40% 19% 3%
AUD
EUR to USD 1.11 1.17 1.15 63% 19% 4%
GBP to USD 1.31 1.33 1.32 69% 9%
JPY
SGD to USD 0.74 8% Other
6%
2%
JPY to USD 0.01 6% SEK 1%
AUD to USD 0.75 4%
8% SGD
HKD to USD 0.13 3%
BRL to USD 0.21 3% 1%
AED
CAD to USD 0.80 3% 3%
BRL
CHF to USD 1.08 1.10 1.09 61% 1% 3%
CAD
SEK to USD 0.11 0.11 0.11 64% 1%
40%
AED to USD 0.27 1%
(5) USD
Other - 2%
(1) Guidance rate as of close of market on 03/31/2022
(2) Hedge rate and blended guidance rate for Q2 22
(3) Blended hedge percent for combined Equinix business for Q2 22
(4) Currency % of revenues based on combined Q1 22 revenues; adjusted AUD, JPY, SGD and other currencies for USD billings
(5) Other includes CNY, BGN, COP, KRW, PLN, MXN, TRY and INR currencies
© 2022 Equinix.com 33(1)
The Three Pillars of ESG
Our Future First sustainability strategy inspires us to dream of a better future.
Environment Social Governance
Do more for each
Do what it takes to Do what’s right to
other to unleash
protect the planet lead the way
potential
▪ First data center to set a ▪ Building a Diverse and ▪ Board ESG Oversight, with three
Science-based Target for Inclusive Culture and Company Recent Board Additions being
Operations and Supply Chain with 9 EECNs, 100/100 HRC Women or Racially Diverse
and Global 2030 Climate- Corporate Equality Index,
Neutral Goal 3.6% YOY increase in Women ▪ Global Ethics and Responsibility,
in Leadership 100% completion of Anti-
▪ 95% Renewable Globally bribery and Corruption Training
against our 100% Renewable ▪ Promoting Health and Wellness
Energy Goal and over 90% and a Culture where All ▪ Enhancing Data Privacy and
every year since 2018 Employees Thrive, drove Data Security with ISO 27001
higher adoption of our EAP and 27002
▪ Leveraging Green Finance to and aligned global benefits
align our investments. Since for a diverse workforce ▪ Public Policy & Advocacy, Leader
2020, issued $4.9B in Green of the EU Climate-Neutral DC
Bonds ▪ Connecting Our Communities Pact
with $2M+ Donations and
Grants and 77% increase in ▪ Promoting Supply Chain
volunteering Sustainability & Diversity,
engaging suppliers on climate
change and ESG
View all sustainability progress at:
sustainability.equinix.com
(1) Equinix CSR Report 2021
© 2022 Equinix.com 34Industry Analyst Reports
Solution Category Reports
• Achieving Business Agility Using Interconnected Hybrid Networks - IDC, 7/21
Interconnection • Datacenter Colocation & Interconnection Services 2021 Vendor Assessment - IDC, 6/21
• Equinix: The Global Digital Platform Facilitator - IDC, 1/21
• The Evolution of IT Infrastructure — Designing for the Unknown - Gartner, 2/22
• Architecting Hybrid IT and Edge in a Distributed, Digital World - 451 Research, 1/22
• Top Strategic Technology Trends for 2022 - Gartner, 10/21
• Driving Toward Digital Infrastructure Platforms - Gartner, 10/21
Digital Infrastructure • Equinix Colocation Solution Scorecard - Gartner, 7/21
• Equinix Analyst Days offers insight into its position in a changing MTDC industry landscape - 451
Research, 7/21
• Business Composability Helps You Thrive Amid Disruption - Gartner, 6/21
• Your Data Center May Not be Dead, but it’s Morphing - Gartner, 9/20
• Accelerate Your Cloud Strategy with a Hybrid Cloud Database - IDC, 7/21
Multi-cloud
• Shift Storage and Data Mgmt Strategy by Embracing Infrastructure-led Innovation - Gartner, 3/21
• Architecting solutions for agility and choice at the edge - ESG, 1/22
• Developing and Deploying Distributed AI: Putting All the Puzzle Pieces Together - IDC, 12/21
Edge Computing
• Predicts 2022: The Distributed Enterprise Drives Computing to the Edge - Gartner, 10/21
• Living on the edge: A primer on hybrid cloud and edge infrastructure - 451 Research, 10/21
Sustainability • Ten tech trends driving transformation in 2022 - 2/22
© 2022 Equinix.com 35Equinix Leadership and Investor Relations
Executive Team
Equinix Investor Relations Contacts Equity Research Analysts
Katrina Rymill Bank of America David Barden
SVP, Corporate Finance and Sustainability Barclays Brendan Lynch
650-598-6583 Berenberg Nate Crossett
krymill@equinix.com BMO Capital Markets Ari Klein
Keith Taylor Citigroup Mike Rollins
Charles Meyers Chip Newcom
Chief Financial Officer Cowen Michael Elias
Chief Executive Officer and Director, Investor Relations
President Credit Suisse Sami Badri
650-598-6262
Deutsche Bank Matthew Niknam
cnewcom@equinix.com
Edward Jones Kyle Sanders
Raouf Abdel - EVP, Global Operations Evercore Irvin Liu
Mike Campbell - Chief Sales Officer Katie Morgan
Goldman Sachs Brett Feldman
Nicole Collins - Chief Transformation Officer Manager, Investor Relations
Green Street Advisors David Guarino
Justin Dustzadeh - Chief Technology Officer 650-250-1740
Jefferies Jonathan Petersen
Jon Lin - EVP & General Manager, Data Center Services kamorgan@equinix.com
Simon Miller - Chief Accounting Officer JP Morgan Phil Cusick
Brandi Galvin Morandi - Chief Legal and Human Resources Officer MoffetNathanson Nick Del Deo
and Corporate Secretary Morgan Stanley Simon Flannery
Eric Schwartz - Chief Strategy and Development Officer New Street Research Jonathan Chaplin
Karl Strohmeyer - Chief Customer and Revenue Officer Equinix Media Contacts Oppenheimer Tim Horan
Milind Wagle - Chief Information Officer David Fonkalsrud Raymond James Frank Louthan
Director, Public Relations RBC Capital Markets Jonathan Atkin
Board of Directors 650-598-6240 Stifel Erik Rasmussen
Peter Van Camp - Executive Chairman, Equinix press@equinix.com TD Securities Jonathan Kelcher
Charles Meyers - Chief Executive Officer and President, Equinix Truist Securities Greg Miller
Nanci Caldwell - Former CMO, PeopleSoft UBS John Hodulik
Adaire Fox-Martin - EMEA Cloud President, Google Cloud Wells Fargo Eric Leubchow
Ron Guerrier - Global Chief Information Officer, HP William Blair James Breen
Gary Hromadko - Private Investor Wolfe Research Andrew Rosivach
Irving Lyons III - Principal, Lyons Asset Management
Christopher Paisley - Dean’s Executive Professor, Leavey School of Business
at Santa Clara University
Sandra Rivera - Executive Vice President and General Manager of Datacenter and
AI, Intel Corporation
© 2022 Equinix.com 36Appendix: Non-GAAP Financial
Reconciliations & Definitions
© 2022 Equinix.com 37Non-GAAP Reconciliations © 2022 Equinix.com 38
Non-GAAP Reconciliations © 2022 Equinix.com 39
Non-GAAP Reconciliations © 2022 Equinix.com 40
Non-GAAP Reconciliations © 2022 Equinix.com 41
Non-GAAP Reconciliations © 2022 Equinix.com 42
Non-GAAP Reconciliations
Consolidated NOI calculation Q1 2022 Q4 2021 Q3 2021 Q2 2021 Q1 2021
(unaudited and in thousands)
Revenues $ 1,734,447 $ 1,706,378 $ 1,675,176 $ 1,657,919 $ 1,596,064
Non-Recurring Revenues (NRR) (1) 83,844 85,766 97,808 92,658 80,899
Other Revenues (2) 32,770 39,287 32,630 36,635 18,537
Recurring Revenues (1) $ 1,617,833 $ 1,581,325 $ 1,544,738 $ 1,528,626 $ 1,496,627
Cost of Revenues $ (915,875) $ (910,435) $ (885,650) $ (865,120) $ (811,217)
Depreciation, Amortization and Accretion Expense 321,729 322,194 311,438 310,916 291,940
Stock-Based Compensation Expense 10,443 10,250 9,713 10,008 8,467
Total Cash Cost of Revenues (1) $ (583,703) $ (577,991) $ (564,499) $ (544,196) $ (510,810)
Non-Recurring Cash Cost of Revenues Allocation (1) (53,721) (53,866) (66,613) (64,192) (45,516)
Other Cash Cost of Revenues (2) (21,964) (27,418) (26,677) (25,735) (30,875)
Recurring Cash Cost of Revenues Allocation $ (508,019) $ (496,706) $ (471,209) $ (454,269) $ (434,420)
Operating Lease Rent Expense Add-back (3) 43,961 45,695 46,123 47,093 46,830
Recurring Cash Cost excluding Operating Lease Rent $ (464,058) $ (451,011) $ (425,086) $ (407,176) $ (387,589)
Selling, General, and Administrative Expenses $ (545,198) $ (533,509) $ (517,622) $ (507,615) $ (484,283)
Depreciation and Amortization Expense 114,657 106,570 108,246 106,842 102,378
Stock-based Compensation Expense 79,509 86,129 84,997 84,327 69,883
Total Cash SG&A $ (351,032) $ (340,810) $ (324,379) $ (316,446) $ (312,022)
(4)
Corporate Cash SG&A in HQ Functions Not Allocated to Regions NOI (159,138) (158,450) (156,628) (146,811) (140,803)
Other Cash SG&A(5) (15,731) (9,157) (5,016) (4,631) (3,387)
Regional Cash SG&A Allocated to Properties $ (176,163) $ (173,203) $ (162,735) $ (165,004) $ (167,832)
(1) Excludes revenues and cash cost of revenues from Packet and non-IBX assets
(2) Includes revenues and cash costs of revenues from Packet, non-IBX assets and xScale JVs
(3) Adjusted NOI excludes operating lease expenses
(4) SG&A costs not directly supporting a regional portfolio
(5) SG&A related to non-IBX assets, xScale JVs and integration costs
© 2022 Equinix.com 43Non-GAAP Reconciliations
(unaudited and in thousands) Q1 2022 Q4 2021 Q3 2021 Q2 2021 Q1 2021
Income from Operations $ 267,316 $ 249,725 $ 282,121 $ 278,654 $ 297,662
Adjustments:
Depreciation, Amortization and Accretion Expense 436,386 428,764 419,684 417,758 394,318
Stock-based Compensation Expense 89,952 96,379 94,710 94,335 78,350
Transaction Costs 4,240 9,405 5,197 6,985 1,182
(Gain) Loss on Asset Sales 1,818 3,304 (15,414) (455) 1,720
Adjusted EBITDA $ 799,712 $ 787,577 $ 786,298 $ 797,277 $ 773,232
Adjustments:
Non-Recurring Revenues (NRR) (1) (83,844) (85,766) (97,808) (92,658) (80,899)
Other Revenues (2) (32,770) (39,287) (32,630) (36,635) (18,537)
Non-Recurring Cash Cost of Revenues Allocation (1) 53,721 53,866 66,613 64,192 45,516
Other Cash Cost of Revenues (2) 21,964 27,418 26,677 25,735 30,875
(3)
Corporate Cash SG&A in HQ Functions Not Allocated to Regions NOI 159,138 158,450 156,628 146,811 140,803
(4)
Other Cash SG&A 15,731 9,157 5,016 4,631 3,387
Operating Lease Rent Expense Add-back (5) 43,961 45,695 46,123 47,093 46,830
Adjusted Cash Net Operating Income $ 977,612 $ 957,111 $ 956,917 $ 956,446 $ 941,206
(1) Excludes revenues and cash cost of revenues from Packet, non-IBX assets and xScale JVs
(2) Includes revenues and cash costs of revenues from Packet, non-IBX assets and xScale JVs
(3) SG&A costs not directly supporting a regional portfolio
(4) SG&A related to non-IBX assets, xScale JVs and integration costs
(5) Adjusted NOI excludes operating lease expenses
© 2022 Equinix.com 44Non-GAAP Reconciliations
NAREIT Funds From Operations (NAREIT FFO)
- We calculate Funds From Operations in accordance with the standards established by the National Association of Real Estate Investment Trusts
(“NAREIT”). NAREIT FFO represents net income (loss), excluding gains (or losses) from disposition of real estate property, impairment charges related to
depreciable real estate fixed assets, plus real estate related depreciation and amortization expense and after adjustments for unconsolidated joint ventures,
and non-controlling interests.
Adjusted Funds from Operations (AFFO)
- We calculate AFFO by adding to or subtracting from NAREIT FFO:
1. Plus: Amortization of deferred financing costs and debt discounts and premiums
2. Plus: Stock-based compensation expense
3. Plus: Non-real estate depreciation, amortization and accretion expenses
4. Less: Recurring capital expenditures
5. Less/Plus: Straight line revenues/rent expense adjustments
6. Less/Plus: Installation revenue adjustment
7. Less/Plus: Contract cost adjustment
8. Less/Plus: Gain/loss on debt extinguishment
9. Plus: Restructuring charges, transaction costs and impairment charges
10. Less/Plus: Income tax expense adjustment
11. Less/Plus: Adjustments from discontinued operations, unconsolidated JVs and non-controlling interests
© 2022 Equinix.com 45Definitions: Non-financial Metrics, IBX growth, REIT and Capital
Expenditures
Non-financial Metrics
MRR per Cab: Monthly recurring revenues per billed cabinet: (current quarter monthly recurring revenues / 3) divided by ((quarter end cabinets billing prior quarter + quarter end cabinets billing current quarter) / 2). xScale JV fee income is excluded. Americas
MRR per Cab excludes Infomart non-IBX tenant income and Packet. APAC MRR per Cab excludes GPX
Virtual connections: The number of private connections between customers over the Equinix Fabric platform
Internet Exchange Provisioned Capacity: The sum of all ports provisioned to customers multiplied by the gigabit bandwidth capacity of each port
IBX Growth
New IBXs: Phase 1 began operating after January 1, 2021
Expansion IBXs: Phase 1 began operating before January 1, 2021, and there is an expected expansion of one or more additional phases leveraging the existing capital infrastructure, or a new phase has opened for a previously stabilized IBX after January
1, 2021
Stabilized IBXs: The final expansion phase began operating before January 1, 2021
Unconsolidated IBXs: Excludes non-IBX assets
REIT Disclosures
Adjusted NOI Composition: Adjusted NOI is calculated by taking recurring revenues, deducting recurring cash costs, adding back operating lease rent expense and deducting cash SG&A allocated to the properties. The impact of operating lease rent
expense is removed to reflect an owned income stream. Total cash rent is provided in the components of NAV. Regional SG&A expense is allocated to the properties to reflect the full sales, marketing and operating costs of owning a portfolio of retail
colocation properties. In addition, Corporate SG&A is provided to show centralized organization costs that are not property-related and, therefore, excluded from adjusted NOI.
Components of NAV: A detailed disclosure of applicable cash flows, assets and liabilities to support a Net Asset Value (NAV). Net asset valuation involves a market-based valuation of assets and liabilities to derive an intrinsic value of equity. Operating
cash flows are separated into real estate income (adjusted NOI), non-recurring income and other operating income in order to facilitate discrete composition valuations. New properties and CIP generating unstabilized cash flows are reflected based on
gross asset value. Other assets and liabilities include only tangible items with realizable economic value. Balance sheet assets and liabilities without tangible economic value (i.e. goodwill) are excluded. Other ongoing expenses including cash rent and
cash tax expenses are disclosed to facilitate a market valuation of those liabilities. Share count is provided on a fully-dilutive basis including equity awards.
Capital Expenditures
Recurring Capital Expenditures: To extend useful life of IBXs or other Equinix assets that are required to support current revenues
Sustaining IT & Network: Capital spending necessary to extend useful life of IT & Network infrastructure assets required to support existing products and business & operations services. This includes hardware & network gear as well as development
enhancements that extend useful life to Equinix portal and other system assets
IBX Maintenance: Capital spending that extends useful life of existing IBX data center infrastructure; required to support existing operations
Re-Configuration Installation: Capital spending to support second generation configuration of customer installations; these expenditures extend useful life of existing assets or add new fixed assets. This includes changes to cage build-outs, cabinets,
power, network gear and security component installations
Non-Recurring Capital Expenditures: Primarily for development and build-out of new IBX capacity (does not include acquisition costs). Also includes discretionary expenditures for expansions, transformations, incremental improvements to the operating
portfolio (e.g. electrical, mechanical and building upgrades), IT systems, network gear or corporate offices which may expand the revenues base and increase efficiency by either adding new assets or extending useful life of existing assets
IBX Expansion: Capital spending to build-out new IBX data centers construction, data center expansion phases or increased capacity enhancements
Transform IT, Network & Offices: Capital spending related to discretionary IT, Network and Office transformation projects that primarily expand revenues or increase margins. This also includes Equinix office space remodeling expenditures that extend
useful life or add new assets
Initial / Custom Installation: Capital spending to support first generation build-out for customer installations; this includes cage configuration, cabinet, power, network gear and security enhancements. This also includes custom installations and flex space
installations which require new assets or extend useful life of assets
© 2022 Equinix.com 46You can also read