Investor Presentation - Healthpeak Properties
←
→
Page content transcription
If your browser does not render page correctly, please read the page content below
Sorrento Gateway (Rendering)
Sorrento Mesa, San Diego

                                 Investor
                               Presentation
                                 Healthpeak Properties

                                        June 2021
Disclaimers
This Healthpeak Properties, Inc. (the “Company”) presentation is solely for your information,       including costs above original estimates, project delays and lower occupancy rates and rents        generally considered stabilized at the earlier of lease-up (typically when the tenant(s)
is subject to change and speaks only as of the date hereof. This presentation is not complete       than expected; changes within the life science industry; high levels of regulation, funding         control(s) the physical use of at least 80% of the space) or 12 months from the acquisition
and is only a summary of the more detailed information included elsewhere, including in our         requirements, expense and uncertainty faced by our life science tenants; the ability of the         date. Newly completed developments are considered stabilized at the earlier of lease-up or
Securities and Exchange Commission (“SEC”) filings. No representation or warranty,                  hospitals on whose campuses our MOBs are located and their affiliated healthcare systems            24 months from the date the property is placed in service.
expressed or implied is made and you should not place undue reliance on the accuracy,               to remain competitive or financially viable; our ability to maintain or expand our hospital and
fairness or completeness of the information presented.                                              health system client relationships; economic and other conditions that negatively affect            The aggregate cash net operating income projections used in calculating the capitalization
                                                                                                    geographic areas from which we recognize a greater percentage of our revenue; uninsured             rates and yield ranges included in this presentation are based on (i) information currently
Forward-Looking Statements                                                                          or underinsured losses, which could result in significant losses and/or performance declines        available to us, including, in connection with acquisitions, information made available to us
Statements contained in this presentation that are not historical facts are "forward-looking        by us or our tenants and operators; our investments in joint ventures and unconsolidated            by the seller in the diligence process, and (ii) certain assumptions applied by us related to
statements" within the meaning of Section 27A of the Securities Act of 1933, as amended,            entities, including our lack of sole decision making authority and our reliance on our partners’    anticipated occupancy, rental rates, property taxes and other expenses over a specified
and Section 21E of the Securities Exchange Act of 1934, as amended. Forward-looking                 financial condition and continued cooperation; our use of contingent rent provisions and/or         period of time in the future based on historical data and the Company’s knowledge of and
statements include, among other things, statements regarding our and our officers’ intent,          rent escalators based on the Consumer Price Index; competition for suitable healthcare              experience with the submarket. Accordingly, the capitalization rates and yield ranges
belief or expectation as identified by the use of words such as “may,” “will,” “project,”           properties to grow our investment portfolio; our ability to make material acquisitions and          included in this presentation are inherently based on inexact projections that may be
“expect,” “believe,” “intend,” “anticipate,” “seek,” “target,” “forecast,” “plan,” “potential,”     successfully integrate them; the potential impact on us and our tenants, operators and              incorrect or imprecise and may change as a result of events or factors currently unknown to
“estimate,” “could,” “would,” “should” and other comparable and derivative terms or the             borrowers from litigation matters, including rising liability and insurance costs; our ability to   the Company. The actual cash capitalization rates for these properties may differ materially
negatives thereof.                                                                                  foreclose on collateral securing our real estate-related loans; laws or regulations prohibiting     and adversely from the estimated stabilized cash capitalization rates and yield ranges
                                                                                                    eviction of our tenants; the failure of our tenants and operators to comply with federal, state     discussed in this presentation based on numerous factors, including any difficulties achieving
Examples of forward-looking statements include, among other things, (i) statements                  and local laws and regulations, including resident health and safety requirements, as well as       assumed occupancy and/or rental rates, development delays, unanticipated expenses not
regarding timing, outcomes and other details relating to current, pending or contemplated           licensure, certification and inspection requirements; required regulatory approvals to transfer     payable by a tenant, increases in the Company’s financing costs, tenant defaults, the results
acquisitions, dispositions, transitions, developments, redevelopments, densifications, joint        our healthcare properties; compliance with the Americans with Disabilities Act and fire,            of final purchase price allocations, as well as the risk factors set forth in the Company’s
venture transactions, capital recycling plans, financing activities, or other transactions; (ii)    safety and other health regulations; the requirements of, or changes to, governmental               Annual Report on Form 10-K for the year ended December 31, 2020 and its subsequent
development, densification and land bank opportunities; (iii) outlooks related to life science,     reimbursement programs such as Medicare or Medicaid; legislation to address federal                 filings with the SEC. As such, we can provide no assurance that the actual cash
medical office and CCRCs; and (iv) potential capital sources and uses. You should not place         government operations and administration decisions affecting the Centers for Medicare and           capitalization rates for these properties will be consistent with the estimated cash
undue reliance on these forward-looking statements. Pending acquisitions and dispositions,          Medicaid Services; our participation in the CARES Act Provider Relief Program and other             capitalization rates and yield ranges set forth in this presentation.
including those that are subject to binding agreements, remain subject to closing conditions        COVID-19 related stimulus and relief programs; volatility or uncertainty in the capital
and may not close within the anticipated timeframes or at all. Forward-looking statements           markets, the availability and cost of capital as impacted by interest rates, changes in our         Market and Industry Data
reflect our current expectations and views about future events and are subject to risks and         credit ratings, the value of our common stock, and other conditions that may adversely              This presentation also includes market and industry data that the Company has obtained
uncertainties that could significantly affect our future financial condition and results of         impact our ability to fund our obligations or consummate transactions, or reduce the earnings       from market research, publicly available information and industry publications. The accuracy
operations. While forward-looking statements reflect our good faith belief and assumptions          from potential transactions; cash available for distribution to stockholders and our ability to     and completeness of such information are not guaranteed. Such data is often based on
we believe to be reasonable based upon current information, we can give no assurance that           make dividend distributions at expected levels; our ability to manage our indebtedness level        industry surveys and preparers’ experience in the industry. Similarly, although Healthpeak
our expectations or forecasts will be attained. Further, we cannot guarantee the accuracy of        and covenants in and changes to the terms of such indebtedness; changes in global,                  believes that the surveys and market research that others have performed are reliable, such
any such forward-looking statement contained in this presentation, and such forward-looking         national and local economic and other conditions; provisions of Maryland law and our charter        surveys and market research are subject to assumptions, estimates and other uncertainties
statements are subject to known and unknown risks and uncertainties that are difficult to           that could prevent a transaction that may otherwise be in the interest of our stockholders;         and Healthpeak has not independently verified this information.
predict. These risks and uncertainties include, but are not limited to: the COVID-19                environmental compliance costs and liabilities associated with our real estate investments;
pandemic and health and safety measures intended to reduce its spread; operational risks            our ability to maintain our qualification as a real estate investment trust (“REIT”); changes to    Non-GAAP Financial Measures
associated with third party management contracts, including the additional regulation and           U.S. federal income tax laws, and potential deferred and contingent tax liabilities from            This presentation contains certain supplemental non-GAAP financial measures. While the
liabilities of our RIDEA lease structures; the ability of our existing and future tenants,          corporate acquisitions; calculating non-REIT tax earnings and profits; ownership limits in our      Company believes that non-GAAP financial measures are helpful in evaluating its operating
operators and borrowers to conduct their respective businesses in a manner sufficient to            charter that restrict ownership in our stock; our reliance on information technology systems        performance, the use of non-GAAP financial measures in this presentation should not be
maintain or increase their revenues and manage their expenses in order to generate                  and the potential impact of system failures, disruptions or breaches; unfavorable litigation        considered in isolation from, or as an alternative for, a measure of financial or operating
sufficient income to make rent and loan payments to us and our ability to recover                   resolution or disputes; and the loss or limited availability of our key personnel. Except as        performance as defined by GAAP. We caution you that there are inherent limitations
investments made, if applicable, in their operations; increased competition, operating costs        required by law, we do not undertake, and hereby disclaim, any obligation to update any             associated with the use of each of these supplemental non-GAAP financial measures as an
and market changes affecting our tenants, operators and borrowers; the financial condition          forward-looking statements, which speak only as of the date on which they are made.                 analytical tool. Additionally, the Company’s computation of non-GAAP financial measures
of our tenants, operators and borrowers, including potential bankruptcies and downturns in                                                                                                              may not be comparable to those reported by other REITs. You can find reconciliations of the
their businesses, and their legal and regulatory proceedings; our concentration of                  Calculations                                                                                        non-GAAP financial measures to the most directly comparable GAAP financial measures in
investments in the healthcare property sector, which makes us more vulnerable to a                  The estimated capitalization rates and yield ranges included in this presentation are               the first quarter 2021 Discussion and Reconciliation of Non-GAAP Financial Measures
downturn in a specific sector than if we invested in multiple industries; our ability to identify   calculated by dividing projected cash net operating income (adjusting for the impact of             available on our website.
replacement tenants and operators and the potential renovation costs and regulatory                 upfront rental concessions) for the applicable properties by the aggregate purchase price or
approvals associated therewith; our property development and redevelopment activity risks,          development cost, as applicable, for such properties. Newly acquired operating assets are

                                                                                                                                                                                                                                                     Investor Presentation - March 2021             2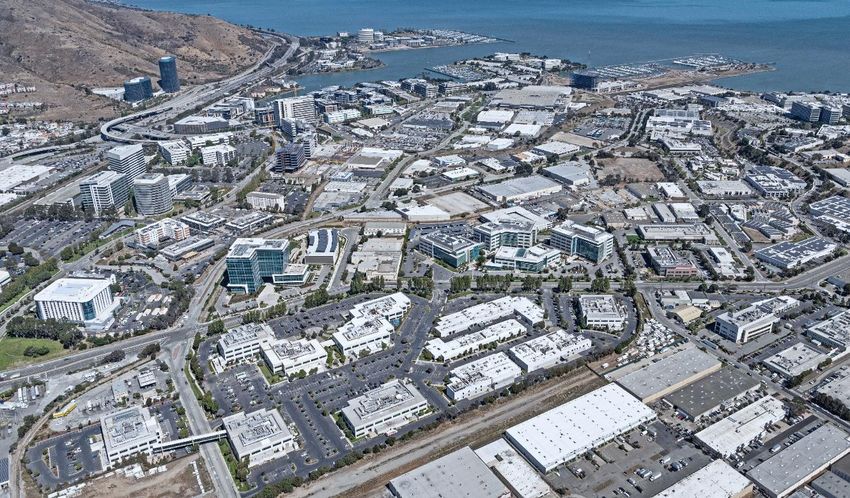
Updates Since May 5th Earnings Call
Callan Ridge Update
$137M densification will double the leasable area, creating a ~185K square foot Class A lab building in the Torrey Pines submarket of San Diego with an
estimated yield on cost of 9.3% based on book value of land and approximately 7% based on market value of land(1)
Recently signed a full-campus, 129-month lease with Turning Point Therapeutics (NASDAQ: TPTX), a leading biotech company focused on
Development development of cancer therapies, bringing the project to 100% leased
Sorrento Gateway Development Commencement
~$120M, 163K square foot Class A lab building with an estimated yield on cost in the low-8% range delivering in early 2023 (see page 4)
Well-located land bank site is adjacent to our existing 3-building Sorrento Gateway campus in the Sorrento Mesa submarket of San Diego
Closed on ~$175M of the remaining $0.4B of identified senior housing sales and loan repayments
Transactions
Closed on the previously announced sale of Hoag purchase option, generating proceeds of $226M; the sale was used to facilitate a 1031 exchange
Completed previously announced tender offers for $550M of bonds maturing in 2025
Debt Tender
Improves weighted average tenor to ~6.5 years
Medical Office & Life Science
Occupancy, retention, renewal spreads, leasing activity and cash receipts remain in-line with or ahead of expectations
CCRC
April Average Daily Census(2) (“ADC”) occupancy was up 40 bps points over the prior month, with Independent Living, Assisted Living and Memory Care
Operations (“IAM”) up 20 bps and SNF up 130 bps
May ADC occupancy was down 10 bps over the prior month, with IAM up 10 bps and SNF down 80 bps; SNF occupancy recovered during the last 2
weeks of May, finishing with a spot occupancy 250 bps above the May ADC occupancy, which will also benefit June ADC occupancy
Year to date the CCRC portfolio has outperformed SHOP, with continued recovery in occupancy for IAM; SNF continues to fluctuate as expected, but the
low-margin business is a small portion of our NOI
(1) See disclaimers on page 2 for a description of how we calculate stabilized yield.
Investor Presentation – June 2021 3
(2) Average Daily Census (ADC) occupancy represents the facilities’ average operating occupancy for the applicable month. The percentages are calculated based on units for senior housing facilities and
available beds for post-acute / skilled facilities.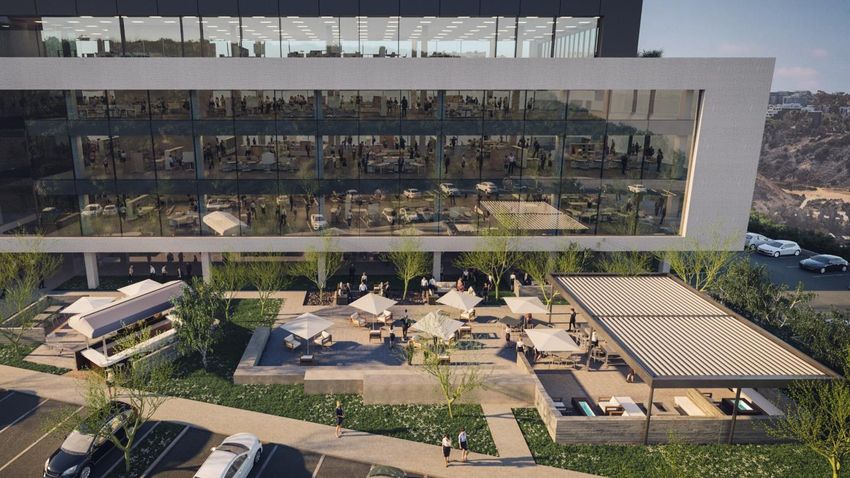
Sorrento Gateway Development Start
    Commencing development at our Directors Place land bank site to capitalize on highly favorable supply and demand dynamics in Sorrento Mesa (San Diego)

    ■ 163K square foot, Class A life science building with an estimated total spend of approximately $120M
    ■ Highly strategic location in the Sorrento Mesa submarket of San Diego adjacent to our existing 100% leased 3-building Sorrento Gateway campus
       □ Creates a largely contiguous 359K square foot campus, further building upon our proven ‘cluster-in-a-cluster’ strategy
    ■ Expected completion in early 2023 with an estimated yield on cost in the low-8% range based on book value of land and high-6% based on market value of land(1)

Sorrento Gateway Rendering                                                                                                                                                    Sorrento Gateway Rendering
Sorrento Mesa, CA                                                                                                                                                             Sorrento Mesa, CA

                                                                                                                                                             Investor Presentation – June 2021    4
                       (1)   See disclaimers on page 2 for a description of how we calculate stabilized yield.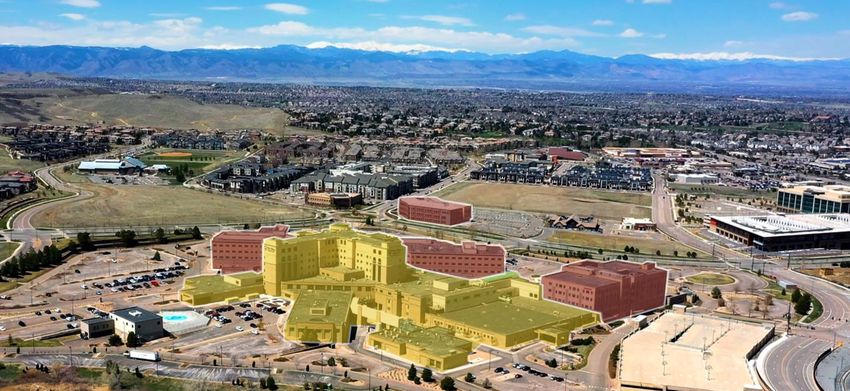
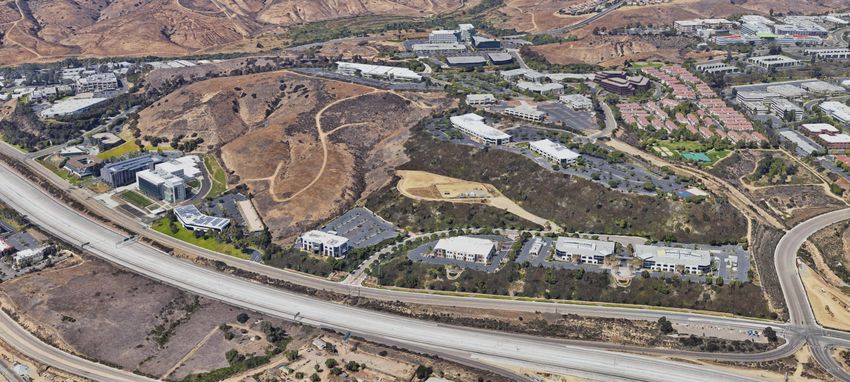
Sorrento Mesa Submarket Overview

                                                                                            1

            2

                                                                                        4

                                                                                                3

Sorrento Highlands   Sorrento Summit   Sorrento Gateway Campus   Sorrento Gateway Development
125,000 Sq Ft        252,000 Sq Ft     196,000 Sq Ft             163,000 Sq Ft

1                    2                 3                         4

                                                                                                    Investor Presentation – June 2021   5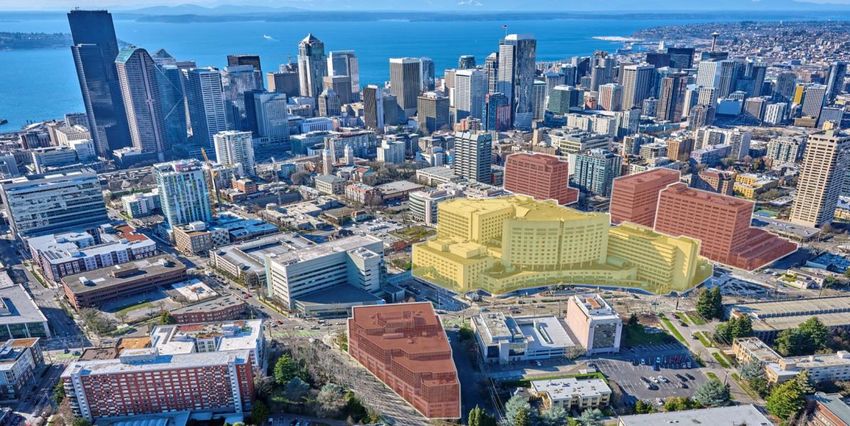
Healthpeak San Diego Market Overview
                                                                                               San Diego Developments

                                                                                               The Boardwalk
                                   5
                                                                                      Poway

                          Callan Ridge
                          Development
                                                                Sorrento Gateway
                                                                  Development

                                                                                               192K Sq Ft | 100% Leased | Est Completion: 4Q 2021

                                                                         Sorrento               Callan Ridge
                 Torrey                                                   Mesa
                 Pines

                                                                   805                          185K Sq Ft | 100% Leased | Est Completion: 4Q 2022

                                       5
                                                                                                Sorrento Gateway

         The Boardwalk
          Development                                                               Downtown
                                             University Towne
                                                  Centre

                                                                                                163K Sq Ft | Est Completion: 1Q 2023

                                           Existing       Development                                              Investor Presentation – June 2021   6
                                           Property           Site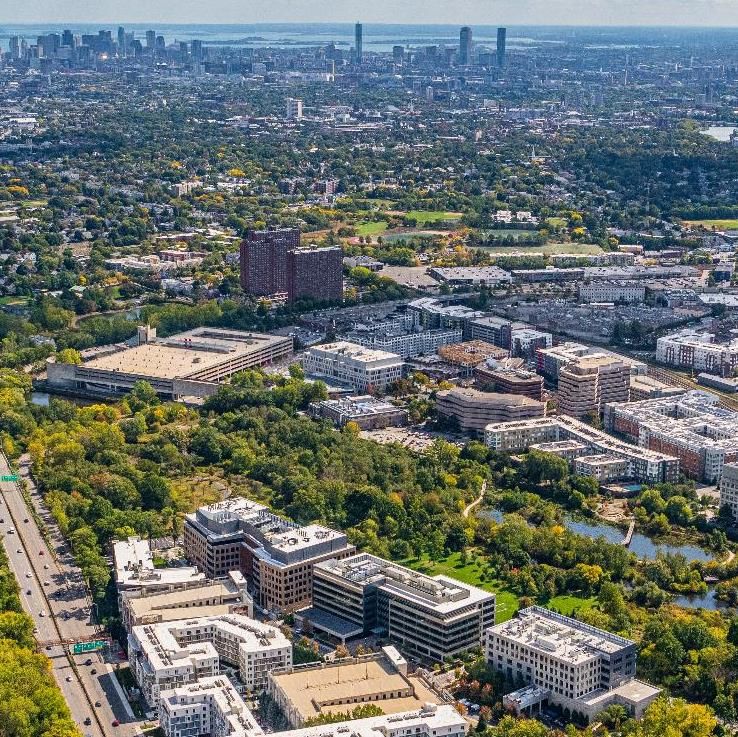
Development
  Platform
Healthpeak Completed Development Projects
The Cove | South San Francisco, CA                                   The Shore Phase I | Brisbane, CA                                            75 Hayden | Lexington, MA                                                      Sorrento Summit | Sorrento Mesa, CA

Cost: $800M | Stabilized Yield: 8.4%(1)                              Cost: $235M | Stabilized Yield: 6.4%(1)                                     Cost: $151M | Stabilized Yield: ~8%(1)                                          Cost: $17M | Stabilized Yield: 8.6%(1)

Grand Stand MOB | Myrtle Beach, SC                                   Brentwood MOB | Brentwood, TN                                               Oak Hill MOB | Tampa, FL                                                       Ogden MOB | Ogden, UT

Cost: $29M | Stabilized Yield: 7-7.5%(2)                            Cost: $38M | Stabilized Yield: 7-7.5%(2)                                     Cost: $12M | Stabilized Yield: 7-7.5%(2)                                       Cost: $20M | Stabilized Yield: 7-7.5%(2)

     Total of 15 completed projects with $1.6B of costs, a blended stabilized yield of 8.0% and value creation of ~$1.1B(3)

                           (1)   See disclaimers on page 2 for a description of how we calculate stabilized yield.
                           (2)   Represents the targeted average stabilized yield across the HCA development program.
                           (3)   Value creation is defined as the undiscounted stabilized Cash NOI divided by current market cap rate less cost of development. Reconciliations, definitions, and important discussions regarding the usefulness   Investor Presentation - June 2021   8
                                 and limitations of the non-GAAP financial measures used in this presentation can be found at http://ir.healthpeak.com/quarterly-results.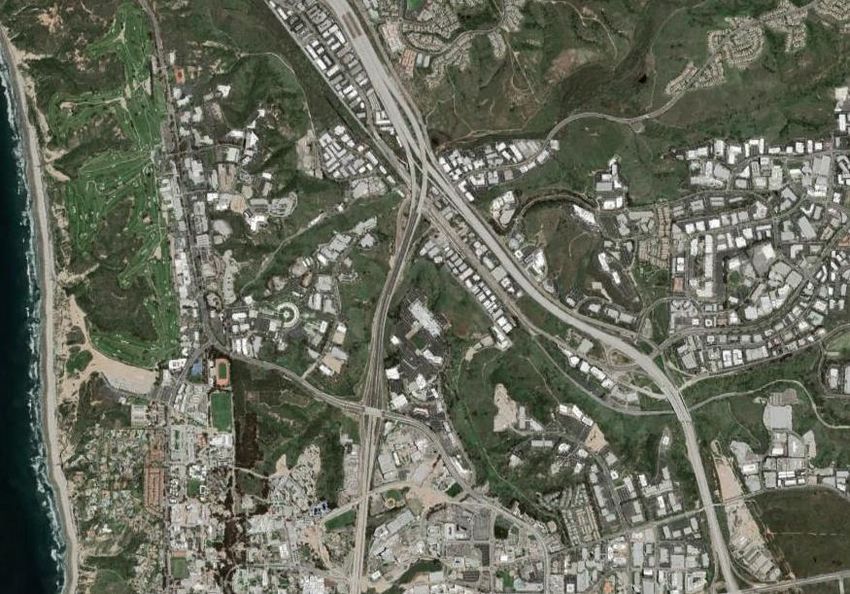
$1.3B Active Development Pipeline(1)
                                                                                          Total Cost               Cost to Date                  Remaining Leasable Area                                      Percent                 Stabilized                  Est. Initial
 Project                                   Market
                                                                                                 ($M)                     ($M)(2)                  Cost ($M)    (000s SF)                                    Leased(2)                    Yield(3)                Occupancy

  The Boardwalk (4)                        Torrey Pines                                             $173                         $109                          $64                          192                    100%                         7.1%                    4Q 2021
  The Shore Phase II                       South San Francisco                                        328                          257                           70                         298                      88%                        5.8%                    4Q 2021
  The Shore Phase III                      South San Francisco                                          94                           57                          37                         109                    100%                         7.5%                    1Q 2022
  101 CambridgePark Dr                     West Cambridge                                             174                            46                        128                          159                           –                     7.5%                    4Q 2022
  Callan Ridge(5)                          Torrey Pines                                               137                            11                        126                          185                    100%                         9.3%                    4Q 2022
  Sorrento Gateway                         Sorrento Mesa                                              120                             9                        111                          163                           –                  low-8%                     1Q 2023
  Nexus on Grand                           South San Francisco                                        159                            21                        138                          141                           –                     6.5%                    2Q 2023
  5 MOB Developments                       Various                                                    122                            40                          82                         419                      49%                7.0 - 7.5%                       Various

  Total / Weighted Average (6)                                                                   $1,306                          $550                        $756                        1,666                        57%                        7.1%

$1.3B active pipeline across 12 projects with a blended ~7% stabilized yield and $0.6B of value creation(7)

                Note: Total Cost minus Cost to Date may not equal Remaining Cost due to rounding.
                (1) Total Cost, Remaining Cost and Estimated Initial Occupancy are based on management’s estimates and are forward-looking.
                (2) Cost to Date represents land value and construction in process balance on 3/31/21. Percent Leased is as of 3/31/21 for all projects except Callan Ridge, which is as of 6/1/21.
                (3) See disclaimers on page 2 for a description of how we calculate stabilized yield.
                (4) The Boardwalk includes the redevelopment of 10275 Science Center Drive. Cost to Date includes land and the net book value of the redeveloped building upon commencement of the project totaling $34 million.
                (5) Design and pre-construction activities on Callan Ridge are in process; property classification will move from operating to development following the expiration of the existing leases in 3Q21.
                (6) Represents total for Total Cost, Cost to Date, Remaining Cost and Leasable Area. Percent Leased and Stabilized Yield are weighted averages by leasable area.                                                         Investor Presentation – June 2021         9
                (7) Value creation is defined as the undiscounted stabilized Cash NOI divided by current market cap rate less cost of development. Reconciliations, definitions, and important discussions regarding the usefulness and limitations of the non-GAAP
                      financial measures used in this presentation can be found at http://ir.healthpeak.com/quarterly-results.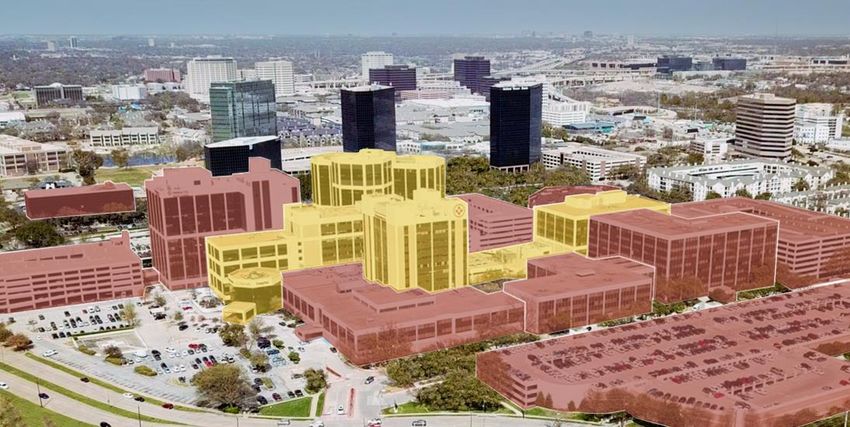
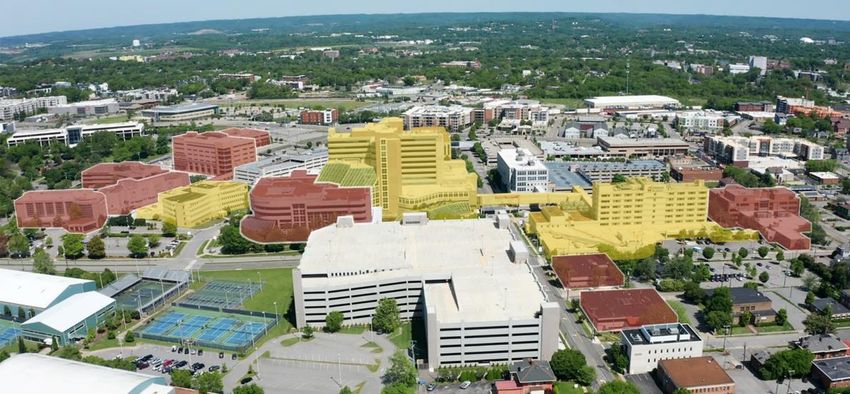
$7B+ of Land Bank and Densification Opportunities
  Healthpeak’s Densification and Land Bank Opportunities(1)
  Our densification opportunities include utilizing excess land on existing campuses, as well as the potential to replace older one- and two-story buildings with taller, Class A buildings as leases roll

    Life Science Densification Opportunities
   • 5M+ square feet of identified potential densification
     opportunities including our land bank
   • Opportunities are in Bay Area, San Diego and Boston

    MOB Densification Opportunities
   • Up to 2M square feet of densification opportunities
     across our MOB portfolio
   • Includes opportunities in Dallas, Las Vegas, Nashville
     and Minneapolis

    CCRC Densification Opportunities
   • $500M+ of opportunities across the portfolio, primarily in
     Florida, DC metro, Houston and Philadelphia

In addition to our land bank, we have the ability to densify existing campuses due to excess land and FAR, providing a decade plus of
development opportunities on core campuses that we can execute based on local supply and demand dynamics at no additional cost for land
                        (1)   Circles represent development and densification opportunities in each market, inclusive of land bank.                                                  Investor Presentation – June 2021   10
Significant Value Creation from Development Platform(1)(2)
($ of NAV per share)
~$6.50/sh of potential value creation
The Shore | Brisbane, CA from active pipeline and land / densification opportunities
~$2.60/sh
Value Creation
~$4.00 ~$8.50
~$1.50
~$1.00
~$2.00
$1.6B of Completed $1.3B of Active Vantage Land Densification Completed Projects
Development(3) Development(4) Opportunities +
Active Projects
+
Vantage Land
+
Densification
Opportunities
(1) Value creation defined as the undiscounted stabilized Cash NOI divided by current market cap rate less cost of development. Reconciliations, definitions, and important discussions regarding the usefulness
and limitations of the non-GAAP financial measures used in this presentation can be found at http://ir.healthpeak.com/quarterly-results.
(2) Value creation assumes mid-point of development and densification returns of approximately 150 to 250 basis points over market cap rates equating to a development margin on total spend (development) and
incremental spend (densification) of approximately 30% to 50%.
(3) Represents estimated market value of $1.6 billion of developments completed from 2016 to 2020 including: The Cove, The Shore Phase I, 75 Hayden, 10 MOB developments and 5 additional life science Investor Presentation – June 2021 11
developments.
(4) Active projects include those listed on page 9.Deeper Dive into South San Francisco and West Cambridge Submarkets
South San Francisco Submarket West Cambridge Submarket
The Shore
Development E
N S
W
35 CPD
Vantage Land
(20 acres) 87 CPD
101 CPD
Development
Nexus on Grand
Development
East Grand Ave.
Future
Densification
Cambridge
Pointe Grand Discovery Park
Future Densification Site
Existing Development Land /
Property Site Densification
Investor Presentation - June 2021 12MOB Historical Performance Analysis:
On-Campus vs Off-CampusHealthpeak’s Premier On-Campus Portfolio
Four select on-campus portfolios representing more than $80M of Cash NOI(1)
Medical City Dallas | Dallas, TX Swedish Hospital System | Seattle, WA
Medical City Dallas | Dallas, TX | 7 properties 2.2M SF Swedish Hospital | Seattle, WA | 4 properties 563K SF
TriStar Centennial Campus | Nashville, TN Sky Ridge | Denver, CO
TriStar Centennial | Nashville, TN | 9 properties 833K SF Sky Ridge | Denver, CO | 4 properties 421K SF
PEAK MOB Hospital
Investor Presentation - June 2021 14
(1) Reconciliations, definitions, and important discussions regarding the usefulness and limitations of the non-GAAP financial measures used in this presentation can be found at http://ir.healthpeak.com/quarterly-results.On-Campus vs Off-Campus Historical Performance
■ A key strategic element of our MOB business is to focus on ownership of on-campus and affiliated assets
□ We have the highest percentage of on-campus assets in the industry at 84%, and our portfolio is 97% affiliated
■ During our 2+ decades in the MOB business, we have found ownership of on-campus assets to be preferable for three major reasons:
□ High barriers to entry; on-campus land is extremely limited and only ~30% of new MOB supply is built on-campus
□ Strong tenancy by the hospital drives patient activity and physician demand in the balance of the building
□ High percentage of specialist physicians leads to “stickier” tenants and higher retention
■ To better quantify how these factors translate into investment returns, we analyzed performance trends across ~300 of our MOBs over a 10 year
time period
□ Our study pool included all MOB assets with comparable year-over-year financials owned during the performance period
□ The underlying number of properties varied by year due to acquisition and disposition activity
■ Our data shows on-campus assets had the highest cash flow growth, tenant retention and lease renewal rent mark-to-market
Investor Presentation - June 2021 15Historical Average Annual Cash NOI less AFFO CapEx Growth(1)
Healthpeak portfolio includes ~300 MOBs(2)
On-Campus Off-Campus: Affiliated Off-Campus: Unaffiliated
+2.3% +1.4% -1.7%
3.0%
2.0%
1.0%
0.0%
-1.0%
-2.0%
(1) Cash flow represented by Cash NOI less recurring capital expenditures. Reconciliations, definitions, and important discussions regarding the usefulness and limitations of the non-GAAP financial measures
used in this presentation can be found at http://ir.healthpeak.com/quarterly-results. Investor Presentation - June 2021 16
(2) Healthpeak portfolio includes approximately 300 MOBs measured from 2010 to 2020. Pool shifts through time as assets were acquired or sold.Historical Average Tenant Retention
Healthpeak portfolio includes ~300 MOBs(1)
On-Campus Off-Campus: Affiliated Off-Campus: Unaffiliated
80.2% 75.2% 68.0%
90.0%
80.0%
70.0%
60.0%
50.0%
Proximity to hospital provides depth of demand for long-term stability
(1) Healthpeak portfolio includes approximately 300 MOBs measured from 2010 to 2020. Pool shifts through time as assets were acquired or sold.
Investor Presentation - June 2021 17Historical Average Renewal Mark-to-Market
Healthpeak portfolio includes ~300 MOBs(1)
On-Campus Off-Campus: Affiliated Off-Campus: Unaffiliated
+2.3% -2.4% -2.1%
3.0%
2.0%
1.0%
0.0%
-1.0%
-2.0%
-3.0%
Consistent on-campus pricing power
(1) Healthpeak portfolio includes approximately 300 MOBs measured from 2010 to 2020. Pool shifts through time as assets were acquired or sold.
Investor Presentation - June 2021 18healthpeak.com
You can also read