Indian Association of Investment Professionals Indian Institute of Management, Bangalore - CFA Institute Research Challenge
←
→
Page content transcription
If your browser does not render page correctly, please read the page content below
CFA Institute Research Challenge
                  Hosted by
Indian Association of Investment Professionals
  Indian Institute of Management, Bangalore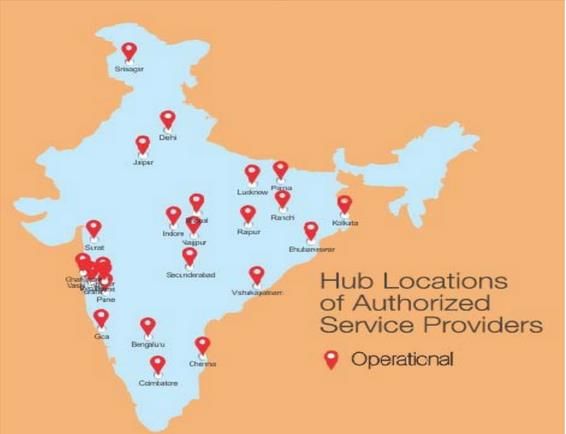
Thyrocare Technologies (Thyrocare) is one of the
                                        leading pan India diagnostic chains. It focusses
                                        more on disorder rather than the disease. The
                                        company currently offers 198 tests and 59
                                        profiles of tests across 4 different segments. As
                                        such, the company has a nation-wide
                                        distribution network of 1041 authorized service
                                        providers across 566 cities and 24 states.

                                        Diagnostics industry in India is expected to grow
                                        at ~14-16% to reach INR 650Bn by FY19.
                                        Wellness and preventive healthcare sub-
                                        segment posits even higher growth rate. Off-
                                        late, Thyrocare has started offering these
                                        wellness tests which is one of the highly
                                        profitable segment.

                                        Investment Thesis: The factors making
                                        Thyrocare stock an investment buy include (1)
                                        cost advantage offering unique differentiation,
Source: Bloomberg, NSE Website
                                        (2) unique nation-wide distribution fueling more
                                        growth, (3) asset-light model enables faster
                                        revenue growth rate, and (4) high growth rate
                                        opportunity in diagnostics and wellness and
                                        preventive care segment, and (5) strong
                                        operating and financial metrics with reasonable
                                        valuation make it an attractive buy.

                                        Valuation: We evaluate Thyrocare using the
                                        intrinsic (DCF with two-stage model) and the
                                        relative valuation (trading multiple approach)
Source: Bloomberg                       methods. The share price is expected to lie
                                        between the INR 555 to INR 888 depending on
                                        the three different scenarios (bear, base and
                                        bull) and the trading multiples. Overall, we give
                                        the buy recommendation with the target price of
                                        INR 702 in the next 12 months.

                                        Risks: can be categorized into business risk and
                                        financial risk. Major risks include (1)
                                        technological disruption, (2) concentration risk,
                                        (3) extensive regulatory compliance, (4)
Source: Team Estimates, Annual Report   vendors/suppliers risk, and (5) INR depreciation.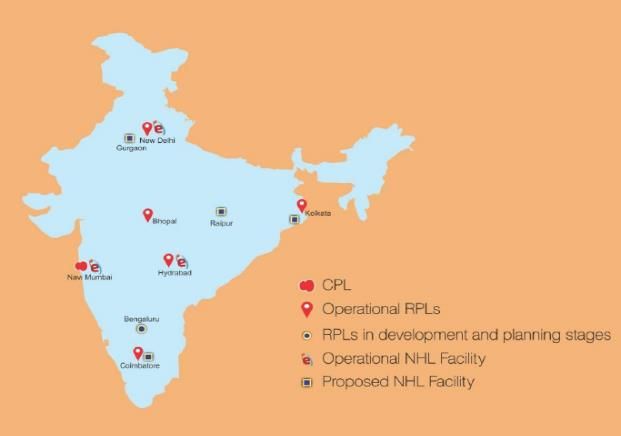
Investment Summary
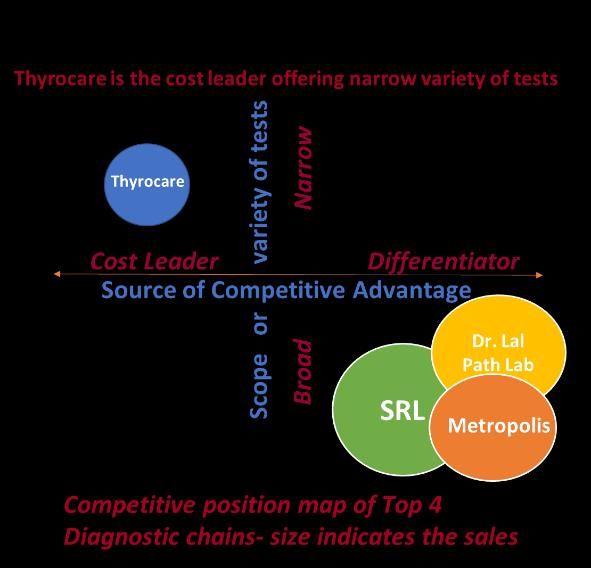
Cost advantage offering unique differentiation: Comparing w.r.t to its main competitor, we estimate
Thyrocare to have significant cost advantage on its major consumables (chemicals, reagents, etc.) to the
tune of ~20% cheaper than that of Dr. Lal Path Lab. Additionally, with the high annual volume turnover of
61.5mn tests (vs. 21.8mn of Dr. Lal Path Lab), we believe this cost efficiency will remain sustainable and
offer superior margins (as reflected in higher EBITDA margins of ~40% vs ~26% for Dr. Lal Path Lab).
Unique nation-wide distribution fueling more growth: With the facility of 6 RPLs and 1 CPL, served by its
network of 1,041 ASPs across 566 cities and 24 states, Thyrocare has created its pan India presence.
Additionally, management intends to add 19 more RPLs and 1 CPL in the next 5 years to establish full-
fledged end-to-end distribution system, thereby making this network difficult to be replicated. This will
not only increase the customer base and thereby the higher sampling volumes, it will also help in creating
the trust for the long-term.
The efficient logistic capabilities and the IT infrastructure (barcoding process), in sync with the followed
hub-and-spoke model, will further increase the customer reach and improve the turnaround time. This
cost efficiency will enable Thyrocare to offer more affordable rates to the customers and hence will
further increase the number of samples and the revenue.
Asset-light model enables faster revenue growth rate: The high tests volume commitment and the strong
supplier relationship enables Thyrocare to pursue the asset-light model i.e. the leasing model for its
expensive equipment (from suppliers like Siemens). This reduces majority of their fixed costs (typical of
diagnostic equipment), align costs more closely with the actual demand and thereby offers higher revenue
growth rate (26% for Thyrocare vs. 20% for Dr. Lal Path). Overall, we believe, this business model will
enable management’s vision of expanding RPL and possibly CPL aggressively without much capital outlay
while keeping key financial metrics (such as ROA) at higher levels.
High growth rate opportunity in diagnostics and wellness and preventive care segment: Owing to the
increasing lifestyle-related diseases, rising urbanization, growing disposable income, and increasing
penetration of healthcare services and insurance packages, diagnostics industry posits a growth rate of
14-16% CAGR for the next 2 years to the market size of INR 650 billion.
A sub-sector, wellness and preventive care segment, presents a significant growth opportunity given it
contributed to ~46% of Thyrocare’s FY16 revenues with just ~20% of the total volumes. Given this segment
is merely 6-8% of the total FY16 diagnostics market, it has the potential to grow at 25-30% CAGR (over
next 3 years) to attain the penetration of 7-9% of the total FY18 diagnostics market especially when the
Wellness and Preventive segment will grow at a
higher rate than the diagnostics industry
INR 512 Bn INR 650 Bn
Source: Thyrocare RHP
Source: Thyrocare RHP
penetration is over 50% in the developed markets.
Increased diversification via developing NHL’s network and expanding service platform: Besides
diagnostics, Thyrocare is increasing the breadth of its services that leverage its network and the
established brand by offering molecular imaging services and establishing Thyrocare Metabolic Clinic
(TMC). Nueclear (NHL) intends to expand its services via the franchisee model and the affordable
competitive pricing. Similarly, a new stream of revenues is envisioned with TMC while providing doctors
and chronic-illness patients a metabolic clinic platform. These new services are likely to augur well for the
company’s growth plan and offer revenue stability/diversification.
Strong operating and financial metrics with reasonable valuation make it an attractive buy: Thyrocare
has achieved income from operations growth of 21.2% CAGR over FY12-16 with significantly high EBITDA
margins of ~40% during this period. Even the net profit has grown at a CAGR of 13.2% during the same
period. From stakeholders’ perspective, Thyrocare has achieved higher asset utilization (ROA of 20%) and
ROE of more than 20% for the last 5 years and more importantly, has the financial leverage for future
growth as it is a debt free company with a cash balance of ~INR 750mn.
Business Description
Established in 1996 by Mr. A Velumani, Thyrocare was initially focused on thyroid testing. The company
later shifted to offer a variety of tests and now it offers 198 tests and 59 profiles of tests. Thyrocare
focusses more on disorder which involve repetitive tests rather than disease which involve one-time tests.
It is one of the leading pan India diagnostic chain and has 4 brands [Exhibit 1]:
Thyrocare - offers diagnostic testing for metabolic disorders and thyroid, which accounts for 70%
volume of samples and 20% of revenue
Aarogyam - offers services catering to wellness & preventive healthcare, contributing ~46% to
company’s revenue. It offers seven test profile covering tests for chronic disorders. [Exhibit 2]
Nueclear, as wholly owned subsidiary Nueclear Healthcare (NHL), provides imaging services for
early and effective cancer monitoring. It has 5 operating PET-CT scanners in 3 imaging centers- 2
in Navi Mumbai, 2 in New Delhi and 1 in Hyderabad.
Whaters - offers services including testing of varied parameters in water.
The company operates on hub and spoke
model with a fully automated CPL (Central
processing lab - bar coding and bi-directional
laboratory information system) located in
Navi-Mumbai which has capacity to process
180mn samples per year. It also has 6 RPLs
(Regional processing lab) located in New
Delhi, Bhopal, Kolkata, Hyderabad,
Coimbatore and Bengaluru [Exhibit 3]. RPLs
primarily offer routine tests conducive to high
Source: Team Research
volume testing while CPL offers entire range
of tests. The strategic locations of RPLs help in
processing specimen from remote location thereby increasing sample volumes.
The samples to be processed are collected by a network of 1041 authorized service providers (ASPs)
spread across 566 cities. These ASPs collect samples from local hospitals, laboratories, doctors and also
from patients procured by direct sales associate or referred to them by doctors. ASPs either deliver
samples directly to one of the RPLs or, if the sample is to be processed at the CPL, to one of 22 hub
locations [Exhibit 3], where samples are aggregated and transported directly to the CPL. The
transportation is mainly done by air cargo. Based on the bar code on the sample, it is automatically
processed for the respective tests at the CPL and the reports are thereby generated automatically and
uploaded on the website or posted to the users as required.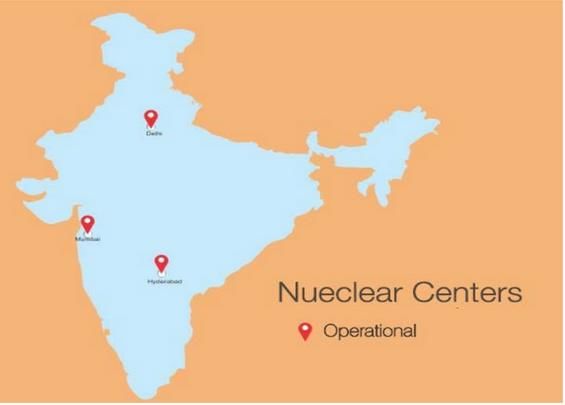
Industry Overview and Competitive Positioning

           The Indian diagnostic industry is valued at INR 512 billion as of 2016-17 with the growth drivers being
           increase in evidence-based treatment, high literacy rates, increasing health awareness and disposable
           incomes rise, expanding health insurance coverage, rising urbanization, changing demographics and the
           increase in life-related diseases [Exhibit 4]. The industry is expected to grow at a CAGR of 14-16% over the
           next two years to over ~ INR 650 billion by FY19.

  Increasing disposable incomes (INR tn) coupled                           Expected increase in death due to chronic diseases
                      with...                                                 will lead to increase in the diagnostics tests
                                                           81                                   32%
                                                      72             29% 29%          29% 29%                                      29%
                                                                                                                         24% 25%
                                             60                              19%
                                       52
                                 45                                                                                 8%
                            37                                                                                5% 6%
                      33
           26    29
21    24
                                                                     Communicable         Other                Cancer    Cardiovascular
                                                                       diseases     Non-communicable                        diseases
                                                                                         diseases

2003 2004 2005 2006 2007 2008 2009 2010 2011 2012 2013                                      2012       2015     2030

                                                           Source: Team Research

           The industry comprises of two parts [Exhibit 5] – Pathology and Imaging. Pathology testing involves
           diagnostics on collected samples (in the form of blood, urine) and imaging/radiology involves procedures
           such as taking X-ray, CT-scan and ultrasound reports. Pathology testing being volume driven commands
           57% market share while Imaging business commands 43%. Biochemistry driven by pathology chronic
           disease like diabetes/sugar, cardiovascular forms a major part of Pathology testing.
           Characteristics of the Diagnostics industry:

                                                                           Highly fragmented and unorganized – The
                                                                           diagnostic market consists of 3 types of players -
                                                                           unorganized standalone centers, unorganized
                                                                           hospital based centers and organized diagnostic
                                                                           chains with relative size as depicted in figure.
                                                                           Out of the diagnostic chains, 35-40% are pan
                                                                           India chains and rest are smaller regional chains.
                                                                           The share of diagnostic chains is expected to
                                                                           increase to 20% by 2018-19 at a robust CAGR of
                                                                           30-32% over the next three years.

                                                                           Lack of comprehensive and stringent regulatory
                                                                           framework- With only 3 to 4 major regulations
                                                                           governing the industry, it is far under-regulated
                                                                           as compared to the pharmaceuticals and
                              Source: Thyrocare RHP

           hospitals industry [Exhibit 6].

           Intensely competitive - Diagnostic chains face stiff competition in two forms - the captive patients catered
           to by hospital-based diagnostic centers and local brand name/commission tie-ups of standalone centers.
           Since the nature of the tests is the same, the key differentiator across major diagnostic players lies with
           strong doctor referral network, expanded customer reach and enhanced service offerings. These offerings
           are in the form of reduced turnaround time by robust logistics network, consistently high quality and
           accuracy of tests produced and automated IT systems facilitating easy availability of reports.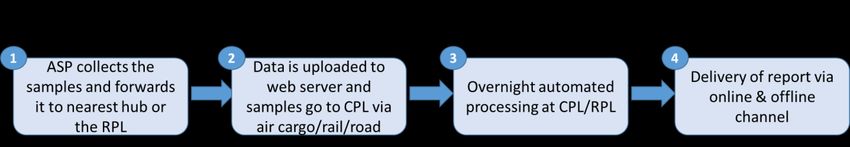
Porter’s five forces analysis – signifying diagnostics industry is extremely competitive
   The five forces        Score                                    Rationale
 Bargaining power       Medium Large chains have higher bargaining power, allowing them to
 of suppliers                         keep their input costs (bulk purchase of reagents) lower than
                                      standalone centers
 Threat of                 Low        Substitutes like point of care testing are too far-fetched in future,
 substitutes                          thus low immediate threat from substitutes
 Bargaining power         High        Extremely fragmented and competitive market leading to higher
 of customers                         price sensitivity among customer
 Threat of new            High        Lack of regulatory framework and lease-based asset light model
 entrants                             make industry more attractive new players
 Industry Rivalry       Medium         Due to undifferentiated offerings but smaller size of fragmented
                                      players, industry rivalry exists among pan India chains
                                             1Source: Team Research

Brand based commission structure - Revenue in this industry is largely dependent on doctor referrals (50-
60%) and walk-ins (30-35%). Standalone centers and smaller regional chains offer much higher
commission margin towards doctor referrals (as high as 30-40%) while the diagnostic chains can afford to
offer lower commissions (15-20%) owing to a strong brand name.
Large proportion of the costs are fixed- About 55-60% of total costs (including lease rentals- 20-25%,
employee- 20-25%, power fuel and maintenance costs- 1-3%) are largely fixed. Consumables (25-30%)
include cost of reagents while selling expenses (4-8%) include the costs of advertisement, publicity and
commission given to the franchise.
Cash rich business- Revenue model works on the concept of advance payment collection resulting in a
significant fund flow, zero debt and cash profit generation.

                                                  Amongst these characteristics, Thyrocare stands out
                                                  amongst its competitors as follows:

                                                  Cost leader- Thyrocare as a unique organization, serves its
                                                  clients at the lowest rates in the industry. Thyrocare’ s B2B
                                                  focus coupled with a central laboratory for regional labs and
                                                  price disruption helped Thyrocare in getting high volumes.
                                                  High volumes coupled with automated large scale labs make
                                                  the company a cost leader.
                                                  Unique business model & CPL focused operations – CPL
                                                  processes 0.2mn tests a day-highest by any lab in India and
                                                  hence bring in operational efficiencies. Complete
                                                  automated process leads to faster turnaround time of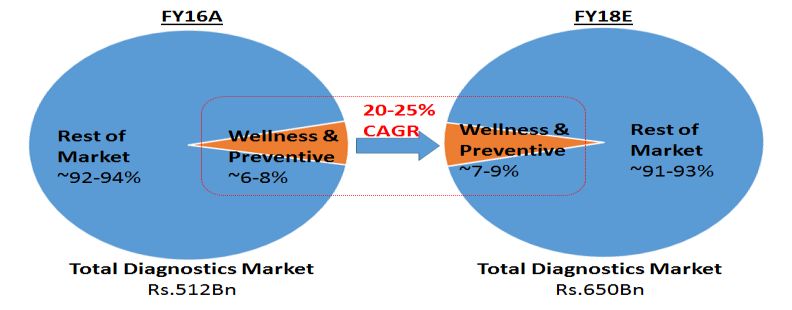
Omni Chanel presence - Online client system, branded Thyroid metabolic clinic- Company has
introduced online client system where persons or organizations with ability to collect samples can
outsource the testing to Thyrocare. Further, company is planning to introduce Thyroid metabolic clinic
(TMC) which will be a nation-wide chain of branded metabolic clinics for individuals with chronic illness
or who plan to undergo healthcare procedure. These clinics will provide platform for doctors to deliver
their expertise to potential patients.

Well-knit network driving volumes which can’t be easily replicated- The only moat which can’t be
replicated is volume of samples. Pan India deep network of ASPs with large scale labs is a model which
drives volumes. Further, Thyrocare’ s RPL strategy is in right direction which will help in cutting logistics
costs and thus help keeping up with pricing pressure in future. This will lead to sustained revenue growth
though margins may be sacrificed in future.

Asset Light Model - Due to the leasing of equipment and analyzers from vendors, the company follows an
asset light model. As a result of this, the company does not have any long and short-term borrowings. The
company generates enough cash for funding its expansion plans in the near future. This leaves a lot of
room for Thyrocare to leverage its balance sheet for future expansion.

Valuation
The valuation has been evaluated using a combination of intrinsic and relative valuation methods namely
– DCF with a two stage model, and the trading multiple approach of comparable companies. We also
looked for the past transaction multiples, but with hardly one deal in the recent past, that valuation
method is not reliable. To get a better visibility, we have analyzed 3 different scenarios in the DCF model
– downside case, base case and the management case. Shown below are the share prices varying from
INR 555 to INR 888 as calculated using the different methodologies. But overall, we believe the base case
is more likely and hence the stock price of INR 702 is our recommendable target for the next 12 months.

        FY17 P/E                        695                  772

 FY17 EV/EBITDA                                        801                888

             DCF     555                                                  866

                       Source: Team Estimates, Bloomberg, Company Reports, Broker Research

Discounted Cash Flow (DCF) Method: In order to assess the different market conditions, we developed
the detailed financial model and simulated 3 different scenarios namely – downside, base and
management cases. These 3 scenarios differ in the growth rates [Exhibit 7] in the two-stage discounted
cash flow model with management case as the most bullish and the downside case as the bearish. With
the below mentioned assumptions, we get the following target stock price: INR 555 (downside case), INR
702 (base case) and INR 866 (management case). For detailed valuation model, please refer [Exhibit 9].
However, we believe base case of INR 702 is the most likely achievable target in the next 12 months.

Assumptions
Revenue Growth Rate: Since the firm witnessed a high revenue growth rate of 32% in FY16, a two stage
model wherein this rate is expected to fall down marginally is justified. In this model, for the first five
years (FY17-FY21), Thyrocare is expected to experience high growth stage, growing at a rate of 27% YoY
followed by the second stage of medium growth phase with 24% revenue growth during FY22-FY26. Post
the horizon period, Thyrocare is assumed to grow at a perpetual growth rate of 5%.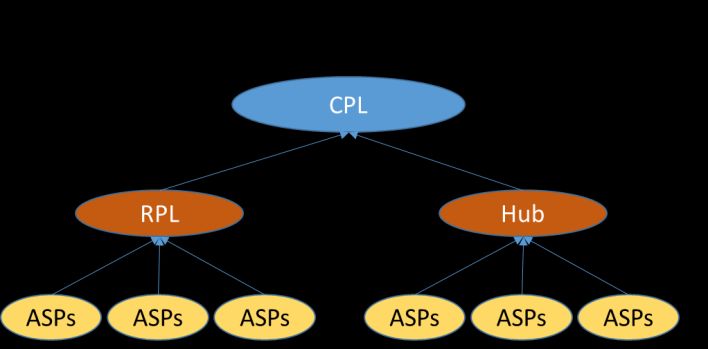
The revenue for the imaging business and the other businesses are estimated separately as they have a
                different growth profile compared to the diagnostics segment. And this growth rate is assumed to be
                different in different scenarios. For the imaging business, the revenue is estimated to grow at 30% YoY in
                our base case scenario.

                EBITDA Margin: For the diagnostics business, it is assumed to decline slowly as the competition kicks in,
                leading to decrease in prices for the various tests. At the same time, EBITDA margins for the imaging
                business is expected to improve with better utilization of the existing machines. Overall, the firm wide
                EBITDA margin is at 40% and is assumed to stabilize at 37% by the end of 10-year horizon period.

                Fixed Assets: The assets are estimated assuming that the fixed asset turnover ratio will be stable as the
                firm would require to increase the asset base at a similar pace as the revenue is growing. At the same
                time, we have used the management’s capital expenditure estimates for the next 5 years. They expect to
                operate around 25 RPLs by end of 2020, along with imaging centers deploying 5 PET-CT scan machines
                and 1 cyclotron. Since the company is expected to operate on a franchisee model for the PET-CT scan
                machines, we assume a lesser capital cost and consequently lower revenue due to the revenue sharing
                model with the franchisees. For the next 5 years, we have assumed creation of 3 RPLs every year at a per
                unit cost of INR35mn, an INR300mn investment in FY19 for establishing a CPL in Delhi, INR60mn each for
                PET-CT scan in FY18, FY20 and FY22.
                Cost of Equity: With limited trading history of Thyrocare stock, we have assumed the beta of 1. As such,
                its peer, Dr. Lal Path Lab trades at a beta of 0.55. Overall, we estimate the cost of equity for the company
                to be 13%.

                Sensitivity Analysis- To understand more about the stock price variance, we have performed the
                sensitivity analysis by varying the terminal growth rate (from 4% to 5%) and the WACC (from 12% to 14%).
                The detailed results can be seen below:

Downside Case:                                        Base Case:                                              Management Case:
Stock Price (INR)                                     Stock Price (INR)                                       Stock Price (INR)
                        Terminal Growth Rate                                 Terminal Growth Rate                                    Terminal Growth Rate
       28,587    4.0%     4.5% 5.0% 5.5%       6.0%          36,166   4.0%     4.5% 5.0% 5.5%       6.0%             44,629   4.0%     4.5% 5.0% 5.5% 6.0%
       12.0%      594      621    652    688    730          12.0%     753      789    830    876    931             12.0%     931      976 1,028 1,087 1,157
       12.5%      551      574    600    630    664          12.5%     697      727    761    800    846             12.5%     859      898    941    991 1,049
                                                                                                              WACC
WACC

                                                      WACC

       13.0%      513      533    555    580    608          13.0%     647      673    702    735    773             13.0%     797      830    866    908   956
       13.5%      480      497    515    536    560          13.5%     603      626    650    678    710             13.5%     741      769    801    836   877
       14.0%      450      464    480    498    519          14.0%     564      583    605    628    655             14.0%     692      716    743    773   807

                Comparable Company Analysis - In the organized diagnostics space in India, there are hardly few major
                players namely - Dr. Lal Path Lab, SRL Diagnostics, Metropolis Healthcare, Thyrocare Technologies.
                However, only Dr. Lal Path Lab is the other listed entity besides the recent listing of Thyrocare. For
                comparison, we have shown below the key financial and operating metrics comparing Thyrocare with Dr.
                Lal Path Lab.

                                                                                                                                         2017E
                                    Mcap       Revenue          Revenue        EBITDA                       Net         Net D/        EV/
                  Company                                                                    ROE                                               P/E
                                  (INR mn)     (INR mn)         Growth         Margin                       D/E         EBITDA       EBITDA
                 Thyrocare          34,015       2,312           26.4%          39.3%       16.0%          (0.3x)        (1.2x)       28.7x   48.3x
                 Dr Lal Path        98,787       7,913           20.0%          26.5%       31.2%          (0.6x)        (1.4x)       37.7x   61.0x
                Source: Bloomberg, Company Reports, Broker Research

                Based on the 2017 EV/EBITDA and P/E trading multiple of Dr. Lal Path Lab, Thyrocare technologies can be
                valued at share price of INR 865 and INR 754 respectively. Despite giving a market discount of 10%, share
                price comes out to be INR 781 and INR 678 by the comparable EV/EBITDA and P/E multiples respectively.
Financial Analysis
Revenue - Thyrocare witnessed a healthy growth of 31.7% in revenue with INR 2409.65 million in FY 16
as compared to INR 1829.58 million in FY 15. The increase in the revenue is mainly on account of the
increased focus on preventive care offerings, increase in turnaround time due to setting up of more
regional processing laboratories and also increase in the number of CT scans conducted by the imaging
business. The growth in the industry is mainly volume growth as Thyrocare conducted 61.5mn
investigations and 11.5mn tests in FY 16. A snapshot of the financial performance on a standalone basis
is shown in the table below
Financial Performance
2,500 45% 47% 46% 2,351 50%
42% 41%
2,000 1,801 40% 40%
32% 31%
1,500 1,343 1,500 27% 30%
1,091 25%
1,000 946 20%
636 690 735
491 566 588
458 487
500 350 10%
0 0%
FY 12 FY 13 FY 14 FY 15 FY 16
Revenue from ops (INR mn) EBITDA (INR mn) PAT (INR mn)
EBITDA Margin (%) PAT Margin (%)
Source: Company Annual Report
Consistent margins of > 40% EBITDA, >25% PAT for the last 5 years. This growth was volume driven as is
evident from the 20.6% CAGR growth in samples processed from FY 12 to FY 16.
EXPENSES (% OF REVENUE) Expense Analysis
1. Cost of materials consumed – This has shown
mostly a stable trend as percentage of revenue, except
21% 22% in FY 15 where the rupee depreciation increased the cost
22% 20% 18%
10% to a greater extent.
7% 7% 8% 11%
2. Employee benefit Expense – This has increased
27% 27% 28% 31% 27% in FY 16 primarily due to introduction of employee stock
options and increase in the number of employees
FY 12 FY 13 FY 14 FY 15 FY 16
Cost of material Employee benefit expense Other expense 3. Other Expense – This has increased more in
recent years due to the increasing service charges to the
authorized service providers.
Lesser Capital Costs- The business model of Thyrocare involves leasing of diagnostic equipment and
instrument from vendors like Siemens, Trans Asia Bio Medicals Limited with a contractual agreement to
purchase reagents and consumables from them for periods ranging from 2 to 6 years. While this reduces
the capital costs associated with the equipment but at the same time it increases the liability for Thyrocare
as it has to purchase reagents from the same vendors as per the contract.
Employee Costs-Thyrocare has state-of-the-art automation system, consisting of an IT system comprising
of bar coding and bi directional laboratory Information System. Due to this, the operations require
minimal human intervention. Hence, the employee costs as % of total income for Thyrocare is 10% as
compared to 17.4% for its competitor Dr. Lal Path labs.Segment wise Revenue Breakup
DIAGNOSTIC-SEGMENT WISE
REVENUES Thyrocare recognizes its diagnostics testing
services and imaging services as the primary
business segments. The company focusses on
59% 53% 49% 54% wellness and preventive health care offering
through its brand Aarogyam. The distribution
41% 47% 51% 46% of revenue amongst Aarogyam and others is as
shown in adjacent figure
FY 13 FY 14 FY 15 FY 16
Test Profile based revenue and volume
Wellness & preventive healthcare Others breakup-From the adjacent figure, we can see
SEGMENT WISE - VOLUME, VALUE,
that the Aarogyam brand is of increasing value
MARGINS
for Thyrocare as it generates the maximum
20% 30% 20% revenue with minimum number of processed
20% tests.
20% Dividend policy
70%
The Company has decided on dividend policy
50% 60%
based on the standalone financials. 2 interim
10% dividends totaling to INR 7.5 per equity share
and another dividend of INR 2.5 totaling to INR
VOLUME VALUE MARGIN 10 per equity share.
Wellness & Preventive Thyroid Others
Du Pont Analysis (FY 16)-The only place
Thyrocare lags is the Asset turnover ratio. This implies that Thyrocare is not able to utilize its assets to
the same potential as its peers. Here, we also have to consider the impact of newly started RPLs in Bhopal
and Hyderabad. Though the assets i.e. RPLs and the Imaging centers have been set up, but they weren’t
yet operating at their full potential capacity.
Balance Sheet-The balance sheet size for Thyrocare grew
Du pont Comparison - Thyrocare
vs Dr. Lal from INR 3292.18 million to INR 4096.74 million at 24.44%.
127% The diagnostic testing services accounted for 66% of total
89%
81%
allocable assets and imaging accounted for 33.3%.
60% However, the revenue contributions from the two
25% 17% segments were 88.9% and 6.4% respectively. Thus, we see
13% 17%
that the imaging business contributes very less to the top
Net Asset Financial RoE line of the company as compared to the contribution in
profit turnover leverage total assets. While this is partly due to lesser number of CT
Margin
Thyrocare Dr Lal scans (60 scans per day) on account of lesser awareness and
availability of PET-CT scans in the country.
Peer Comparison -We consider SRL, Metropolis Healthcare and Dr Lal as the major competitors for
Thyrocare and accordingly compare them on key financial parameters (FY 16 only) [Exhibit 8]
Investment Risks
Business Risks/ Strategic Risks
Technological Disruption and Point of care testing (POCT)- POCT involves an instrument which
can do testing at home and will bring diagnostic lab at counter. There are instances like Delhi
Government using such instrument to deliver diagnostic services. Once this technology becomes
cost effective and provide a much variety of tests with single instrument it can significantly affect
the diagnostic industry. Further technologies like Digital pathology, whole-slide testing, molecular
diagnostics, wearable bio-sensors, mobile health solutions may pose a threat. Concentration risk- Thyrocare model is different from other players. Main competitor chains
have 100-200 labs spread across India but Thyrocare has a large dependence on CPL and the 6
RPLs. CPL performs all the tests offered while RPLs do tests that are more routine in nature and
conducive to high volume testing. Any disruption in transportation of samples to CPL /RPL or any
disruption in the CPL/RPL itself will lead to significant loss of business. Further, limited number of
test profiles offered lead to risk of losing out to a business segment that may grow abruptly in
future.
Extensive regulatory compliance- Diagnostic business is not subjected to much regulations but a
stricter regulatory environment in future dealing with handling of medical specimens, human
health and safety laws may pose a significant operational risks. Further, Nueclear business is
exposed to much more regulations than the diagnostics.
High dependence of ASPs- The pan India network of 1041 authorized service providers give ability
to grow customer base, enhance brand recognition and execution of business model. Heavy
dependence on these franchise based ASPs which are not in the direct control is a significant risk.
Further these ASPs can easily switch to other chains as they are allowed to give samples to other
chains also. The 687 TAGs (Thyrocare aggregators) and 354 TSPs (Thyrocare service providers)
form the crucial link between the company and the customers and hence extensive reliance on
them rather than having company owned network is a risk.
Vendor/ Supplier’s risk- The testing equipment like analyzers are acquired from vendors at
extremely low or no costs but with a contractual commitment to purchase a minimum amount of
reagents or consumables for a specified period. The ownership of equipment lies with the vendors
and may pass on to company only after the contractual period at a pre-decided price. This would
mean the if company doesn’t purchase the equipment as per the price set by the arrangement,
the vendor (Siemens, TransAsia, Roche) may withdraw and retake the possession of the
equipment.
Competition risk- Being a highly competitive and fragmented industry the only moat that
Thyrocare have is its pricing and volumes. There is a risk of a competitor drastically reducing its
pricing and cannibalizing the Thyrocare sales. Further any impairment in the ability to conduct any
test will dampen the operations and sales.
Financial risks/Macro Risk
INR depreciation- The purchase of raw material is linked to US Dollar. Hence any depreciation in
INR/USD will adversely Impact the cost of materials or reagents.
Non-sustainability of high margins- Because of huge competition risk, the company will face this
risk unless it spends on marketing costs.
Corporate Governance
Thyrocare Dr. Lal
Path Labs
Independence of the Board of Directors 50% 55%
Independent Committees Available Available
Transparency and Accountability Available Available
Vigilance Policy Available Available
Compensation Structure Available Available
Results communication: Half yearly NA NA
Quarterly reports Available Available
Annual report Available Available
Source: Company Annual Reports
The company has 5 committees – Audit, corporate social responsibility (CSR), nomination and
remuneration, stakeholder relationship and risk management – all headed by independent directors. In
the recent financial year, the company did not spend the required amount on CSR due to pending
identification of suitable projects. 50% of the directors do not have any other directorship or committee
membership in any other public companies. Except one director, every other director has attended more
than 75% of 12 general body meetings held last year, which shows the commitment towards the company.Appendix
Exhibit 1 – Thyrocare Brands and their offerings
Brand Services Offered
Thyrocare Metabolic Disorders and Thyroid Testing
Aarogyam Wellness and Preventive offering including liver, cholesterol,
kidney, thyroid, pancreas and other chronic disorders
Nueclear Cancer Monitoring- Full Body and Brain Scans
Whaters Water Testing- physical and chemical compounds testing
Source: Company Annual Report
Exhibit 2 – Type of Tests offered at CPL and RPL
Types of Thyroid Tests CPL RPL
Thyroid Stimulating Hormone Yes Yes
Total Triiodothyronine Yes Yes
Total Thyroxine Yes Yes
Non thyroid tests
CLIA Yes Yes
ELISA Yes
HPLC Yes Yes
Electrophoresis Yes
Flow cytometry Yes
Fluorescence Flowcytometry Yes Yes
Nephelometry Yes
Photometry Yes Yes
Liquid Chromatography Mass Spectrometry Yes
ICP-MS Yes
Wellness and Preventive Tests
Aarogyam 1.1 Yes Yes
Aarogyam 1.2 Yes Yes
Aarogyam 1.3 Yes Yes
Aarogyam 1.4 Yes
Aarogyam 1.5 Yes
Aarogyam 1.6 Yes
Aarogyam 1.7 Yes
Source: Thyrocare RHPExhibit 3 – Nationwide Location of CPL, RPL, Hubs and NHL PET-CT scan centers
Source: Thyrocare RHPExhibit 4 – Demand Drivers for Diagnostics Industry In India
Health insurance coverage in India
INR
Mn Increasing health insurance coverage ...
300
250
200
150
100
50
0
1 2 3 4 5
Total Non-Life Industry # of persons covered
...alongwith high population ...with more people in higher age groups will fuel demand
for diagnostic industry
growth...
1.36 1.42 6.9 8.2 9.2 10.7 12.5
1.29 11.1 13.6
1.21 14.8 15.5 16.3
1.03 19.6 20.5 21.1 22.5 23.7
27
28.6 28 26 24.3
35.4 29 26.8 25.1 23.4
FY2001 FY2011 FY2016 FY2021 FY2026 FY2001 FY2011 FY2016 FY2021 FY2026
0-14 years 15-29 years 30-44 years 45-59 years 60+ years
Source: Team Research
Exhibit 5 - Industry structureExhibit 6 - Mandatory licences and regulations for Diagnostics industry in India
Shop establishment licence
Pre-natal diagnostic technique act
Bhabha atomic research center guidelines
Pollution control board
Clinical establishment Act, 2010
Source: Team research
Exhibit 7 – Assumption of different growth rates for 3 scenarios
3 Different Scenarios FY17-21 FY22-26
Management case
Diagnostic Testing Services 30% 27%
Imaging Services 30% 30%
Others 30% 30%
Base case
Diagnostic Testing Services 27% 24%
Imaging Services 30% 30%
Others 20% 20%
Downside case
Diagnostic Testing Services 24% 21%
Imaging Services 20% 20%
Others 20% 20%
Source: Team Estimates, Bloomberg, Company Reports, Management Con-call
Exhibit 8 – Peer Comparison
Thyrocare Dr Lal SRL (FY 15) Metropolis
Revenue (In INR 2,410 7,910 8,980 6,500
mn.)
EBITDA Margin 38.8% 27.14% 18.68% 30%
PAT margin 21.50% 16.81% 10-11% 20%
RoE 14.17% 26.29% - -
Dividend 100% 24.5% - -
Revenue Mix 46.4% wellness 95% Pathology - -
and preventive and 5%
and 53.6% others radiology
Geography Mix Balanced ~72% revenue Balanced More focused on
Geographic Mix comes from Geographic Mix of west & south,
of revenues North India revenues
Variety of tests 193 tests 3495 tests 3800 tests 4500 tests
Infrastructure 1 CPL in Navi 172 clinical labs 325 labs in India, 4 130 labs and
Mumbai, 6 RPLs, 1,559 Patient international labs 1,000 collection
22 hubs Service Centers ,7500 collection centers spread
(PSCs) & 4,967 across India,
points
Pickup Points Africa, Sri Lanka
(PUPs) and Mauritius
Source: Annual Reports, Brokerage ResearchExhibit 9 – Valuation Summary Management case Base Case
Downside Case
Disclosures:
Ownership and material conflicts of interest:
The author(s), or a member of their household, of this report does not hold a financial interest in the securities of this company. The
author(s), or a member of their household, of this report does not know of the existence of any conflicts of interest that might bias the
content or publication of this report.
Receipt of compensation:
Compensation of the author(s) of this report is not based on investment banking revenue.
Position as a officer or director:
The author(s), or a member of their household, does not serve as an officer, director or advisory board member of the subject
company.
Market making:
The author(s) does not act as a market maker in the subject company’s securities.
Disclaimer:
The information set forth herein has been obtained or derived from sources generally available to the public and believed by the
author(s) to be reliable, but the author(s) does not make any representation or warranty, express or implied, as to its accuracy or
completeness. The information is not intended to be used as the basis of any investment decisions by any person or entity. This
information does not constitute investment advice, nor is it an offer or a solicitation of an offer to buy or sell any security. This report
should not be considered to be a recommendation by any individual affiliated with Indian Association of Investment Professionals,
CFA Institute or the CFA Institute Research Challenge with regard to this company’s stock.

                                         CFA Institute Research Challenge
You can also read