Identifying monitoring priorities for Population Consequences of Disturbance - Interim Report
←
→
Page content transcription
If your browser does not render page correctly, please read the page content below
Identifying monitoring priorities for Population
  Consequences of Disturbance - Interim Report

   As part of the project: ‘PCoD+ - Developing widely-applicable
  models of the population consequences of disturbance (PCoD)’

    Authors:                      Cormac Booth, Rachael Plunkett & John Harwood
    Report Code:                  SMRUC-ONR-2017-017
    Date:                         6th November 2017

This report is to be cited as: Booth, C.G, Plunkett, R & Harwood, J. 2017. Identifying Monitoring Priorities for
Population Consequences of Disturbance – Interim Report. Report Code SMRUC-ONR-2017-017, submitted to
the Office of Naval Research – Marine Mammal & Biology program, Nov 2017 (unpublished).

This work was sponsored by the Office of Naval Research: Marine Mammal Biology Program, under award
N000141612858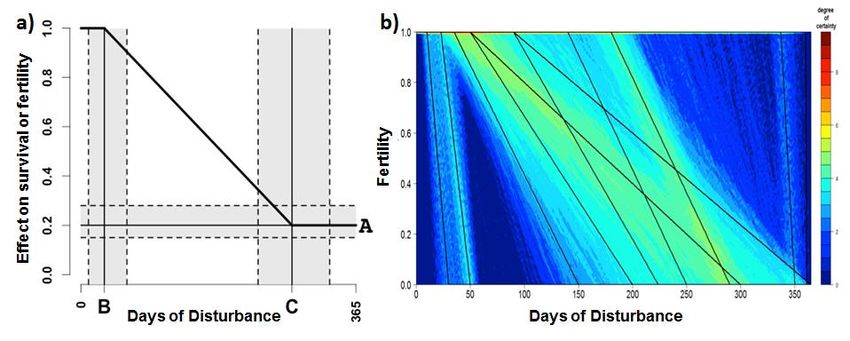
Title: Identifying monitoring priorities to inform population
                                                                                    consequences of disturbance.
                                                                                    Report Code: SMRUC-ONR-2017-017.
                                                                                    Award #: N000141612858.

1 Contents
1    Contents ......................................................................................................................................................... 2
2    Table of Figures ............................................................................................................................................. 3
3    Table of Tables............................................................................................................................................... 5
Executive Summary ................................................................................................................................................ 7
1    Introduction..................................................................................................................................................... 9
  1.1      An Introduction to the PCoD conceptual framework .............................................................................. 9
  1.2      Monitoring marine mammal populations .............................................................................................. 11
  1.3      US Navy marine mammal research and monitoring ............................................................................ 11
  1.4      Report intention and structure ............................................................................................................. 13
2    Review of monitoring methods & variables to inform PCoD ......................................................................... 13
  2.1      Background ......................................................................................................................................... 13
  2.2      Considerations for a PCoD monitoring program .................................................................................. 13
  2.3      Methods for assessing suitability of variables and methods ................................................................ 14
  2.4      Review of monitoring methodologies ................................................................................................... 15
     2.4.1 Hands-on assessment: capture-release, live stranding & necropsies ............................................. 15
     2.4.2 Remote tissue sampling .................................................................................................................. 16
     2.4.3 Visual and acoustic surveys ............................................................................................................ 17
     2.4.4 Capture-recapture ........................................................................................................................... 18
     2.4.5 Photogrammetry.............................................................................................................................. 19
     2.4.6 Individual tracking ........................................................................................................................... 21
  2.5      Workshop Outputs ............................................................................................................................... 21
     2.5.1 Demographic Variables and Methods ............................................................................................. 21
     2.5.2 Health Variables and Methods ........................................................................................................ 27
  2.6      Monitoring in practice .......................................................................................................................... 34
     2.6.1 Precision ......................................................................................................................................... 34
     2.6.2 Sampling scale ................................................................................................................................ 35
3    Sensitivity analyses for ‘early warnings’ ....................................................................................................... 37
  3.1      Methods for assessing potential for early warnings ............................................................................. 37
  3.2      Models used ........................................................................................................................................ 37
  3.3      Results................................................................................................................................................. 38
     3.3.1 Harbour porpoise ............................................................................................................................ 38
     3.3.2 Bottlenose dolphins ......................................................................................................................... 41
     3.3.3 Blainville’s beaked whales............................................................................................................... 42
4    Navy Monitoring of Marine Mammal Populations ......................................................................................... 43
  4.1      Fleet/SYSCOM monitoring program .................................................................................................... 43
     4.1.1 Atlantic ............................................................................................................................................ 44
     4.1.2 Pacific.............................................................................................................................................. 45
  4.2      Exploratory (ONR) and applied research (LMR) efforts ....................................................................... 46
5    Discussion .................................................................................................................................................... 47
  5.1      Review and Workshop Outputs ........................................................................................................... 48
  5.2      Sensitivity Analysis .............................................................................................................................. 49
  5.3      Advancing marine mammal monitoring for informing PCoD ................................................................ 50
  5.4      Caveats and Limitations ...................................................................................................................... 51
6    Conclusions & Recommendations................................................................................................................ 52

Page | 2
Title: Identifying monitoring priorities to inform population
                                                                                  consequences of disturbance.
                                                                                  Report Code: SMRUC-ONR-2017-017.
                                                                                  Award #: N000141612858.

  6.1     Conclusions ......................................................................................................................................... 52
  6.2     Recommendations............................................................................................................................... 53
  6.3     Future work within PCoD+ ................................................................................................................... 54
7    Appendices................................................................................................................................................... 55
  7.1     Workshop Details ................................................................................................................................ 55
     7.1.1 Lines of Evidence ............................................................................................................................ 56
     7.1.2 Species Groupings .......................................................................................................................... 57
  7.2     Summary of US Navy marine mammal monitoring programs.............................................................. 60
8    References ................................................................................................................................................... 69

2 Table of Figures
FIGURE 1 - THE POPULATION CONSEQUENCES OF ACOUSTIC DISTURBANCE (PCAD) FRAMEWORK DEVELOPED BY THE
    NATIONAL RESEARCH COUNCIL’S (NRC) PANEL ON THE BIOLOGICALLY SIGNIFICANT EFFECTS OF NOISE. AFTER
    FIGURE 3.1 IN NRC (2005). THE NUMBER OF + SIGNS INDICATES THE PANEL’S EVALUATION OF THE LEVEL OF
    SCIENTIFIC KNOWLEDGE ABOUT THE LINKS BETWEEN BOXES, 0 INDICATES NO KNOWLEDGE. .............................. 9
FIGURE 2 - THE PCOD FRAMEWORK FOR MODELLING THE POPULATION CONSEQUENCES OF DISTURBANCE DEVELOPED
    BY THE ONR WORKING GROUP ON PCAD (MODIFIED FROM FIGURE 4 OF NEW ET AL. (2014)). ..................... 10
FIGURE 3 – OVERVIEW OF HOW ONR, LMR AND NAVY MARINE SPECIES MONITORING RESEARCH AND MONITORING
    EFFORTS CAN BE VIEWED IN THE CONTEXT OF READINESS (‘TIMELINE’), FOCUS AND TECHNICAL RISK. ................ 12
FIGURE 4 – SCHEMATIC OF ELEMENTS TO BE CONSIDERED IN MONITORING PROGRAM FOR IDENTIFYING VARIABLES THAT
    BE COLLECTED PRACTICALLY AND MIGHT INFORM FUTURE PCOD ANALYSES OF THE EFFECTS OF NAVY ACTIVITIES ON
    MARINE MAMMALS. ........................................................................................................................... 14
FIGURE 5 – FEASIBILITY-UTILITY PLOT FOR METHODS TO MONITOR DEMOGRAPHIC VARIABLES FOR POPULATIONS OF
    DEEP DIVING CETACEANS. FEASIBILITY INDICATES WHICH METHODS ARE MOST PRACTICABLE FOR THIS SPECIES
    GROUP (HIGHER SCORE = GREATER FEASIBILITY) AND UTILITY SCORE INDICATES THE WEIGHTED NUMBER OF
    VARIABLES THAT MIGHT BE MEASURED USING A GIVEN TECHNIQUE. METHODS WITH THE BEST COMBINATION OF
    SCORES APPEAR IN THE UPPER, RIGHT-HAND SIDE OF THE FIGURE. ............................................................... 25
FIGURE 6 - FEASIBILITY-UTILITY PLOT FOR METHODS TO MONITOR DEMOGRAPHIC VARIABLES FOR POPULATIONS OF
    BALEEN WHALES. FEASIBILITY INDICATES WHICH METHODS ARE MOST PRACTICABLE FOR THIS SPECIES GROUP
    (HIGHER SCORE = GREATER FEASIBILITY) AND UTILITY SCORE INDICATES THE WEIGHTED NUMBER OF VARIABLES
    THAT MIGHT BE MEASURED USING A GIVEN TECHNIQUE. METHODS WITH THE BEST COMBINATION OF SCORES
    APPEAR IN THE UPPER, RIGHT-HAND SIDE OF THE FIGURE. .......................................................................... 25
FIGURE 7 - FEASIBILITY-UTILITY PLOT FOR METHODS TO MONITOR DEMOGRAPHIC VARIABLES FOR POPULATIONS OF
    COASTAL DOLPHINS AND PORPOISES. FEASIBILITY INDICATES WHICH METHODS ARE MOST PRACTICABLE FOR THIS
    SPECIES GROUP (HIGHER SCORE = GREATER FEASIBILITY) AND UTILITY SCORE INDICATES THE WEIGHTED NUMBER
    OF VARIABLES THAT MIGHT BE MEASURED USING A GIVEN TECHNIQUE. METHODS WITH THE BEST COMBINATION
    OF SCORES APPEAR IN THE UPPER, RIGHT-HAND SIDE OF THE FIGURE. .......................................................... 26
FIGURE 8 - FEASIBILITY-UTILITY PLOT FOR METHODS TO MONITOR DEMOGRAPHIC VARIABLES FOR POPULATIONS OF
    OCEANIC DOLPHINS. FEASIBILITY INDICATES WHICH METHODS ARE MOST PRACTICABLE FOR THIS SPECIES GROUP
    (HIGHER SCORE = GREATER FEASIBILITY) AND UTILITY SCORE INDICATES THE WEIGHTED NUMBER OF VARIABLES
    THAT MIGHT BE MEASURED USING A GIVEN TECHNIQUE. METHODS WITH THE BEST COMBINATION OF SCORES
    APPEAR IN THE UPPER, RIGHT-HAND SIDE OF THE FIGURE. .......................................................................... 26

Page | 3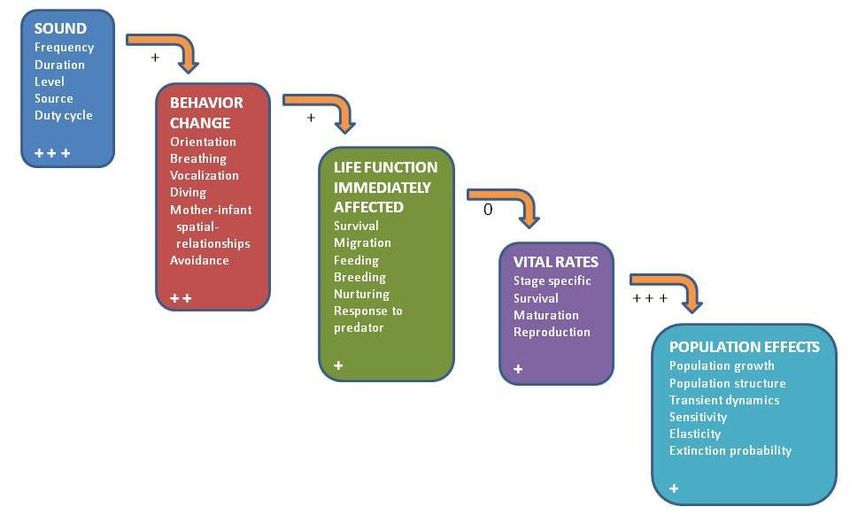
Title: Identifying monitoring priorities to inform population
consequences of disturbance.
Report Code: SMRUC-ONR-2017-017.
Award #: N000141612858.
FIGURE 9 - FEASIBILITY-UTILITY PLOT FOR METHODS TO MONITOR DEMOGRAPHIC VARIABLES FOR POPULATIONS OF
LAND-BREEDING PINNIPEDS. FEASIBILITY INDICATES WHICH METHODS ARE MOST PRACTICABLE FOR THIS SPECIES
GROUP (HIGHER SCORE = GREATER FEASIBILITY) AND UTILITY SCORE INDICATES THE WEIGHTED NUMBER OF
VARIABLES THAT MIGHT BE MEASURED USING A GIVEN TECHNIQUE. METHODS WITH THE BEST COMBINATION OF
SCORES APPEAR IN THE UPPER, RIGHT-HAND SIDE OF THE FIGURE. ............................................................... 27
FIGURE 10 - FEASIBILITY-UTILITY PLOT FOR METHODS TO MONITOR DEMOGRAPHIC VARIABLES FOR POPULATIONS OF
ICE-BREEDING PINNIPEDS. FEASIBILITY INDICATES WHICH METHODS ARE MOST PRACTICABLE FOR THIS SPECIES
GROUP (HIGHER SCORE = GREATER FEASIBILITY) AND UTILITY SCORE INDICATES THE WEIGHTED NUMBER OF
VARIABLES THAT MIGHT BE MEASURED USING A GIVEN TECHNIQUE. METHODS WITH THE BEST COMBINATION OF
SCORES APPEAR IN THE UPPER, RIGHT-HAND SIDE OF THE FIGURE. ............................................................... 27
FIGURE 11 - FEASIBILITY-UTILITY PLOT FOR METHODS TO MONITOR HEALTH OUTCOMES FOR POPULATIONS OF DEEP
DIVING CETACEANS. FEASIBILITY INDICATES WHICH METHODS ARE MOST PRACTICABLE FOR THIS SPECIES GROUP
(HIGHER SCORE = GREATER FEASIBILITY) AND UTILITY SCORE INDICATES THE WEIGHTED NUMBER OF VARIABLES
THAT MIGHT BE MEASURED USING A GIVEN TECHNIQUE. METHODS WITH THE BEST COMBINATION OF SCORES
APPEAR IN THE UPPER, RIGHT-HAND SIDE OF THE FIGURE. .......................................................................... 32
FIGURE 12 - FEASIBILITY-UTILITY PLOT FOR METHODS TO MONITOR HEALTH OUTCOMES FOR POPULATIONS OF BALEEN
WHALES. FEASIBILITY INDICATES WHICH METHODS ARE MOST PRACTICABLE FOR THIS SPECIES GROUP (HIGHER
SCORE = GREATER FEASIBILITY) AND UTILITY SCORE INDICATES THE WEIGHTED NUMBER OF VARIABLES THAT MIGHT
BE MEASURED USING A GIVEN TECHNIQUE. METHODS WITH THE BEST COMBINATION OF SCORES APPEAR IN THE
UPPER, RIGHT-HAND SIDE OF THE FIGURE................................................................................................ 32
FIGURE 13 - FEASIBILITY-UTILITY PLOT FOR METHODS TO MONITOR HEALTH OUTCOMES FOR POPULATIONS OF COASTAL
DOLPHINS AND PORPOISES. FEASIBILITY INDICATES WHICH METHODS ARE MOST PRACTICABLE FOR THIS SPECIES
GROUP (HIGHER SCORE = GREATER FEASIBILITY) AND UTILITY SCORE INDICATES THE WEIGHTED NUMBER OF
VARIABLES THAT MIGHT BE MEASURED USING A GIVEN TECHNIQUE. METHODS WITH THE BEST COMBINATION OF
SCORES APPEAR IN THE UPPER, RIGHT-HAND SIDE OF THE FIGURE. ............................................................... 33
FIGURE 14 - FEASIBILITY-UTILITY PLOT FOR METHODS TO MONITOR HEALTH OUTCOMES FOR POPULATIONS OF OCEANIC
DOLPHINS. FEASIBILITY INDICATES WHICH METHODS ARE MOST PRACTICABLE FOR THIS SPECIES GROUP (HIGHER
SCORE = GREATER FEASIBILITY) AND UTILITY SCORE INDICATES THE WEIGHTED NUMBER OF VARIABLES THAT MIGHT
BE MEASURED USING A GIVEN TECHNIQUE. METHODS WITH THE BEST COMBINATION OF SCORES APPEAR IN THE
UPPER, RIGHT-HAND SIDE OF THE FIGURE................................................................................................ 33
FIGURE 15 - FEASIBILITY-UTILITY PLOT FOR METHODS TO MONITOR HEALTH OUTCOMES FOR POPULATIONS OF ALL
PINNIPEDS. FEASIBILITY INDICATES WHICH METHODS ARE MOST PRACTICABLE FOR THIS SPECIES GROUP (HIGHER
SCORE = GREATER FEASIBILITY) AND UTILITY SCORE INDICATES THE WEIGHTED NUMBER OF VARIABLES THAT MIGHT
BE MEASURED USING A GIVEN TECHNIQUE. METHODS WITH THE BEST COMBINATION OF SCORES APPEAR IN THE
UPPER, RIGHT-HAND SIDE OF THE FIGURE................................................................................................ 34
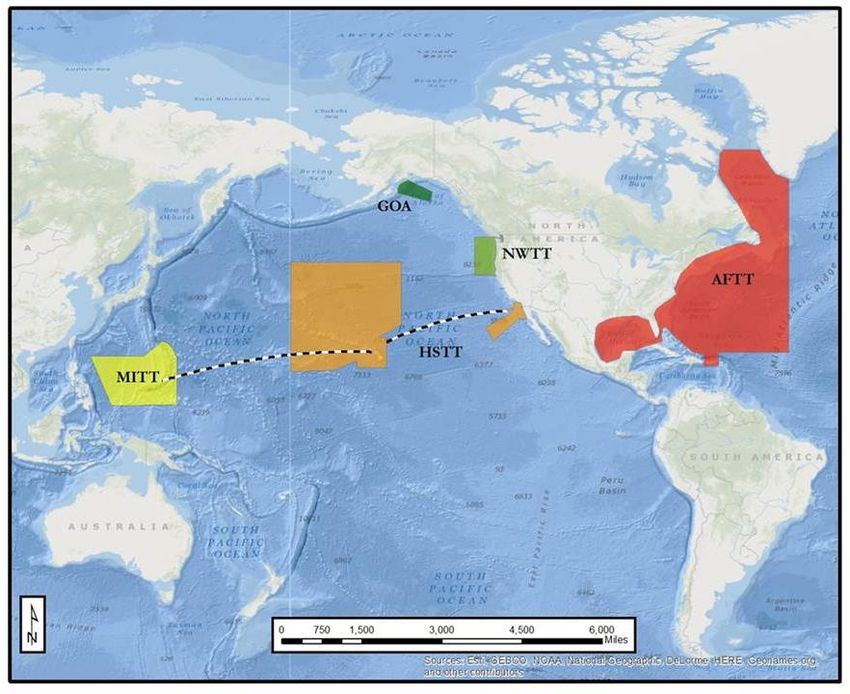
FIGURE 16 – A): RESPONSE FUNCTION USED IN THE EXPERT ELICITATION RELATING NUMBER OF DAYS OF DISTURBANCE
EXPERIENCED BY AN INDIVIDUAL MARINE MAMMAL AND THE EFFECT OF THIS DISTURBANCE ON ITS FERTILITY. A =
MAXIMUM EFFECT OF DISTURBANCE ON FERTILITY, B=NUMBER OF DAYS OF DISTURBANCE REQUIRED BEFORE
DISTURBANCE HAS ANY EFFECT, C = NUMBER OF DAYS OF DISTURBANCE REQUIRED TO HAVE THE MAXIMUM
EFFECT. SHADED AREAS INDICATE THE UNCERTAINTY ASSOCIATED WITH EACH PARAMETER VALUE. B): EXAMPLE
PROBABILITY DENSITY SURFACE DERIVED FROM THE RESPONSES OF MULTIPLE EXPERTS. THE LIKELY PROBABILITY OF
A GIVEN VALUE IS REPRESENTED BY ITS COLOUR, WITH DARK BLUE REPRESENTING A LOW PROBABILITY AND YELLOW
Page | 4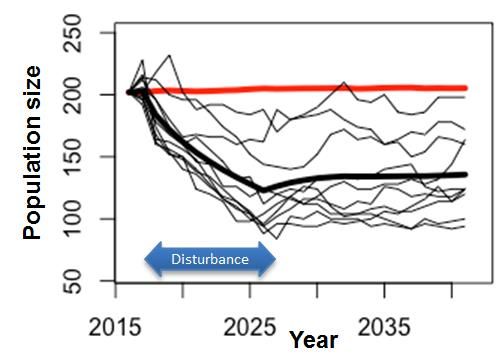
Title: Identifying monitoring priorities to inform population
                                                                              consequences of disturbance.
                                                                              Report Code: SMRUC-ONR-2017-017.
                                                                              Award #: N000141612858.

       REPRESENTING A HIGH PROBABILITY. BLACK LINES INDICATE THE “BEST” RESPONSE FUNCTION PROPOSED BY EACH
       EXPERT. ............................................................................................................................................ 38
FIGURE 17 - EFFECT OF DISTURBANCE OVER 10 YEARS ON A POPULATION OF HARBOUR PORPOISES, AS PREDICTED BY 10
    VIRTUAL EXPERTS. THE RED LINE SHOWS THE PREDICTED CHANGES IN THE ABSENCE OF DISTURBANCE AND THE
    THICK BLACK LINE SHOWS THE MEAN OF ALL 500 VIRTUAL EXPERTS’ PREDICTIONS. ........................................ 39
FIGURE 18 - RELATIONSHIP BETWEEN THE MAXIMUM PREDICTED REDUCTION IN HARBOUR PORPOISE POPULATION SIZE
    AND (A) THE RATIO OF CALVES TO MATURE FEMALES IN YEAR 3, AND (B) THE PROPORTION OF IMMATURE ANIMALS
    IN YEAR 5. ......................................................................................................................................... 40
FIGURE 19 - EFFECT OF DISTURBANCE OVER 10 YEARS ON A POPULATION OF HARBOUR PORPOISES, AS PREDICTED BY 10
    VIRTUAL EXPERTS, INCLUDING THE EFFECTS OF ENVIRONMENTAL STOCHASTICITY. THE RED LINE SHOWS THE
    PREDICTED CHANGES IN THE ABSENCE OF DISTURBANCE AND THE THICK BLACK LINE SHOWS THE MEAN OF ALL 500
    VIRTUAL EXPERTS’ PREDICTIONS. ........................................................................................................... 40
FIGURE 20 - RELATIONSHIP BETWEEN THE MAXIMUM PREDICTED REDUCTION IN HARBOUR PORPOISE POPULATION SIZE
    AND (A) THE RATIO OF CALVES TO MATURE FEMALES IN YEAR 3, (B) THE PROPORTION OF IMMATURE ANIMALS IN
    YEAR 5 WHEN ENVIRONMENTAL VARIATION WAS INCLUDED IN THE SIMULATIONS. ......................................... 41
FIGURE 21 - EFFECT OF DISTURBANCE OVER 10 YEARS ON A POPULATION OF BOTTLENOSE DOLPHINS, AS PREDICTED BY
    10 VIRTUAL EXPERTS, INCLUDING THE EFFECTS OF ENVIRONMENTAL VARIATION AND DEMOGRAPHIC
    STOCHASTICITY. THE RED LINE SHOWS THE PREDICTED CHANGES IN THE ABSENCE OF DISTURBANCE AND THE THICK
    BLACK LINE SHOWS THE MEAN OF ALL 500 VIRTUAL EXPERTS’ PREDICTIONS. ................................................. 41
FIGURE 22 - RELATIONSHIP BETWEEN THE MAXIMUM PREDICTED REDUCTION IN BOTTLENOSE DOLPHIN POPULATION
    SIZE AND (A) THE AVERAGE RATIO OF CALVES TO MATURE FEMALES IN THE FIRST 3 YEARS OF DISTURBANCE, (B) THE
    PROPORTION OF IMMATURE ANIMALS IN YEAR 5 WHEN ENVIRONMENTAL VARIATION AND DEMOGRAPHIC
    STOCHASTICITY WAS INCLUDED IN THE SIMULATIONS. ............................................................................... 42
FIGURE 23 - RELATIONSHIP BETWEEN THE LONG TERM GROWTH RATE OF A BLAINVILLE’S BEAKED WHALE POPULATION
    AND (A) THE RATIO OF CALVES TO MATURE FEMALES ESTIMATED FROM A RANDOM SAMPLE OF 1000 ANIMALS, (B)
    THE PROPORTION OF IMMATURE ANIMALS ESTIMATED FROM A RANDOM SAMPLE OF 1000 ANIMALS (C) THE RATIO
    OF CALVES TO MATURE FEMALES ESTIMATED FROM A RANDOM SAMPLE OF 100 ANIMALS, (D) THE PROPORTION
    OF IMMATURE ANIMALS ESTIMATED FROM A RANDOM SAMPLE OF 100 ANIMALS. ........................................ 43
FIGURE 24 - SUMMARY OF US NAVY FLEET TEST AND TRAINING SITES IN THE ATLANTIC & PACIFIC REGIONS. ........... 44

3 Table of Tables
TABLE 1 – SUMMARY OF METHODS SUITABLE FOR COLLECTION OF INFORMATION ON DEMOGRAPHIC VARIABLES (NOTE
    INDIVIDUAL TRACKING WAS NOT INCLUDED AS IT WAS DETERMINED NOT TO BE SUITABLE FOR MONITORING
    DEMOGRAPHIC VARIABLES IN ISOLATION (ONLY WHEN USED WITH CAPTURE-RECAPTURE APPROACHES) (SEE TABLE
    2)). .................................................................................................................................................. 23
TABLE 2 - EXPERTS’ ASSESSMENT OF THE FEASIBILITY OF COLLECTING INFORMATION ON DEMOGRAPHIC VARIABLES FOR
    EACH SPECIES GROUP USING THE METHODOLOGIES IN TABLE 1. KEY: 0 - NOT FEASIBLE TO COLLECT OR ANALYZE
    SUCH DATA WITHIN FIVE YEARS; 1 - FEASIBLE TO COLLECT DATA OR ANALYZE SAMPLES WITHIN FIVE YEARS, BUT NO
    PLANS TO DO SO; 2 - SUFFICIENT RESULTS FOR REVIEWING RESPONSE VARIABLE ESTIMATION EXPECTED WITHIN
    FIVE YEARS; 3 - METHOD CAN BE USED TO ESTIMATE DEMOGRAPHIC VARIABLES. .......................................... 24
TABLE 3 – SUMMARY OF METHODS SUITABLE FOR COLLECTION OF INFORMATION ON SPECIFIC VARIABLES ON
    INDIVIDUAL HEALTH. ........................................................................................................................... 29

Page | 5
Title: Identifying monitoring priorities to inform population
                                                                           consequences of disturbance.
                                                                           Report Code: SMRUC-ONR-2017-017.
                                                                           Award #: N000141612858.

TABLE 4 - EXPERTS’ ASSESSMENT OF THE FEASIBILITY OF COLLECTING INFORMATION ON HEALTH FOR EACH SPECIES
    GROUP USING THE METHODOLOGIES IN TABLE 3. KEY: NA –THIS METHOD IS NOT CURRENTLY APPROPRIATE FOR
    COLLECTING INFORMATION FOR THIS SPECIES GROUP; 0 - NOT FEASIBLE TO COLLECT OR ANALYZE SUCH DATA
    WITHIN FIVE YEARS; 1 - FEASIBLE TO COLLECT DATA OR ANALYZE SAMPLES WITHIN FIVE YEARS, BUT NO PLANS TO
    DO SO; 2 - SUFFICIENT RESULTS FOR REVIEWING RESPONSE VARIABLE ESTIMATION EXPECTED WITHIN FIVE YEARS; 3
    - METHOD CAN BE USED TO PROVIDE HEALTH MEASURES. ......................................................................... 31
TABLE 5 - SUMMARY OF THE NAVY MONITORING STUDIES CONDUCTED BETWEEN 2012 AND 2016, OUTLINING THE
    FOCUS SPECIES, MONITORING TYPES, GEOGRAPHIC AREAS WHERE CONDUCTED AND PLATFORMS USED. X DENOTES
    WHICH SPECIES WERE STUDIED, THE SURVEY METHOD AND PLATFORM USED. GREEN SHADING INDICATES THE
    PRIMARY GROUPS / METHODS / PLATFORMS OF THE MONITORING CONDUCTED. A FULL TABLE IS PRESENTED IN
    TABLE 10 IN APPENDIX 7.2. ................................................................................................................. 46
TABLE 6- ATTENDEES OF THE IDENTIFYING MONITORING PRIORITIES FOR PCOD WORKSHOP................................. 55
TABLE 7 – PRESENTATIONS MADE AT THE IDENTIFYING MONITORING PRIORITIES WORKSHOP IN SPRING 2017. ....... 55
TABLE 8 - BREAKOUT GROUPS TO EXPLORE SUITABLE VARIABLES AND METHODS TO INFORM FUTURE PCOD ANALYSIS.
    PROJECT TEAM SHOWN WITH *. ........................................................................................................... 56
TABLE 9 - SPECIES GROUPINGS IN FEASIBILITY-UTILITY ASSESSMENTS. WHERE THERE IS AN *, THIS INDICATES WHERE
      SPECIES MIGHT BE MOVED TO ANOTHER CATEGORY DEPENDING ON THE HABITAT AND MOVEMENT PATTERNS OF A
      SPECIFIC POPULATION (E.G. KILLER WHALES MIGHT BE CONSIDERED COASTAL OR OCEANIC, DEPENDING ON
      POPULATION). ................................................................................................................................... 59
TABLE 10 - SUMMARY OF THE RECENT AND CURRENT US NAVY MARINE MAMMAL MONITORING PROGRAMMES AND
    PUBLICATIONS (I.E. THERE IS SOME DUPLICATION) SUMMARISING THE SPECIES GROUP OF INTEREST, THE SURVEY
    PLATFORM AND SURVEY METHOD EMPLOYED. AUTEC = ATLANTIC UNDERSEA TEST AND EVALUATION CENTRE,
    CHPT = CHERRY POINT, GOA TMAA = GULF OF ALASKA TEMPORARY MARITIME ACTIVITIES AREA, HSTT =
    HAWAII-SOUTHERN CALIFORNIA TRAINING & TESTING (INCLUDES HRC (HAWAII RANGE COMPLEX), SOCAL
    (SOUTHERN CALIFORNIA), SOAR (SOUTHERN CALIFORNIA ANTI-SUBMARINE WARFARE RANGE) & PMRF
    (PACIFIC MISSILE RANGE FACILITY)), JAX = JACKSONVILLE, MINEX = MINE EXERCISE, MITT = MARIANA ISLANDS
    RANGE, NAS PAX = CHESAPEAKE BAY, NSWC PCD = NAVAL SURFACE WARFARE CENTRE, PANAMA CITY
    DIVISION, NWTT = NORTHWEST TRAINING RANGE, VACAPES = VIRGINIA CAPES. ...................................... 60

Page | 6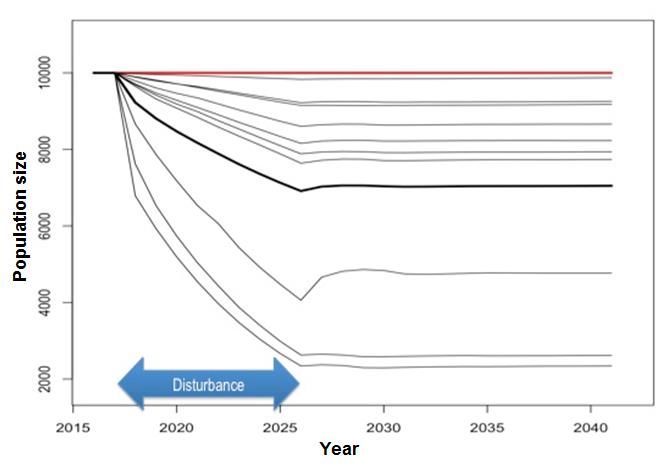
Title: Identifying monitoring priorities to inform population
                                                          consequences of disturbance.
                                                          Report Code: SMRUC-ONR-2017-017.
                                                          Award #: N000141612858.

 Executive Summary
The Population Consequences of Disturbance (PCoD) framework provides a conceptual framework which can be
used to forecast a plausible range of population-level outcomes given a specific set of input data. To implement
such frameworks for a species of interest requires significant baseline knowledge of foraging patterns, life-
history, and demographic parameters. However, for many marine mammal populations, current knowledge is
lacking and such ‘data poor’ situations mean that any such forecasts have significant uncertainty associated with
them. Given these uncertainties there is merit in identifying the data gaps that need to be filled in order to better
parameterise the models. However it may take decades to fill these gaps and, in the meantime, undetected
population declines may occur. In this report we focus on identifying methods for monitoring populations that are
subject to disturbance that may also provide insights into the processes through which disturbance may affect
these populations. In addition, we aim to identify priorities for monitoring to inform future PCoD analysis of the
potential effects of Navy activities on marine mammal populations. Therefore, our ultimate objective is to identify
a suite of variables that can provide information on changes in demography or health, together with the
methodologies that can be used to measure these variables.

To identify and address the knowledge gaps highlighted above, we conducted a comprehensive survey of the
literature to identify suitable response variables which could be monitored using established survey techniques or
techniques that are currently in development. Following the initial literature review, we held a workshop with a
small number of experts on monitoring approaches to develop this list further and to identify the current state of
utility and feasibility of the different approaches for Navy relevant marine mammal species groups. This report
summarises the results of the literature review, and the outputs from the workshop. In addition, we explore the
methods and/or techniques required to collect appropriate datasets and the feasibility of using them to monitor
different species and populations (section 2) with sufficient precision to avoid false positive results (i.e. results
that suggest a population is in decline when it is not). Therefore, using existing PCoD benchmark models, we
explore the potential for different demographic parameters to provide early warning indicators of population
decline and explore the potential to detect change and limit the proportion of false positive results (section 3). In
order to realistically assess what methods might be feasible to conduct, it was considered crucial to assess the
monitoring infrastructure that currently exists. As such, we also summarize US Navy marine mammal monitoring
in terms of the approaches already in use, the platforms for research available (e.g. vessels, aerial, fixed sensors
etc.) and species/populations which are currently (or have recently been) monitored (section 4). Building from
this foundation, we assess the potential for current monitoring practice to inform a PCoD analysis (section 5.3)
using the lessons learned from the literature review and sensitivity analysis phases.

Using existing PCoD models, we determined that changes in certain demographic variables are strongly
correlated with changes in abundance or population status, and can therefore provide some early warning of
future changes in abundance. In particular, the proportion of immature animals in a population might provide a
reasonable early indicator of population decline. We also explored the ratio of mothers to calves/pups but
determined that there was a high risk of false positives (i.e. predicting a decline when there is none). We
observed that demographic parameters tend to be most commonly estimated from monitoring using established
approaches such as visual surveys and capture-recapture. In addition, both vertical and lateral photogrammetry
appear to be viable methods to determine important demographic parameters. Monitoring body condition might
be a suitable approach to identify ‘unhealthy’ animals (though determining causation may be difficult) and is a
particularly attractive route for monitoring PCoD and a range of methods are in development to explore this topic
area. In general, monitoring individual health and physiological variables was determined to be important in
informing elements of the PCoD framework, primarily via photogrammetry, remote tissue sampling, direct

Page | 7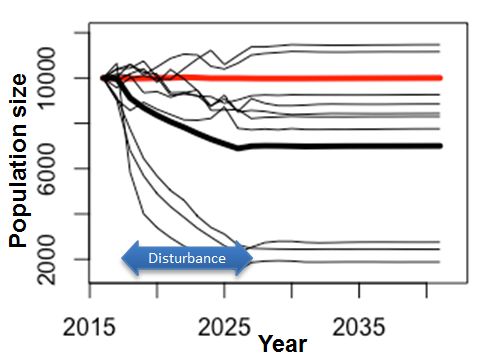
Title: Identifying monitoring priorities to inform population
                                                       consequences of disturbance.
                                                       Report Code: SMRUC-ONR-2017-017.
                                                       Award #: N000141612858.

handling and individual tracking approaches. The continued development of remote tissue sample libraries and
analytical approaches to improve our understanding of stress response, physiology and –omics fields is critical.
Additionally, it is important to continue the use (and development) of PAM techniques to monitor cetacean
populations to better understand the relative and absolute indices that can be derived to inform PCoD.

We recommend that, where possible, monitoring programs are developed to specifically inform future PCoD
analyses, which requires a clear set of objectives regarding the purpose of the monitoring. Monitoring programs
should be identified which can provide reference or control populations against which observed patterns can be
compared.

We have highlighted that, where possible, the integration of new technologies into existing Fleet/SYSCOM
monitoring efforts might provide significant added value. The inclusion of novel approaches into monitoring
programs where infrastructure exists means a cost-effective increase in what can be achieved by a given
program.

Page | 8
Title: Identifying monitoring priorities to inform population
consequences of disturbance.
Report Code: SMRUC-ONR-2017-017.
Award #: N000141612858.
1 Introduction
1.1 An Introduction to the PCoD conceptual framework
Between 2009 and 2015, a working group supported by ONR developed a mathematical framework for
assessing the population consequences of disturbance (PCoD). The initial framework, shown in Figure 1, is
based on a conceptual model drawn up by a National Research Council committee on Characterizing Biologically
Significant Marine Mammal Behavior (National Research Council 2005) and was focused exclusively on acoustic
disturbance.
Figure 1 - The Population Consequences of Acoustic Disturbance (PCAD) framework developed by the
National Research Council’s (NRC) panel on the biologically significant effects of noise. After Figure 3.1 in NRC
(2005). The number of + signs indicates the panel’s evaluation of the level of scientific knowledge about the
links between boxes, 0 indicates no knowledge.
The initial framework was expanded by the ONR working group to consider forms of disturbance other than
noise, and to address the impact of disturbance on physiology as well as behaviour. The updated framework is
shown below (Figure 2), and described in more detail in New et al. (2014) and National Academies of Sciences
and Medicine (2017). The PCoD framework outlines how disturbance may impact both the behaviour and
physiology of an individual, and how changes in these characteristics may affect that individual’s vital rates either
directly (an acute effect) or indirectly via its health (a chronic effect). A key component of this framework is an
assessment of the health of individuals. A variety of health indices, including allostatic load, energy stores,
immune status, organ status, stress levels, contaminant burden, and parasite load, may be used. Appropriate
health indices integrate the potential effects of physiological and behavioral responses to multiple stressors on
fitness over a time scale that is longer than the duration of the responses themselves but shorter than the
response time of vital rates. Such indices can provide early indicators of risk of reduced survival and
reproduction before an actual alteration in these rates and can increase understanding of the mechanisms by
which disturbance affects fitness.
To implement such frameworks for a species of interest requires substantial knowledge of foraging patterns, life-
history schedules, and demographics. Therefore, it was essential to use well-studied species to validate the
approach. The ONR working group considered four case studies that spanned the range of marine mammal
taxonomic groups and reproductive strategies, and for which there were large, robust dataset. The resulting
Page | 9Title: Identifying monitoring priorities to inform population
consequences of disturbance.
Report Code: SMRUC-ONR-2017-017.
Award #: N000141612858.
publications explore how changes in behavior (in response to disturbance) could affect adult female energy
reserves and the implications of this for fertility and/or survival (adult or offspring) in elephant seals (Mirounga
spp.)(Schick et al. 2013b, New et al. 2014, Costa et al. 2016, Schwarz et al. 2016), bottlenose dolphins (Tursiops
truncatus)(New et al. 2013a, Pirotta et al. 2015, Schwarz et al. 2016), North Atlantic right whales (Eubalaena
glacialis)(Schick et al. 2013a, Rolland et al. 2016) and beaked whales (Order Ziphiidae)(New et al. 2013b).
Figure 2 - The PCoD framework for modelling the population consequences of disturbance developed by the
ONR working group on PCAD (modified from Figure 4 of New et al. (2014)).
In its description of the PCAD framework (Figure 1), the National Research Council (2005) highlighted how well
specific variables (i.e. those in each box) could be measured and how well understood the transfer functions
between each box were. During the same time that the ONR working group was developing the model
framework described above, a wide range of Navy funded efforts (summarised in Harris and Thomas 2015,
Popper and Hawkins 2016, Southall et al. 2016) have improved our understanding of the extent and scale over
which marine mammals are exposed to Navy activities and how individuals respond to exposure. Whilst these
studies were not explicitly designed to fit into the PCoD framework, they nevertheless provide important jigsaw
pieces, developing our knowledge base of potential effects of exposure to Navy activity on marine mammal
species. However, most of these efforts have addressed the transfer function on the left-hand side of the PCoD
framework, which are concerned with ‘disturbance’ and ‘physiological and behavioural changes’ at an individual
level and improving knowledge on the causal mechanisms of responses to exposure (e.g. Ellison et al. 2013).
In addition a number of studies have explored links between health and vital rates (e.g. fertility and survival) in
marine mammals populations where the body condition of individual animals can be measured directly This work
includes studies of the relationship between foraging success and body condition (Schick et al. 2013b) and
between body condition and pup survival in elephant seals (New et al. 2014), studies of the links between
physiological indicators, health and reproductive success in bottlenose dolphins following the Deepwater Horizon
oil spill (Schwacke et al. 2013, Lane et al. 2015, Schwacke et al. 2017), and studies of blood chemistry in
stranded and wild caught harbour seals (Greig et al. 2010). In addition, sightings history and visual health
assessments of North Atlantic right whales have been used in a Bayesian hierarchical framework to estimate
health status, demography and population status (e.g. Schick et al. 2013a, Rolland et al. 2016). Although it has
proved possible to develop full PCoD models for a number of marine mammal species (King et al. 2015, van
Beest et al. 2015, Booth et al. 2016, Harwood and Booth 2016, Nabe-Nielsen and Harwood 2016, Tollit et al.
Page | 10Title: Identifying monitoring priorities to inform population
consequences of disturbance.
Report Code: SMRUC-ONR-2017-017.
Award #: N000141612858.
2016), the paucity of data on the transfer functions in the centre and right-hand sides of the PCoD framework,
that describe how disturbance impacts health and vital rates and how changes in health affects vital rates (and
thus population dynamics) remains a major challenge to the development of more models.
1.2 Monitoring marine mammal populations
The PCoD framework provides a conceptual framework which can be used to forecast a plausible range of
outcomes given a specific set of input data. However, as noted above, in data poor situations any forecasts have
significant uncertainty associated with them. Given these uncertainties there is merit in identifying the data gaps
that need to be filled in order to better parameterise the models. However it may take decades to fill these gaps
and, in the meantime, undetected population declines may occur. In this report we focus on identifying methods
for monitoring populations subject to disturbance that may also provide insights into the processes through which
disturbance may affect these populations. Typically, animal populations are monitored via surveys to determine
population size or density. Whilst there are well established approaches – such as line-transect surveys for
cetaceans (e.g. Wade and Gerrodette 1993) or telemetry-corrected haulout counts for pinnipeds (e.g. Thompson
and Harwood 1990) - for estimating the size of marine mammal populations, these are expensive and,
particularly in the case of cetacean populations, tend to provide imprecise estimates because marine mammal
populations are often spread over wide areas and spend a lot of time submerged where they cannot be sighted.
Consequently, monitoring programs based on these approaches typically only have the power to detect the
drastic declines (Taylor et al. 2007, Jewell et al. 2012). Additionally, for long lived species, it can take a long time
before changes in vital rates manifest themselves as changes in population size. There may, therefore, be merit
in monitoring demographic variables and indicators of individual health (detailed in Chapter 7 of National
Academies of Sciences and Medicine 2017) rather than population size. The National Academies report
highlights the need to identify variables that can provide an early warning of population decline. It notes that
monitoring demographic variables might allow for early detection of population level effects, and that monitoring
health indicators may help to identify some of the drivers of changes in these variables
In order to properly assess what is feasible in terms of monitoring programs designed to identify PCoD, it is
crucial to consider the monitoring infrastructure that currently exists. This infrastructure is summarised below and
described in detail in section 4.
1.3 US Navy marine mammal research and monitoring
The US Navy has a broad apparatus via which marine mammal research and monitoring is conducted. The
Office of Naval Research (ONR) Marine Mammal Biology program “supports basic and applied research and
technology development related to understanding the effects of sound on marine mammals, including
physiological, behavioural, ecological effects and population-level effects.” (ONR 2017). The Living Marine
Resources (LMR) program is responsible for funding applied research demonstrate and validate (DEMVAL)
research efforts to help transition this science (where appropriate) into Navy compliance monitoring, for which the
Navy Marine Species Monitoring program oversees. These monitoring programs support Endangered Species
Act (ESA) and Marine Mammal Protection Act (MMPA) authorizations. A schematic of how US Navy funded
research and monitoring is captured under each program is shown below (Figure 3).
Page | 11Title: Identifying monitoring priorities to inform population
consequences of disturbance.
Report Code: SMRUC-ONR-2017-017.
Award #: N000141612858.
Figure 3 – Overview of how ONR, LMR and Navy Marine Species Monitoring research and monitoring efforts
can be viewed in the context of readiness (‘timeline’), focus and technical risk.
The overall approach of Navy Marine Species Monitoring for both Atlantic and Pacific range complexes is
captured in four conceptual framework categories (DoN 2016a, b):
“Occurrence – gathers basic information on the presence and diversity of species that occur in a Navy range or
area of proposed training activity; information by patterns of habitat use, population structure, density,
abundance, and behavioral ecology (e.g., feeding, mating, migrating).
Exposure – examines Navy training activities including where, when, and how often sources are being used,
types and properties of generated sounds, and sound propagation to determine received levels and other
metrics. Exposure and occurrence information may be coupled to estimate number of individuals from each
population that are exposed to specific sound levels.
Response – investigates how animals react to exposure across spatial (e.g., changes in habitat) and temporal
(short-term, medium-term, and long-term) scales, behavioral and social interactions. The findings on responses
may be useful in refining exposure estimates.
Consequences – considers species occurrence and habitat use cumulatively to determine long-term impacts of
exposure and responses. These investigations include evaluating long-term impacts on distribution, behavior,
social groups, and foraging success and their effects to fitness through reproduction, growth, and survival.”
- DoN (2016a)
With these categories in mind, it is clear that parallels can be drawn to the PCoD framework described in New et
al. (2014), where ‘Occurrence’ and ‘Exposure‘ are integral to the assessment of numbers of animals disturbed,
‘Response’ captures the link between disturbance and behavioral and physiological changes, and
‘Consequences’ is concerned with how such changes might impact upon health, vital rates and ultimately
population dynamics. The monitoring program is overseen by a steering committee (with a Strategic Planning
Process) which develops broad intermediate scientific objectives (ISOs) and monitoring questions under each of
the categories above.
Page | 12Title: Identifying monitoring priorities to inform population
consequences of disturbance.
Report Code: SMRUC-ONR-2017-017.
Award #: N000141612858.
In the context of this project, our aim was identify variables and methods that could inform future PCoD analysis
of the effects of Navy activities on marine mammals. Here we identify a suite of suitable methods that could
provide this information as part of existing Navy monitoring programs using either established survey techniques
or techniques that require further development.
1.4 Report intention and structure
To address the knowledge gaps highlighted above, we conducted a comprehensive survey of the literature to
identify suitable response variables which could be monitored using established survey techniques or techniques
that are currently in development. Following the initial review, we held a workshop with a small number of experts
on monitoring approaches to develop this list further.
This report summarises the results of the literature review, and the outputs from the workshop. In addition we
explore the methods and/or techniques required to collect appropriate datasets and the feasibility of using them
to monitoring different species and populations (section 2). Using existing PCoD models, we explore the potential
utility of different demographic parameters to provide early warning indicators of population decline (section 3).
We also summarize US Navy marine mammal monitoring (section 4) and assess the potential for current
monitoring practice to inform a PCoD analysis (section 5.3) using the lessons learned from the literature review
and sensitivity analysis phases. We conclude the report with recommendations for how to inform future PCoD
analysis of the effects of Navy activities on relevant marine mammal populations (section 6).
2 Review of monitoring methods & variables to inform PCoD
2.1 Background
Fleishman et al. (2016) identified four elements that should be included in the design and implementation of a
monitoring program to investigate the potential effects of human activity on marine mammal behavior and
physiology, and the population-level consequences of any behavioral and physiological changes. Those
elements are: develop a set of mechanistic hypotheses that outline why a given activity might be expected to
have measurable effects; define a set of biologically meaningful effects; select appropriate response variables for
monitoring; and specify a temporal sequence of monitoring. We investigate how this approach could be used in
the design of monitoring program for marine mammals on Navy ranges so that they could inform PCoD models.
Specifically, we focused on identifying suitable response variables and appropriate methods (considering
available platforms, feasibility, and the relative cost and precision of different approaches) for monitoring these
response variables. This section presents the literature review and integrates its conclusions with the outputs
from the workshop held with the project team and invited experts (see Appendix – section 7.1 for further details).
2.2 Considerations for a PCoD monitoring program
It is important to consider at an early design stage how the characteristics of a monitoring program will affect our
ability to measure the response variables of interest. For example, even if a particular response variable has the
potential to provide an early warning of unacceptable population change, it will be of limited value if it cannot be
monitored practically or with sufficient precision.
Here we outline some of the key steps involved in designing or augmenting a monitoring program (Figure 4). As
noted above, simply monitoring population density or abundance is unlikely to provide an early warning of
population decline because of the relatively low precision associated with most density estimates. However,
Page | 13Title: Identifying monitoring priorities to inform population
consequences of disturbance.
Report Code: SMRUC-ONR-2017-017.
Award #: N000141612858.
there may be situations, for example where there is a small resident population, when population size can be
estimated as or more precisely than any other variable.
Figure 4 – Schematic of elements to be considered in monitoring program for identifying variables that be
collected practically and might inform future PCoD analyses of the effects of Navy activities on marine
mammals.
Our ultimate objective is to identify a suite of variables that can provide information on changes in demography or
health, together with the methodologies that can be used to measure these variables. This involved an
assessment of the temporal and spatial scale of sampling required to achieve a sample size that is appropriate
for robust estimation. In addition, the availability of suitable platforms (e.g. vessel, air, land-based) for data
collection and the costs of data collection and analysis need to be considered. Critically, it must be possible to
measure or estimate the chosen response variables with sufficient precision to detect change and limit the
proportion of false positive results (i.e. results that suggest a population is in decline when it is not). These will be
dictated by a species or population’s life-history, its behavior (e.g. migratory or resident) and its distribution (e.g.
wide-ranging or local) and the survey methodologies that are currently available or in development. These
elements are explored in subsequent sections.
2.3 Methods for assessing suitability of variables and methods
Using the results from the literature search and the workshop exercises (section 7.1), we identified a set of
currently available and developing methodologies for monitoring demographic variables and individual health that
are reviewed in section 2.4. At the workshop, we agreed to follow a multiple lines of evidence (LoE) approach
(e.g. Ross 2000, Amidan et al. 2015) to assess the value of these methodologies for monitoring marine mammal
populations. This involved making a judgement on the feasibility and the utility of each methodology for following
marine mammal groups (see Appendix 7.1.2 for details):
Deep-diving cetaceans
Baleen whales
Coastal dolphins and porpoises
Oceanic dolphins
Land-breeding pinnipeds
Ice-breeding pinnipeds
Page | 14Title: Identifying monitoring priorities to inform population
consequences of disturbance.
Report Code: SMRUC-ONR-2017-017.
Award #: N000141612858.
Here ‘feasibility’ captured the readiness of the methodology for use in a monitoring program, the likelihood that it
could be applied to each marine mammal group, and its potential for collecting demographic / health information
as new analytical techniques become available. It should be recognised that feasibility was assessed on a
relative scale for each class of response variable, so that a feasibility score of 3 applied to a methodology for
measuring demographic variables cannot be equated directly with a score of 3 applied to a methodology for
monitoring health measures. ‘Utility’ captured the number of demographic variables and/or health measures that
could be monitored with a specific method. For the ‘Feasibility-Utility’ assessments (sections 2.5.1.3 and 2.5.2.3)
experts also ranked the demographic variables in terms of their potential value as early warning indicators and
these ranks were used to weight the value of variables (as not variables are equally valuable in informing
demography or health). Following the workshop, we developed a similar value ranking index (not reviewed by the
health experts but following the approach undertaken by demography experts in the workshop) for health
variables. The ranking combined an assessment of the current feasibility of collecting information on each
variable and how informative the variable was likely to be in a health monitoring context (see Appendix 7.1.1 for
details) and this was used to weight as described above.
2.4 Review of monitoring methodologies
Here we review the methods categories that the experts selected and describe their use in informing PCoD
analyses. In section 2.5, we present the outputs of the workshop and subsequent analyses to explore the
feasibility and utility of each approach.
2.4.1 Hands-on assessment: capture-release, live stranding & necropsies
Hands-on assessment of marine mammals can be conducted on live animals that have been caught and then
released, on live or dead stranded animals, or bycaught animals. The demographic variables that can be
estimated from hands-on assessments include age at sexual maturity and age at first pregnancy, sex ratio, and
survival and pregnancy/inter-birth-interval rates. For example, whether or not an animal is pregnant can be
assessed using ultrasound, hormone analysis or physical examination of sex organs (e.g. Kjeld et al. 2006,
Galatius et al. 2013, Kellar et al. 2013, Wells et al. 2014). Ultrasound has also been used to measure blubber
thickness in stranded/bycaught small delphinids (Joblon et al. 2014) and in live baleen whales, specifically North
Atlantic right whales and Southern right whales (Eubalaena australis)(Moore et al. 2001, Miller et al. 2011, Miller
et al. 2012a, Nousek-McGregor et al. 2013). Serum, urine and blubber sampling as part of hands-on
assessments can also provide a wide range of omics biomarkers, immune function markers and hormone
measurements. A comprehensive review of the methods used to obtain reproductive information (e.g.
reproductive hormones such as progesterone and also including stress hormones (e.g. cortisol)) from hands-on
assessment of free-living or dead cetaceans can be found in Mello and Oliveira (2016). The age of individual
animals can be estimated from growth layers in teeth (e.g. dolphin species, Hohn and Fernandez 1999,
pinnipeds, Blundell and Pendleton 2008) or earplugs (e.g. baleen whales, Trumble et al. 2013), and from fatty
acid concentration in blubber (e.g. odontocetes, Koopman et al. 2003, Herman et al. 2008).
Hands-on assessments of live animals are often performed as part of capture-release or individual-tracking
studies (see section 2.4.6). Hall et al. (2010) provides a comprehensive review of possible approaches and
outputs of health assessments that are made as part of these studies. For example in the Sarasota Dolphin
Research Program individual bottlenose dolphins have been captured since the 1980’s to conduct health
assessments and to obtain demographic data such as sex ratio, age structure, pregnancy rates, survival rates
and age at maturity (Wells and Scott 1990, Wells et al. 2004). Serum samples and ultrasound have been used to
Page | 15Title: Identifying monitoring priorities to inform population
consequences of disturbance.
Report Code: SMRUC-ONR-2017-017.
Award #: N000141612858.
assess physiological state and pregnancy status respectively in pinnipeds captured for individual-tracking studies
(e.g. Roletto 1993, Mellish et al. 2004, Mellish et al. 2006, Greig et al. 2010).
Similar information can be collected from hands-on studies of animals found dead or stranded but still alive.
However, these samples may not be representative of the healthy population. In addition, deep diving cetaceans
and oceanic dolphins are less likely to be available for this kind of sampling than other marine mammal groups
because they wash ashore less frequently than coastal species. Even when a stranded carcass is available, its
suitability to provide information on demographic and health variables will depend on its level of decomposition.
The sample sizes obtained from hands-on assessments of stranded animals are usually small, but larger
samples may be available from bycaught animals and animals harvested for subsistence or during culls.
2.4.2 Remote tissue sampling
Tissue samples may be collected remotely using biopsy darts and from blows and faeces. Biopsy samples of
blubber can be analyzed to obtain data on sex ratios, reproductive hormones and wax/sterol esters or fatty acids
to estimate the age/stage class of the population and many of the hormone and markers highlighted in section
2.4.1.
Remote sampling methods have been used to measure reproductive hormone levels in blubber samples from
delphinid species (e.g. Kellar et al. 2009, Trego et al. 2013), baleen whales (e.g. bowhead whales, Kellar et al.
2013, humpback whales, Vu et al. 2015) and deep diving cetaceans such as sperm whales (Sinclair et al. 2015).
Biopsy samples have been obtained during several US Navy marine mammal monitoring programs, for example:
the baseline vessel monitoring at the East Coast Range complexes (Foley et al. 2016b), humpback whale
monitoring in the mid-Atlantic (Aschettino et al. 2016), the mid-Atlantic continental shelf break cetacean study
(HDR 2016) and during the study of the occurrence, ecology and behaviour of deep diving odontocetes at Cape
Hatteras (Foley et al. 2016a).
Sampling the blow from respiring animals is a non-invasive method that can be used to assess the reproductive
status of individual animals based on their hormone levels. For example, testosterone and progesterone levels
have been measured in blow samples from humpback, northern right, northern bottlenose, long-finned pilot
(Globicephalus melas) and sperm whales (e.g. Hogg et al. 2009, Dunstan et al. 2012, Hunt et al. 2013,
Thompson et al. 2014). Blow samples can be obtained from sample receptacles attached to cantilever poles
which are positioned above the blowhole of the animal, but this requires very close proximity of vessels to the
target animal. Remote options are now becoming more widely available with the use of drones which can be
used to collect samples in difficult or sensitive locations (e.g. the Snotbot, Bennett et al. 2015). It can be difficult
to collect samples in this way from fast moving species, and environmental factors, such as sea state and wind
speed, can affect the likelihood of successful sampling. This approach is at a relatively early stage of
development and, for most species groups, further research is required to confirm its utility and the accuracy with
which reproductive status can be assessed.
Faecal sampling is an established, non-invasive technique for monitoring the health of pinnipeds (Harvey 1989,
Fossi et al. 1997, Trites and Joy 2005, Deagle and Tollit 2007), killer whales (Hanson et al. 2010, Ford et al.
2011, Ayres et al. 2012)and baleen whale species (reviewed in Hunt et al. 2013). From these faecal samples it is
possible to obtain measures of a number of physiological markers including stress hormones, reproductive
hormones, thyroid hormone metabolites (as indicators of nutritional stress), gut microflora (including parasite
load), exposure to toxins, prey DNA and faecal hormone metabolites (to assess acute vs chronic stress
Page | 16You can also read