Hydrogen peroxide modification affects the structure and physicochemical properties of dietary fibers from white turnip (Brassica Rapa L.) - Nature
←
→
Page content transcription
If your browser does not render page correctly, please read the page content below
www.nature.com/scientificreports
OPEN Hydrogen peroxide modification
affects the structure
and physicochemical properties
of dietary fibers from white turnip
(Brassica Rapa L.)
Qi Gao1,3,4, Xue‑jie Zhou1,4, Rui Ma1, Han Lin1, Jia‑le Wu1, Xue Peng1, Masaru Tanokura2* &
You‑lin Xue1*
Turnip (Brassica rapa L.) is widely consumed as a vegetable and traditional Chinese medicine with
high dietary fiber content. Soluble dietary fiber (SDF) and insoluble dietary fiber (IDF) were obtained
from white turnips, and the IDF was modified with alkaline hydrogen peroxide to obtain modified
IDF (MIDF) and modified SDF (MSDF). The compositional, structural, and functional properties of
the four samples were investigated. After modification, the modified dietary fibers (MDFs) showed
smaller particle sizes and lower contents of pectin and polyphenol than those of unmodified dietary
fibers (DFs) The results of scanning electron microscopy (SEM), Fourier transformed infrared (FT-
IR) spectroscopy, X-ray diffraction (XRD) and differential scanning calorimetry (DSC) showed that
compared to the DFs, the MDFs were smaller and had more exposed hydroxyl groups. Analysis of
the microrheological behaviors showed that the MDFs had higher viscosity than that of the DFs,
with a looser structure for the MSDF and a stable structure for the MIDF. Therefore, due to structural
changes, the physical and functional properties of the MDFs were improved compared to those of the
unmodified DFs. Pearson correlation analysis showed that the particle size was positively correlated
with the pectin content. The water holding capacity (WHC), oil adsorption capacity (OAC) and water
swelling capacity (WSC) showed positive correlations with each other. This work indicated that white
turnip could be a potential new source of DFs, which presented desirable functional properties after
modification.
The cultivation of turnip (Brassica Rapa L.) has a long history. As one kind of Cruciferae, turnip is adapted to
the adverse environments of the Qinghai-Tibetan Plateau and possesses feeding, edible, and pharmaceutical
value, which is highly appreciated as vegetable and traditional Chinese medicine1,2. In addition, it is consumed
in enormous quantities not only in Tibet, China, but also throughout the world due to its rich phytochemi-
cals, including glucosinolates, isothiocyanates, polysaccharides, triterpenoids, polyphenols and fl avonoids3,4.
Pharmacological investigation on turnip revealed the antitumor, antihypertensive, antidiabetic, antioxidant,
antiinflammatory, hepatoprotective, and nephroprotective e ffects4. Glucosinolates and isothiocyanates are the
main constituents for the protective effect against cancers, while, flavonoids and phenolics are corresponding
to the antioxidant e ffects4,5.
According to the USDA (United States Department of Agriculture) National Nutrient Database (2015), fresh
turnip contains 3.5% dietary fiber (DF)6. Traditionally, DF has been defined as the varieties of polysaccharide
and lignin in the diet that are indigestible by endogenous secretions in the digestive t ract7. DF is a mixture of cel-
lulose, hemicellulose, gums, lignin and pectin, and can be divided into soluble dietary fiber (SDF) and insoluble
1
College of Light Industry, Liaoning University, No. 66 Chongshan Middle Road, Huanggu District, Liaoning
Province, Shenyang 110036, People’s Republic of China. 2Department of Applied Biological Chemistry, Graduate
School of Agricultural and Life Sciences, The University of Tokyo, 1‑1‑1 Yayoi, Bunkyo‑ku, Tokyo 113‑8657,
Japan. 3Party School of Liaoning Provincial Party Committee, Shenyang 110161, People’s Republic of China. 4These
authors contributed equally: Qi Gao and Xue-jie Zhou. *email: amtanok@mail.ecc.u‑tokyo.ac.jp; xueyoulin@
lnu.edu.cn
Scientific Reports | (2021) 11:1024 | https://doi.org/10.1038/s41598-020-80410-1 1
Vol.:(0123456789)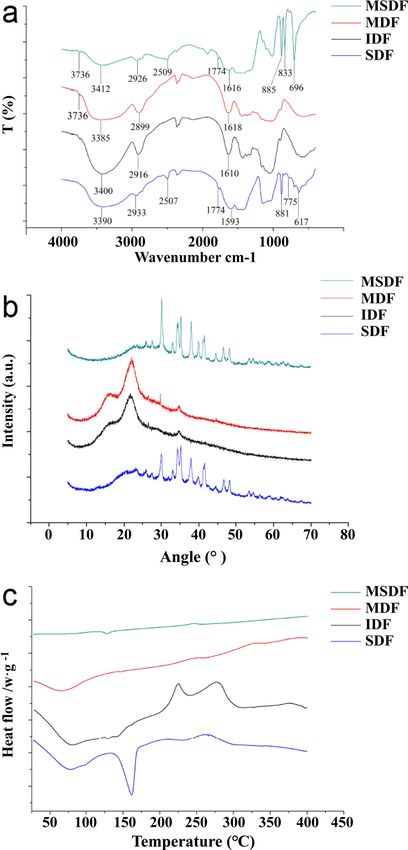
www.nature.com/scientificreports/
SDF MSDF IDF MIDF
Yield (%) 20.06 ± 1.77b 11.49 ± 2.50d 51.35 ± 1.89a 19.03 ± 1.99c
Pectin (g/100 g) 6.65 ± 0.50a 1.62 ± 0.35c 6.10 ± 0.65b 0.90 ± 0.42d
Polyphenol (g/100 g) 2.35 ± 0.33a 2.11 ± 0.12b 2.35 ± 0.30a 0.43 ± 0.21c
Protein (g/100 g) 1.70 ± 0.34a 1.72 ± 0.40a 1.05 ± 0.45b 0.97 ± 0.26c
L* 79.22d 98.92a 81.6c 90.27b
a* 8.42a − 0.02d 5.16b 3.47c
b* 20.85a 7.85d 19.02c 19.3b
E – 1.74b – 5.29a
WHC (g/g) – – 12.75 ± 0.01a 13.65 ± 0.01a
OAC (g/g) 3.29 ± 0.01b 3.71 ± 0.01a 2.29 ± 0.01d 2.41 ± 0.02c
WSC (mL/g) – – 5.67 ± 0.06a 5.97 ± 0.05a
Crystallinity (%) 34.19 ± 0.37a 14.84 ± 0.42c 6.76 ± 0.35d 18.71 ± 0.56b
Particle size (d, nm) 488.8 ± 25.73c 397.1 ± 47.99d 3961 ± 101.8a 2810 ± 68.59b
CAB (mg/g) 9.91 ± 0.36b 10.15 ± 0.75a 9.78 ± 0.53c 9.82 ± 0.61bc
Table 1. The yield, basic content, color, WHC, OAC, WSC, crystallinity, particle size, and CAB of DFs from
white turnip. Values are the means ± SD of triplicate determinations. The values with a–e indicate significant
differences in the same rows, P < 0.05. “−” represents not detected.
dietary fiber (IDF)8. DF has certain physical characteristics and physiological and bioactive properties, such as
capacity to form gels, fermentability, antioxidant activity, viscosity, and the ability to reduce the risk of colon
cancer, hypertension, coronary heart disease, diabetes, asthma and obesity, which can be readily applied to food
systems as a thickener, emulsifier, stabilizer, and fat r eplacer9,10.
Usually, DF can be modified by chemical, physical and biological approaches. Chemical modifications (e.g.
acid hydrolysis, oxidation, etherification, esterification and cross-linking) may change the DF component as
well as the physicochemical properties with extensive washing of material and generating polluent r esidues11.
Physical methods (e.g. high-pressure homogenization, blasting extrusion, ultrafine grinding, and micro-fluidi-
zation) improve the physico-chemical and functional properties of DF by decreasing particle size rather than by
increasing SDF c ontent12. Biological methods are expensive because they require purified enzymes (e.g. cellulose,
hemicellulase, xylanase, amylase, amyloglucosidase alcalase, pepsin, papain, and trypsin) or bacterial s trains13.
This study focused on the extraction of DFs from white turnips and promoting their functional properties
by chemical modification using alkaline hydrogen peroxide, which could react with hemicellulose and lignin to
form water-soluble molecules with lower molecular masses than those of the original molecules14. The structural
differences between DFs and modified DFs (MDFs) from white turnip were determined by particle size analysis,
scanning electron microscopy (SEM), Fourier transform infrared (FT-IR) spectroscopy, X-ray diffraction (XRD),
differential scanning calorimetry (DSC) and microrheological behavior analysis. Furthermore, the capacities of
water holding, water swelling, oil adsorption, cation exchange and cholesterol absorption of the samples were
also determined to explore the effects of the modification and the potential commercial value and health benefits.
Results and discussion
Basic components, color and granularity analysis. Alkaline hydrogen peroxide could modify the
structure of hemicellulose to increase the water solubility, resulting in many differences between the MDFs and
DFs15. The basic components of the DFs are shown in Table 1. The modification treatment resulted in a signifi-
cant reduction in the pectin content, and the MIDF had the lowest pectin content. For polyphenol, the content
decreased after modification, and that in MIDF was the lowest. The protein content of the DF samples was low,
and the lowest values were detected in IDF and MIDF. Based on the color measurements, MDFs were obvi-
ously whiter than DFs, and MSDF was the whitest, followed by MIDF, IDF and SDF, which was caused by the
bleaching effect of hydrogen p eroxide16. The results of particle size analysis showed that modification reduced
the particle size.
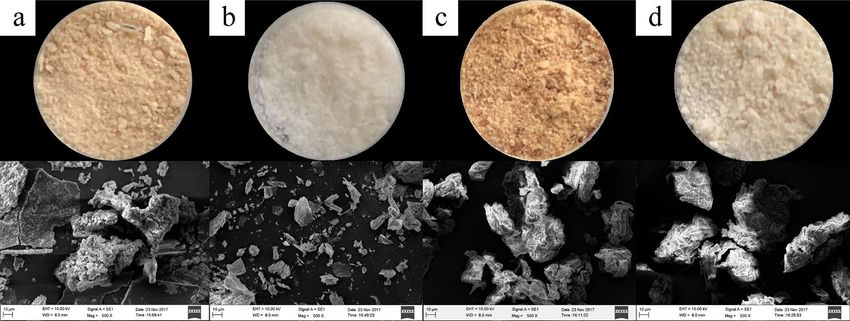
Structure analyses. SEM. As shown in Fig. 1. characteristic honeycomb structure was observed in IDF,
and more cracks and holes were detected in MIDF. The SDF particles were large with a rough surface, and a
sheet structure was observed. The MSDF particles were relatively smaller with a smoother surface. The micro-
structure of MDFs was structurally relaxed, and surface wrinkles and cavities were observed. These changes
indicated that the modification changed the structure, with some valleys and cracks formed, and the MSDFs
articles17. At the same time,
were smoother than the SDFs, which resulted in an increase in the number of fiber p
many heteropolysaccharides attached to the surface of the particles were detached, which increased the contact
area between the hydroxyl groups and the environment18.
FT‑IR. The functional groups and bonding information of the samples could be explained by the FT-IR
spectra17. The FT-IR results are shown in Fig. 2a; the broad peak appearing at 3400 to 3200 cm−1 is an O–H
stretching vibration derived from hydrogen-bonded alcohol or phenol18. The MSDF and MIDF showed char-
Scientific Reports | (2021) 11:1024 | https://doi.org/10.1038/s41598-020-80410-1 2
Vol:.(1234567890)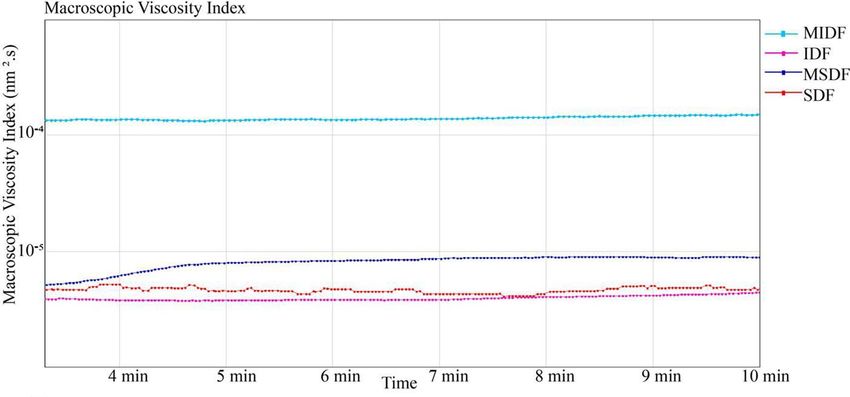
www.nature.com/scientificreports/
Figure 1. The powder and SEM images (500 ×) of (a) SDF, (b) MSDF, (c) IDF and (d) MIDF obtained from
white turnip.
acteristic peaks of free hydroxyl stretching vibrations at 3700–3500 cm−1, indicating that the content of free
hydroxyl groups was increased after alkaline hydrogen peroxide modification18.
A typical –CH2 stretching vibration was observed at approximately 2920 cm−1, and a δC–H vibration of –CH2
was observed at 1465 ± 20 cm−1. In the fingerprint region, the SDF had a relatively weak peak at 775 cm−1, but
this peak shifted to 833 cm−1 in MSDF, which indicated that the long chain of –CH2 groups was broken after the
modification and that the content of oligosaccharides was increased19. SDF and IDF presented a characteristic
absorption peak of the benzene ring at 1590–1620 cm−1, and the corresponding peaks were weakened in the
MSDF and MIDF samples, which indicated that the original DFs contain more lignin, pectin and h emicellulose20.
A C=O stretching vibration was observed in SDF at 1774 cm−1. The corresponding peak of the MSDF was
weakened, probably because the C=O groups, which are originally present in the fiber, were o xidized21.
XRD. Crystalline cellulose exhibits a sharp XRD peak, showing an extended crystal line and complete crystal
surface22. As shown in Fig. 2b, broad peaks at 12.5–28° were observed for IDF and MIDF, and the peak position
and width were not significantly different between IDF and MIDF, which indicated the ordered structure of the
crystalline region on the cellulose23. As shown in Table 1, the crystallinity of MSDF (14.84%) was lower than
that of SDF (34.19%), and the crystallinity of MIDF (18.71%) was higher than that of IDF (6.76%). According
to a previous report, DFs consist of crystalline regions and amorphous regions, and the amorphous regions are
composed of noncrystalline cellulose, hemicellulose, and lignin24. The amorphous regions of cellulose is easily
ydrolysis23. As a result, combined
destroyed, thus leading to increased relative ratio of crystalline cellulose after h
with the SEM results, the FT-IR results suggested that the modification damaged the amorphous regions of IDF
(Fig. 1), thus leading to the conversion of the amorphous regions into water-soluble c omponents25.
DSC. The exothermic peaks exhibited in the DSC curve illustrate the vaporization of volatile products and
the thermal and oxidative decomposition of polymers26. Figure 2c shows the thermal properties of the DFs. In
the first temperature range, 50–100 °C, an endothermic peak transition was observed with a maximal peak at
approximately 75 °C, which may correspond to the evaporation of unbound water and the phase transition of
pectin with sorbed water from crystalline to amorphous s tructure27. The 2nd endothermic transition of the DFs
occurred at approximately 150 °C, which could be explained by the evaporation of bound water in the original
DFs28. However, the intensity of the heat flow of DFs was significantly higher than that of MDFs, illustrating that
DFs possessed a higher content of bound water. The exothermal peak at 230 °C might correspond to the pyrolysis
peak of pectin29. The heat flow obtained from MDFs was lower than those from DFs, which was consistent with
the pectin content (Table 1). The exothermal peaks at approximately 300 °C were probably the pyrolysis peaks
of cellulose, hemicellulose or lignin30. For the MSDF, there is almost no peak after 300 °C, which corresponds to
the decreased crystallinity of the MSDF (XRD results). In addition, a higher heat flux strength indicates lower
thermal stability, which suggests that MDFs have higher thermal stabilities than D Fs31.
Physical properties. Water holding capacity (WHC), water swelling capacity (WSC) and oil adsorption ca‑
pacity (OAC). As shown in Table 1, the WHC and WSC of the MIDF increased slightly through modification,
which exposed hydroxyl groups in the IDF structure13. Second, the hydrolysis of some heteropolysaccharides
led to the exposure of more hydroxyl groups, allowing the accommodation of more water molecules. After the
modification, the OAC increased, and the OAC of the SDFs was significantly higher than that of the I DFs32. The
improvement of these properties indicated a good application prospect of MDFs in food processing.
Cation exchange capability. The curves in Fig. 3a show that practically complete exchange of hydrogen
ions occurs in 6 mL of 0.1 M NaOH. For the MSDF, the inflexion point was at 0.5–1.5 mL of NaOH. For the SDF,
the inflexion point was in 2–3.5 mL of NaOH. This change indicates that the MSDF has a higher cation exchange
Scientific Reports | (2021) 11:1024 | https://doi.org/10.1038/s41598-020-80410-1 3
Vol.:(0123456789)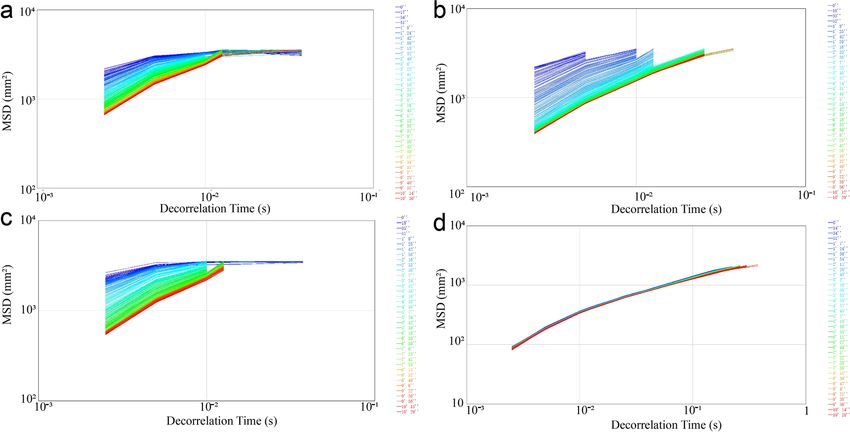
www.nature.com/scientificreports/
Figure 2. FTIR spectra (a), XRD measurements (b) and DSC analysis (c) of DFs from white turnip.
capacity than that of the SDF. The curves in Fig. 3b show that a practically complete reaction of hydrogen ions
occurs in 7 mL of 0.1 M NaOH. This change indicates that the IDF and MIDF showed delayed inflexion points.
In conclusion, SDF and MSDF have strong cation exchange capacity, which can effectively control the drastic
change in pH33.
Microrheological properties. Compared with measuring shear rheology, the Rheolaser Lab technique
does not modify the DF samples. The Brownian motion of droplets was monitored and interpreted in terms of
microrheology34. The motion of the samples was measured, and the interactions of the particles were traced by
microrheology, which were expressed as mean square displacements (MSDs) (Fig. 4). The MSD curves of the
SDF (Fig. 4a) and IDF (Fig. 4c) were similar. The MSD curve of the MSDF (Fig. 4b) was not linear, indicating that
MSDF had viscoelastic properties and that the droplets were free to move due to weak network interactions of
droplets35. As shown in Fig. 4d, the MSD curves of the MIDF was linear, indicating that the network interactions
of droplets was apparently structurally stable35. Therefore, Fig. 4a,b shows that the configuration of the MSDF
apparently was structurally relaxed, and Fig. 4c,d shows that the configuration of the MIDF was structurally
stablized. Alkaline hydrogen peroxide reacted with the IDF, which caused the loss of soluble fractions. Com-
Scientific Reports | (2021) 11:1024 | https://doi.org/10.1038/s41598-020-80410-1 4
Vol:.(1234567890)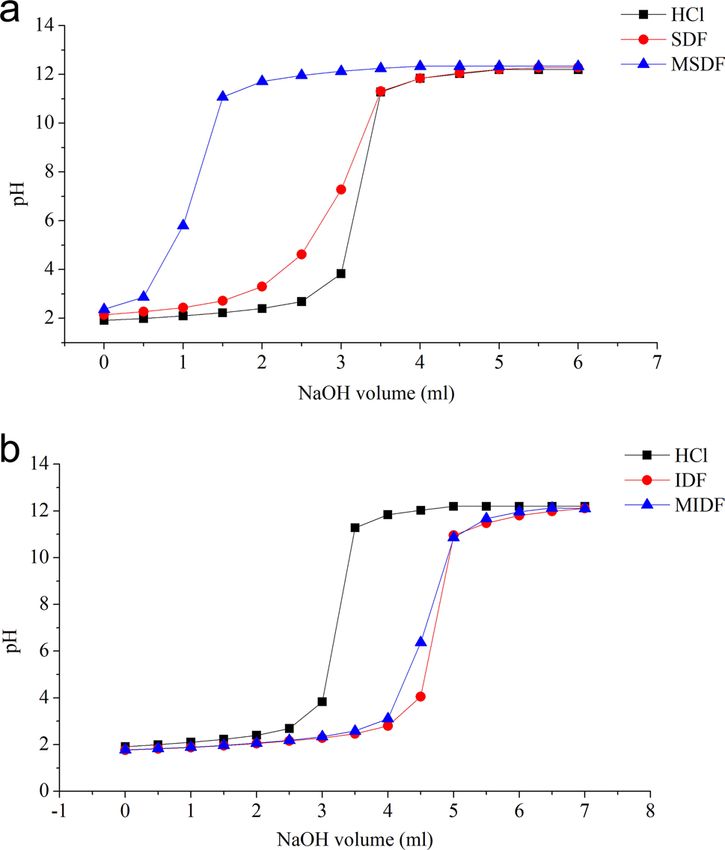
www.nature.com/scientificreports/
Figure 3. Cation exchange capability of (a) SDFs and (b) IDFs from white turnip.
Figure 4. MSD of SDF (a), MSDF (b), IDF (c) and MIDF (d) from white turnip.
bined with the SEM and FT-IR results, the MSDF had smaller particle sizes and more free hydroxyl groups with
relatively unstable structures compared to those of the other samples.
As shown in Fig. 5, the macroscopic viscosities of the DFs were represented by the macroscopic viscosity
index (MVI) values, which corresponds to the inverse of the speed of the particles for long t imes35. The viscosity
of the MIDF was the highest, followed by that of the MSDF, SDF, and IDF.
Due to the modification, the viscosity of MDFs increased. The peroxide-initiated free radicals reacted with the
hydroxyl groups of the fiber and the matrix, and good fiber matrix adhesion along the interface o ccurred21. First,
intermolecular hydrogen bond cleavage led to more exposure of polar groups in the molecule, and the charge on
the surface of the molecule increased, thereby enhancing the electrostatic interaction among the molecules, as
well as between the molecule and the solvent, and increasing the flow resistance of the solution. The increase in
Scientific Reports | (2021) 11:1024 | https://doi.org/10.1038/s41598-020-80410-1 5
Vol.:(0123456789)www.nature.com/scientificreports/
Figure 5. Macroscopic viscosity index of DFs from white turnip. The figure was generated by RheoSoft Master
1.4.0.0.
Figure 6. Possible mechanism for the better ability of MDFs to combine with water. The figure was generated
by RheoSoft Master 1.4.0.0.
molecular surface charge also thickened the solvation layer of the molecule, which led to further dilation of the
molecule and an increase in the viscosity of the solution29. Second, the modification treatment reduced the size
of the fiber particles and smoothed them, which increased the effective area of the fiber surface and resulted in
more particle interactions and an enhanced network structure with water molecules, resulting in a significant
increase in apparent viscosity36. The difference between the MIDF and MSDF was that the crystallinity of the
MIDF was higher and that its surface contained more valleys, fiber bundles and gullies (Fig. 1), which increased
the effective area of the fiber surface and led to a higher viscosity of the MIDF than of the MSDF37. For the SDF
and IDF, the former had a smaller particle size and higher crystallinity, which means a higher effective area of
the fiber surface and greater number of fiber bundles, resulting in the viscosity of the SDF being higher than
that of the IDF (Fig. 6).
Cholesterol absorption ability (CAB). As shown in Table 1, the MSDF (10.15 ± 0.75) had the strongest
CAB, the SDF (9.91 ± 0.36) performed better than the MIDF (9.82 ± 0.61), and the IDF (9.78 ± 0.53) showed the
lowest CAB. From the SEM images (Fig. 1), many valleys were cracked or breaked after the modification, which
resulted in the better CAB of the MDFs. The FT-IR results indicated that the SDF had more hydroxyl groups,
indicating that more cholesterol was combined and absorbed.
Correlation analysis among the various properties of DFs. Pearson coefficients were calculated for
the various properties of the DFs (Table 2). The pectin and polyphenol contents negatively correlated with the
WHC, and the WSC and particle size positively correlated with the pectin content. The modification could
destroy the cross-linked structures of polysaccharides from the cell wall and remove pectin, polyphenol and
other components, which brought about an increased relative content of cellulose and smaller particle size. The
SEM analysis indicated that the modification caused the breakage of the amorphous regions; thus, the crystal-
linities of the MDFs increased30. Therefore, the higher effective area of the fiber surface and the higher content
of cellulose led to a higher WHC and WSC14. The WHC, OAC and WSC showed a positive correlation with each
other, and the particle size showed a negative correlation with the WHC, OAC, and WSC, which indicated that
Scientific Reports | (2021) 11:1024 | https://doi.org/10.1038/s41598-020-80410-1 6
Vol:.(1234567890)www.nature.com/scientificreports/
Yield Pectin Polyphenol Protein L* a* b* E WHC OAC WSC Crystallinity
Pectin 0.591*
Polyphenol 0.310 0.732*
Protein − 0.576* 0.190 0.581*
L* − 0.601* − 0.873* − 0.310 0.151
a* 0.354 0.812** 0.248 0.020 − 0.96**
b* 0.457 0.538 − 0.178 − 0.439 − 0.880** 0.873**
E 1.000** − 0.985** − 0.999** − 0.999** − 1.000** 1.000** 1.000**
WHC − 0.999** − 1.000** − 0.999** − 0.741 1.000** − 1.000** 1.000** 0
OAC − 0.716** − 0.102 0.427 0.949** 0.447 − 0.277 − 0.667* − 1.000* 1.000**
WSC − 0.999** − 1.000** − 0.999** − 0.741 1.000** 1.000** 1.000** 0 1.000** 1.000**
Crystallinity − 0.554 0.244 0.02 0.578* − 0.329 0.579* 0.342 1.000** 1.000** 0.43 1.000**
Particle size 0.609* 0.759** 0.116 − 0.320 − 0.979** 0.934** 0.954** 1.000** − 0.998** − 0.593* − 0.998** 0.284
Table 2. Pearson correlation coefficients among different properties of DFs from turnip. *P ≤ 0.05; **P ≤ 0.01.
a smaller particle size led to a higher WHC, WSC and OAC. The FT-IR results indicated that intramolecular
hydrogen bonding interactions were broken and that the content of oligosaccharides was increased30. The MDFs
showed weaker water evaporation peaks in the DSC curves and exhibited better microrheological properties
than those of the DFs, with the properties correlated with the WSC and WHC. These results revealed that com-
pared to unmodified DFs, the MDFs exhibited modified structures, crystallinity regions, and functional groups
with better performance in terms of functional p roperties13. Therefore, these MDFs have potential applications
in food and health products as functional ingredients.
Conclusion
In conclusion, this study revealed changes in the compositional, structural, and functional properties of DFs. The
SEM, FT-IR, XRD and DSC results showed that compared to the unmodified DFs, the MDFs had decreased par-
ticle sizes and more exposed functional groups that influenced their functional properties, such as •OH groups.
The microrheological properties of the DFs showed that the MSDF network was structurally relaxed and that the
MIDF network was structurally stable, which was verified by the structure analyses. Overall, our research sug-
gests that turnip could be a good source of DFs and that MDFs have wider application prospects in food systems.
Materials and methods
Materials. White turnips were obtained from the Daliangshan region of Sichuan Province. The turnips
were washed under running water and then sliced and immersed in 1.5% sodium chloride and 0.2% citric acid
solution for 20 min. Next, the slices were put into a dry oven (GZX-9076MBE, Shanghai Boxun Industry &
Commerce Co., Ltd., Shanghai, China) and dried at 60 °C. The dried slices were powdered by a pulverizer (SZ-
500A-3, Yongkang Shanzhu Trading Co., Ltd., Zhejiang, China) and then sieved through an 80 mm sieve.
Reagents. Mesophilic amylase (enzyme activity ≥ 100,000 U/g solid powder) was obtained from Jiangsu
Ruiyang Biotechnology Co., Ltd., Suzhou, China. All reagents used in this work were of analytical reagent grade
unless otherwise stated.
Extraction of DFs. Turnip powders (20 g) were mixed with distilled water (1:4), and the pH was adjusted to
5.4 by using 5 mol/L NaOH. Then, mesophilic amylase (0.3%) was added to remove starch in a 65 °C water bath
with stirring for 1 h. Next, the exact solution was mixed with 100 ml of 7% NaOH in a 65 °C water bath with
continuous stirring for 45 min to remove protein. The mixture was centrifuged at 6000 rpm for 20 min (TG16G
Changsha Yingtai Instrument Co., Ltd., Changsha, China). The obtained precipitate was first washed with dis-
tilled water and 95% ethanol, dried at 40 °C in a drying oven and then pulverized to obtain the IDF powder.
For the supernatant, 4 volumes of 95% ethanol were added with gentle stirring, and then, the mixture was left
overnight to precipitate SDF. The precipitate, which was obtained after filtering, was redissolved in distilled water
(1:1) and then was lyophilized (SCIENTZ-10N Xinzhi Biotechnology Co., Ltd., Ningbo, China). The obtained
powder was weighed to calculate the yield of SDF. The yields were calculated as follows:
The yield of SDF (%) = the weight of dried SDF g /the weight of dried turnip powder g × 100%
The yield of IDF (%) = the weight of dried IDF g /the weight of dried turnip powder g × 100%
Modification of IDF (Fig. 6). IDF was modified to obtain the MIDF and M SDF38. IDF was soaked in 10%
H2O2 (pH 11.5) with a solid–liquid ratio of 1:20 (g/mL) under ultrasound sonication at 200 W and 40 °C for 2 h
(TH-400 BQ, Jining Tianhua Ultrasonic Electronic Instrument Co., Ltd., Shandong, China). Then, the mixture
was centrifuged at 6000 rpm for 20 min. The obtained precipitate was then washed with distilled water and 95%
Scientific Reports | (2021) 11:1024 | https://doi.org/10.1038/s41598-020-80410-1 7
Vol.:(0123456789)www.nature.com/scientificreports/
ethanol and dried at 60 °C to obtain the MIDF. The supernatant was precipitated with 4 volumes of 95% ethanol
and left overnight. The precipitate was then lyophilized to obtain the MSDF. The yields were calculated as follows:
The yield of MSDF(%) = the weight of dried MSDF g /the weight of dried turnip powder g × 100%
The yield of MIDF(%) = the weight of dried MIDF g /the weight of dried turnip powder g × 100%
Basic composition and granularity analysis. The moisture (method 925.09), protein (method 955.04)
ethods39. The pectin content was measured
and ash (method 942.05) contents were measured by AOAC official m
by the carbazole colorimetric method. The polyphenol content was determined by the Folin–Ciocalteu method.
The average particle sizes of the DF samples were measured by a laser particle size analyzer (Nano ZS90,
Malvern Instruments Ltd., England).
Structure analyses. SEM. The microstructure of DFs was observed by a Zeiss EVO10 field emission
scanning electron microscope (JSM-5610LV, JEOL, Japan). The dehydrated samples were placed on a metal
stage and coated with a 10 nm gold layer.
FT‑IR. DF was mixed with spectroscopic grade potassium bromide (KBr) powder and then pelletized to 1 mm.
Four different DF samples were measured by a Fourier transform infrared spectrophotometer (FT/IR3000,
Jusco, Japan) to obtain the FT-IR spectra from 400 to 4000 cm−1.
XRD. X-ray diffractometry was performed on a Bruker D8 Advance X-ray diffractometer (Bruker, AXS, Ger-
many) with Cu radiation at 40 kV and an incident current of 30 mA. The angular region ranging from 5° to 70°
was scanned with a step length of 0.02° and a step rate of 0.2 s/step. The degree of crystallinity was calculated
using the MDI Jade 5.0 software (Materials Data, Inc., California, USA)13.
DSC. The thermal properties of DFs were analyzed using a differential scanning calorimeter (DSC1, Mettler
Toledo, USA). A sample (5–10 mg) was placed into an aluminum pan and immediately covered with a alu-
minum cover. The calorimeter was calibrated using indium with an empty aluminum pan used as a reference.
The sample pans were heated from 25 °C to 400 °C at a rate of 10 °C/min30.
Physical properties. Color measurement. The color characteristics (L*, a* and b*) of DFs were deter-
mined using a colorimeter (NR20XE, 3nh Co., China), and the results were expressed in terms of the CIELAB
system.
WHC. The WHC of DF was measured by the method of Sowbhagya et al. (2007)40. DF (IDF and MIDF) pow-
der (0.04 g) was hydrated in 3 mL of distilled water at 25 °C for 2 h and then centrifuged at 3000 rpm for 20 min.
Then, the fresh weight of the residue was recorded. The WHC was calculated by the following equation:
WHC g/g = (mf − m)/m
where mf is the weight of the fresh residue (g) and m is the dry weight of the sample powder (g).
WSC. The WSC was calculated by the method of Sowbhagya et al. (2007) with some modifications40. DF (IDF
and MIDF) powder (0.2 g) was hydrated in 10 mL of distilled water in a graduated test tube at 25 °C for 24 h. The
volume of DFs was recorded, and the WSC was calculated by the following equation:
WSC mL/g = (v1 − v0 )/w0
where v1 is the volume of the hydrated DF, v0 is the volume of the DF before hydration, and w0 is the weight of
the DF before hydration.
OAC. The OAC was calculated by the method of Abdul-Hamid and Luan (2000) with some m odifications41.
DF (IDF, SDF, MIDF and MSDF) powder (0.12 g) was mixed with 3 mL of soya bean oil for 1 h at 37 °C. The
mixture was centrifuged at 3000 rpm for 20 min. The OAC was determined based on the amount of soya bean
oil retained by the DF:
OAC g/g = (mr −m) × 100/m
where mr is the residue weight, which contained the oil (g), and m is the original weight of the DF (g).
Cation exchange capability. The cation exchange capability was calculated by the method of Chau and Huang
(2003) with slight modifications33. DF (IDF, SDF, MIDF and MSDF) powder (0.3 g) was dissolved in 30 mL of
0.01 mol/L HCl and was refrigerated at 4 °C overnight, which was set as the control group. After the temperature
reached 25 °C, 0.5 mL of 0.1 mol/L NaOH was added to the mixture to achieve complete cation exchange, and
the pH change of the solution was recorded.
Scientific Reports | (2021) 11:1024 | https://doi.org/10.1038/s41598-020-80410-1 8
Vol:.(1234567890)www.nature.com/scientificreports/
Microrheological behavior. A commercial Rheolaser Master (Formulation, I’Union, France), which was based
on diffusing-wave spectroscopy (DWS), was used for measuring the microrheology of the DFs. This technique
is similar to dynamic light scattering and measures the Brownian motion of particles, which depends on the
viscoelastic structure of the sample. Aqueous solutions of 40% (w/v) SDF and MSDF and 5% (w/v) suspensions
of IDF and MIDF were measured at 25 °C. The instrument measures Brownian motion of the particle as the
droplet mean square displacement (MSD) versus time. MVI parameters of the samples were obtained with the
software RheoSoft Master 1.4.0.035.
CAB. The cholesterol absorption abilities of the samples were determined according to a previous s tudy3. First,
a 0.5 g sample (IDF or MIDF) or 0.1 g sample (SDF or MSDF) was dissolved in 25 mL of 1 mg/mL choles-
terol solution. The reaction mixture was incubated in a water bath at 37 °C for 2 h, followed by centrifugation
(4000 × g for 20 min). Then, the cholesterol content of 0.1 mL of supernatant was tested by the phthalic aldehyde
method at 550 nm.
Statistical analyses. Each experiment was carried out in triplicate, and the data are expressed as the
mean ± standard deviation (SD). Pearson correlation coefficients (r) were calculated for the various physico-
chemical properties, and the least significant difference (LSD) test was compared by SPSS 10.0 software; P < 0.05
was considered statistically significant.
Received: 2 May 2020; Accepted: 15 December 2020
References
1. Liang, Y. S. et al. Identification of phenylpropanoids in methyl jasmonate treated Brassica rapa leaves using two-dimensional
nuclear magnetic resonance spectroscopy. J. Chromatogr. A 1112, 148–155 (2006).
2. Fernandes, F. et al. Chemical and antioxidative assessment of dietary turnip (Brassica rapavar. rapa L.). Food Chem. 105, 1003–1010
(2007).
3. Xie, Y. et al. Composition analysis and anti-hypoxia activity of polysaccharide from Brassica rapa L. Int. J. Biol. Macromol. 47,
528–533 (2010).
4. Paul, S., Geng, C.-A., Yang, T.-H., Yang, Y.-P. & Chen, J.-J. Phytochemical and health-beneficial progress of turnip (Brassica rapa):
health beneficial progress of turnip. J. Food Sci. 84, 19–30 (2019).
5. Arora, R., Arora, S. & Vig, A. P. Development of validated hightemperaturereverse-phase UHPLC-PDA analytical method for
simultaneous analysis offive natural isothiocyanates in cruciferous vegetables. Food Chem. 239, 1805–1089 (2018).
6. USDA National Nutrient Database for Standard Reference Release 1 April, 2018 Full Report (All Nutrients) February 25, 23:11
EST. https://fdc.nal.usda.gov/fdc-app.html#/food-details/170466/nutrients (2019).
7. Trowell, H. et al. Dietary fibre redefined. The Lancet 307, 967 (1976).
8. Arora, S. K., Patel, A. A., Kumar, N. & Chauhan, O. P. Determination of relationship between sensory viscosity rating and instru-
mental flow behavior of soluble dietary fibers. J. Food Sci. Technol. 53, 2067–2076 (2016).
9. Chen, J. et al. Physicochemical and functional properties of dietary fiber from maca (Lepidium meyenii Walp.) liquor residue.
Carbohyd. Polym. 132, 509–512 (2015).
10. Sozer, N., Cicerelli, L., Heiniö, R. L. & Poutanen, K. Effect of wheat bran addition on in vitro starch digestibility, physico-mechanical
and sensory properties of biscuits. J. Cereal Sci. 60, 105–113 (2014).
11. Park, K. H., Lee, K. Y. & Lee, H. G. Chemical composition and physicochemical properties of barley dietary fiber by chemical
modification. Int. J. Biol. Macromol. 60, 360–365 (2013).
12. Ma, M. M. & Mu, T. H. Modification of deoiled cumin dietary fiber with laccase and cellulaseunder high hydrostatic pressure.
Carbohyd. Polym. 136, 87–94 (2016).
13. Ma, M. M. & Mu, T. H. Effects of extraction methods and particle size distribution on the structural, physicochemical, and func-
tional properties of dietary fiber from deoiled cumin. Food Chem. 194, 237–246 (2016).
14. Maes, C. & Delcour, J. A. Alkaline hydrogen peroxide extraction of wheat bran non-starch polysaccharides. J. Cereal Sci. 34, 29–35
(2001).
15. Sangnark, A. & Noomhorm, A. Chemical, physical and baking properties of dietary fiber prepared from rice straw. Food Res. Int.
37, 66–74 (2004).
16. Abegunde, O. K., Mu, T. H., Chen, J. W. & Deng, F. M. Physicochemical characterization of sweet potato starches popularly used
in Chinese starch industry. Food Hydrocolloids 33, 169–177 (2013).
17. Li, N., Feng, Z., Niu, Y. & Yu, L. Structural, rheological and functional properties of modified soluble dietary fiber from tomato
peels. Food Hydrocolloids 77, 557–565 (2018).
18. Liu, L., Chen, H. & Pan, D. Modification of polyacrylonitrile precursor fiber with hydrogen peroxide. Fibers Polymers 13, 587–592
(2012).
19. Hussein, A. O., Mohammed, G. J., Hadi, M. Y. & Hameed, I. H. Phytochemical screening of methanolic dried galls extract of
Quercus infectoria using gas chromatography-mass spectrometry (GC-MS) and Fourier transform-infrared (FT-IR). J. Pharma‑
cogn. Phytotherapy 8, 49–59 (2016).
20. Fung, W. Y., Yuen, K. H. & Liong, M. T. Agrowaste-based nanofibers as a probiotic encapsulant: fabrication and characterization.
J. Agric. Food Chem. 59, 8140–8147 (2011).
21. Kabir, M. M., Wang, H., Lau, K. T. & Cardona, F. Chemical treatments on plant-based natural fibre reinforced polymer composites:
an overview. Compos. B Eng. 43, 2883–2892 (2012).
22. Cleven, R., van den Berg, C. & van der Plas, L. Crystal structure of hydrated potato starch. Starch-Stärke 30, 223–228 (1978).
23. Nyman, E. M. G. L. & Svanberg, S. M. Modification of physicochemical properties of dietary fibre in carrots by mono-and divalent
cations. Food Chem. 76, 273–280 (2002).
24. Zhao, X. et al. Surface characterization of corn stalk superfine powder studied by FTIR and XRD. Colloids Surf., B 104, 207–212
(2013).
25. Alfred, D., Cintron, M. S. & Santiago, M. Cellulose polymorphy, crystallite size, and the segal crystallinity index. Cellulose 20,
583–588 (2013).
26. Mudgil, D., Barak, S. & Khatkar, B. S. X-ray diffraction, IR spectroscopy and thermal characterization of partially hydrolyzed guar
gum. Int. J. Biol. Macromol. 50, 1035–1039 (2012).
27. Slavov, A., Panchev, I., Kovacheva, D. & Vasileva, I. Physico-chemical characterization of water-soluble pectic extracts from rosa
damascena, calendula officinalis, and matricaria chamomilla wastes. Food Hydrocolloids 61, 469–476 (2016).
Scientific Reports | (2021) 11:1024 | https://doi.org/10.1038/s41598-020-80410-1 9
Vol.:(0123456789)www.nature.com/scientificreports/
28. Zhang, W. et al. Properties of soluble dietary fiber-polysaccharide from papaya peel obtained through alkaline or ultrasound-
assisted alkaline extraction. Carbohyd. Polym. 172, 102–112 (2017).
29. Wang, L., Yuan, F., Xiang, J. & Gao, Y. Functional properties and rheology of soluble dietary fiber from citrus slag. Chin. J. Food
Sci. 3, 24–31 (2015) ((in Chinese)).
30. Wen, Y., Niu, M., Zhang, B., Zhao, S. & Xiong, S. Structural characteristics and functional properties of rice bran dietary fiber
modified by enzymatic and enzyme-micronization treatments. LWT-Food Sci. Technol. 75, 344–351 (2017).
31. Osorio, C., Carriazo, J. G. & Barbosa, H. Thermal and structural study of guava (Psidium guajava L.) powders obtained by two
dehydration methods. Química Nova 34, 636–640 (2011).
32. Yang, C., Wang, Y. & Chen, L. Fabrication, characterization and controlled release properties of oat protein gels with percolating
structure induced by cold gelation. Food Hydrocolloids 62, 21–34 (2017).
33. Chau, C. F. & Huang, Y. L. Comparison of the chemical composition and physicochemical properties of different fibers prepared
from the peel of Citrus sinensis L. Cv. Liucheng. J. Agric. Food Chem. 51, 2615–2618 (2003).
34. Corredig, M. & Alexander, M. Food emulsions studied by DWS: recent advances. Trends Food Sci. Technol. 19, 67–75 (2008).
35. Xu, D., Aihemaiti, Z., Cao, Y., Teng, C. & Li, X. Physicochemical stability, microrheological properties and microstructure of lutein
emulsions stabilized by multilayer membranes consisting of whey protein isolate, flaxseed gum and chitosan. Food Chem. 202,
156–164 (2016).
36. Cardoso, M. A. P. et al. Oat fibers modification by reactive extrusion with alkaline hydrogen peroxide. Polímeros 26, 320–326
(2016).
37. Sébastienn, R. et al. Development of gelling properties of inulin by microfluidization. Food Hydrocolloids 24, 318–324 (2010).
38. Wang, H. O. et al. Treatment with hydrogen peroxide improves the physicochemical properties of dietary fibres from Chinese yam
peel. Int. J. Food Sci. Technol. https://doi.org/10.1111/ijfs.14405 (2019).
39. AOAC. Official Methods of Analysis (Association of Official Analytical Chemists, Washington, DC, 2000).
40. Sowbhagya, H. B., Suma, P. F., Mahadevamma, S. & Tharanathan, R. N. Spent residue from cumin—a potential source of dietary
fiber. Food Chem. 104, 1220–1225 (2007).
41. Abdul-Hamid, A. & Luan, Y. S. Functional properties of dietary fibre prepared from defatted rice bran. Food Chem. 68, 15–19
(2000).
Acknowledgements
This work was supported by the National Natural Science Foundation of China (31201285), the China Postdoc-
toral Science Foundation (2017M611752), the Liaoning Revitalization Talents Program (XLYC1807270), the
Science and Technology Support Program from Shenyang City (17136800) and the College Student Innovation
and Entrepreneurship Development Program of Liaoning University (X201810140247).
Author contributions
Y. X. and M. T. designed and supervised the project. Q. G., X. Z., R. M. and H. L. conducted the experiments,
analyzed the results, and drafted the manuscript. J. W., X. P. and Y. X. revised the manuscript.
Competing interests
The authors declare no competing interests.
Additional information
Correspondence and requests for materials should be addressed to M.T. or Y.X.
Reprints and permissions information is available at www.nature.com/reprints.
Publisher’s note Springer Nature remains neutral with regard to jurisdictional claims in published maps and
institutional affiliations.
Open Access This article is licensed under a Creative Commons Attribution 4.0 International
License, which permits use, sharing, adaptation, distribution and reproduction in any medium or
format, as long as you give appropriate credit to the original author(s) and the source, provide a link to the
Creative Commons licence, and indicate if changes were made. The images or other third party material in this
article are included in the article’s Creative Commons licence, unless indicated otherwise in a credit line to the
material. If material is not included in the article’s Creative Commons licence and your intended use is not
permitted by statutory regulation or exceeds the permitted use, you will need to obtain permission directly from
the copyright holder. To view a copy of this licence, visit http://creativecommons.org/licenses/by/4.0/.
© The Author(s) 2021
Scientific Reports | (2021) 11:1024 | https://doi.org/10.1038/s41598-020-80410-1 10
Vol:.(1234567890)You can also read