Gas in Spain: Still Oversupplied and Overcompensated
←
→
Page content transcription
If your browser does not render page correctly, please read the page content below
Ana Maria Jaller-Makarewicz, Energy Analyst, Europe                                         1
September 2022

Gas in Spain: Still Oversupplied and
Overcompensated
Regulation Continues to Guarantee a Secure
Return on Gas Infrastructure Investment
Executive Summary
The profits of Spanish gas Transmission System Operator (TSO) Enagás (Empresa
Nacional de Gas) have been driven in recent years not by consumer gas demand, but
by a regulatory system that guarantees a fixed rate of return on the company’s gas
infrastructure investments—regardless of whether the country needs the
investments.1

Over the years, Enagás has used “security and diversity of supply” as an excuse for
building out or expanding liquefied natural gas (LNG) regasification terminals,
natural gas pipelines, and gas storage facilities. However, these investments resulted
in very low utilisation rates for gas assets, as well as some of the highest gas bills in
Europe. Gas demand in Spain has declined since 2008, but Spanish consumers are
still burdened with incredibly high rates for unused infrastructure.

In 2019, new regulations were introduced for
the first time by an independent Spanish
regulator (Comisión Nacional de los Mercados              The regulatory system
y la Competencia, or CNMC). However, the                    guarantees rate of
latest financial information shows the
regulations have not resulted in any material                 returns on gas
reduction to Enagás’ remuneration. This                       infrastructure
means the company can continue to                        investments—regardless
overinvest at the expense of consumers and to
the benefit of its shareholders for the next                  of their need.
four years, until the regulations are reviewed.

In July 2022, Enagás presented its 2022-30 strategic plan, which aims to address
“security of supply and decarbonisation” in Spain and Europe and to reflect the most
pressing challenges in the European and global energy market. The company plans
to invest €2.8 billion by 2030. The investment would increase to €4.8 billion euros
with the inclusion of interconnection projects set out under the REPowerEU plan.

All of the investments will have a guaranteed regulated return. Spain has a stable
regulatory framework covering the years 2022-26. After 2026, a new regulatory
framework for hydrogen is expected, and Enagás is actively working to promote the
integration of electricity, gas, and hydrogen networks. If the framework is approved

1Institute for Energy Economics and Financial Analysis. Gas in Spain: Oversupplied and
Overcompensated. September 2021.
Gas in Spain: Still Oversupplied and Overcompensated                                              2

by the regulatory body, the company and its shareholders will receive guaranteed
regulated revenues for investing in infrastructure that has huge technical and
economic uncertainty, while consumers will be forced to carry the risk. 2

2Enagás. Enagás will invest 2,775 million euros in security of supply and decarbonisation up to
2030. 12 July 2022.
Gas in Spain: Still Oversupplied and Overcompensated                                                                                              3

 Table of Contents
 Executive Summary ............................................................................................................... 1
 Spain’s Gas Demand Has Been Declining ...................................................................... 4
 Spain’s LNG Terminals and Gas Interconnections .................................................... 5
 Regulatory Frameworks ....................................................................................................11
 Decarbonisation and Security of Supply Are the New Investment
 Rationale ..................................................................................................................................18
 Conclusion ...............................................................................................................................19
 About the Author ..................................................................................................................20
Gas in Spain: Still Oversupplied and Overcompensated                                                                                                 4

Spain’s Gas Demand Has Been Declining
But Gas Prices Have Stayed High for Spanish Households
Spanish gas demand peaked at 40.6 billion cubic meters (bcm) in 2008, and has
since declined annually. The majority of the demand is for conventional use
(including commercial, households, and industry sectors), while power generation
accounts for 25% to 30% of total consumption.

Figure 1: Evolution of Annual Natural Gas Demand in Spain (bcm)
          45.0

                                               0.8
          40.0
                               0.8       0.9          0.9      1.0                                                              1.0
          35.0          0.9                                                                                                                   1.2
                                                                      1.1    1.2                                                       1.1
                                                                                                                  0.9    0.9
                                                                                      1.0
          30.0   1.0                                                                                       0.9
                                                                                                    0.9
                                                                                             1.0
                                                                             7.7                                         5.6    10.1          8.1
          25.0                                                                        5.1                         6.9                  7.9
                        10.9                                   12.1   9.7                                  5.4
                 6.6                           17.5                                          4.7    5.5
    bcm

                               14.2     14.4          14.2
          20.0

          15.0

          10.0

           5.0

                 21.7   22.9   21.3     21.7   22.3   21.2     23.1   22.8   24.3     24.2   21.8   22.1   22.8   24.0   25.0   24.9   23.5   24.6
            -
                 2004   2005   2006     2007   2008   2009    2010    2011   2012   2013     2014   2015   2016   2017   2018   2019   2020   2021

                                      Conventional           Electricity Generation          LNG for Direct Consumption

Source: BP, CORES, IEEFA.

Spain has among the highest gas prices for household consumers in Europe.3 During
the second semester of 2019, Spain had the highest gas price in Europe with 0.0783
euros per kilowatt-hour (€/kWh), rising to 0.0849 €/kWh in the second semester of
2021.

3Household consumers are medium-sized consumers with an annual consumption between 20
gigajoules (GJ) and 200 GJ.
Gas in Spain: Still Oversupplied and Overcompensated 5
Figure
0.16
2: Gas Prices for Household Consumers in Europe (€/kWh)
0.14
0.12
0.1
EURO/KWh
0.08
0.06
0.04
0.02
0
2017-S1 2017-S2 2018-S1 2018-S2 2019-S1 2019-S2 2020-S1 2020-S2 2021-S1 2021-S2
Sweden Greece Spain Italy Denmark Bulgaria Ireland
Source: Eurostat.
Spain’s LNG Terminals and Gas Interconnections
LNG Terminals Have Been Consistently Overbuilt and
Underutilised
The Spanish market's gas consumption relies mainly on imports from its
international pipeline connection with Africa, as well as its own LNG terminals.
Interconnections with France and Portugal are gas pipelines that allow bidirectional
flows.
Taking into consideration Spanish gas demand and exports to neighbouring
countries, the utilisation rate of the import gas pipelines and LNG terminals
between 2015 and 2020 averaged 37%.Gas in Spain: Still Oversupplied and Overcompensated 6
Figure 3: Spanish Gas and LNG Capacities
100 50%
90 87.375 87.4 87.4 87.4 87.4 87.4 45%
43%
40%
80 38% 40%
35%
70 33% 33% 35%
Utilisation Rate
bcm per annum
60 30%
50 25%
38
40 35 20%
33
31
29 29
30 15%
20 10%
10 5%
0 0%
2015 2016 2017 2018 2019 2020
Pipeline and LNG Installed Capacities (excl El Musel) Spain Gas Imports Utilisation Rate %
Source: BP Statistical Reviews, CORES, IEEFA calculations.
Spain has seven LNG import terminals; six are operational and one is mothballed
(Planta Del Musel).
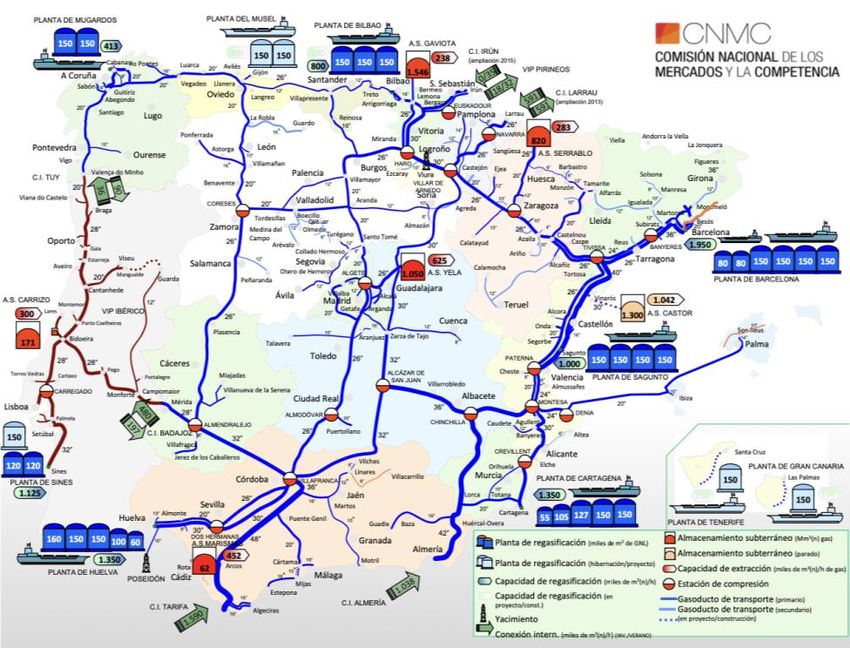
Figure 4: Spanish Gas/LNG System
Source: The Spanish National Markets and Competition Commission. General Overview of Spanish
LNG Sector. November 27, 2018.Gas in Spain: Still Oversupplied and Overcompensated 7
Enagás S.A., a Spanish gas transmission system operator (TSO), is among the biggest
owners of LNG terminals in the world.4 Enagás owns the LNG import terminals of
Barcelona, Huelva, and Cartagena, 70% of Bilbao, and 72.5% of Sagunto. The
company operates all five terminals.
The mothballed El Musel LNG Terminal, located in Gijon (Asturias), was completed
in 2013 and was immediately mothballed because of lack of demand. However,
Enagá s has been receiving an income to maintain the plant so that it is ready to be
brought into service if required.5 During the 2015-20 regulatory period, Enagás
Transporte, S.A.U. received €23.6 million annually. In the current regulatory period
(2021-26), the revenue allowed was increased to €24.9 million per year. On June 28,
2022, Enagás obtained the administrative authorization resolution for the startup of
the terminal.6
Table 1: LNG Regasification Terminals in Spain
Start LNG Storage Send-out Capacity
Terminal Operator Owners
Year m3 LNG BCM/yr GWh/d
Barcelona 1969 Enagás Enagás 100% 760,000 17.1 544
Huelva 1988 Enagás Enagás 100% 619,000 11.8 377
Cartagena 1989 Enagás Enagás 100% 587,000 11.8 377
Bilbao 2003 Enagás Enagás 70%, EVE 30% 450,000 8.8 223
Sagunto 2006 Enagás Enagás 72.5%, Osaka Gas 20%, Oman Oil 7.5% 600,000 8.8 279
Mugardos (El Ferrol) 2007 Reganosa Grupo Tojeiro 50.36%, Gobierno Galicia 24.64%, 300,000 3.6 115
First State Regasificador 15%, Sonatrach 10%
Total 3,316,000 61.9 1,915
El Musel 2013 Enagás 100% 7.0
(mothballed)
Total with El Musel (BCM) 68.9
60.24
Of which owned by Enagás
87.4%
Source: BP Statistical Reviews, CORES, IEEFA calculations.
The operating LNG terminals in Spain account for almost one-third of Europe’s LNG
import capacity,7 but they have some of the lowest utilisation rates on the continent.
The utilisation rate of installed LNG capacity has averaged just 34% over the last 15
years; it dropped as low as 22% in 2015 and 23% in 2016.
4 Enagás. Our regasification terminals.
5 Enagá s Financiaciones, S.A.U. Guaranteed Euro Medium Term Note Programme Guaranteed by
Enagás S.A. May 28, 2021.
6 Enagás. Our regasification terminals.
7 Global LNG Hub. LNG in Europe 2020. December 2020.Gas in Spain: Still Oversupplied and Overcompensated 8
Figure 5: Spanish Annual LNG Imports, Installed Capacity and Utilisation
Rate
70 60%
60
49% 50%
45% 45%
Billion cubic meters per annum (bcma)
50 42% 44%
40%
39%
36%
40 33%
34% 34%
30%
26% 27%
30
26% 23%
25%
22% 20%
20
10%
10
0 0%
2006 2007 2008 2009 2010 2011 2012 2013 2014 2015 2016 2017 2018 2019 2020 2021
Imported LNG LNG Terminals Capacity Utlisation Rate (%)
Sources: CORES, BP, IEEFA, IH.
Note: Installed capacity does not include the mothballed El Musel terminal (7 bcm annual capacity).
Between January 2019 and June 2022, the utilisation rate of the LNG terminals never
exceeded 56%, despite the increase in imported volumes.
Figure 6: Spanish Monthly LNG Imports and Installed Capacity
6 60%
5 50%
4 40%
bcm per month
Utilisation Rate
3 30%
2 20%
1 10%
- 0%
19 9 9 9 9 9 0 0 0 0 0 0 1 1 1 1 1 1 2 2 2
n- -1 y-1 l-1 p -1 v -1 n -2 ar-2 y-2 u l-2 p -2 v -2 n -2 ar-2 y-2 u l-2 p -2 v -2 n -2 ar-2 y-2
ar a Ju a a a
Ja M M Se No Ja M M
J Se No Ja M M
J Se No Ja M M
Import LNG LNG Terminals Capacity Utilisation Rate
Source: IHS Markit, IEEFA calculations.
Note: Installed capacity does not include the mothballed El Musel terminal.Gas in Spain: Still Oversupplied and Overcompensated 9
LNG imports increased in 2022, but the LNG terminals still have plenty of available
capacity. The Barcelona LNG Terminal, the biggest regasification plant in Spain,
reached a 41% utilisation rate in January 2022 and only 34% in June 2022. The
other two major terminals, Cartagena and Huelva, have between 40% and 60% of
spare capacity.
Table 2: Utilisation Rate of LNG Regasification Terminals in Spain, 2022
Regas. Monthly Utilisation Rate (%)
Capacity (bcm) Jan-22 Feb-22 Mar-22 Apr-22 May-22 Jun-22
Bahia de Bizkaia Gas 0.58 63% 64% 117% 102% 85% 85%
Barcelona 1.43 41% 34% 20% 28% 35% 34%
Cartagena (Spain) 0.99 50% 42% 39% 66% 69% 57%
Huelva 0.99 40% 60% 46% 40% 41% 43%
Mugardos 0.30 64% 63% 33% 98% 54% 104%
Sagunto 0.73 53% 54% 81% 65% 47% 35%
Source: IHS, IEEFA.
The LNG storage tanks in the six operational LNG terminals in Spain have a capacity
of 22.7 terawatt-hours (TWh) for 23 days.8 The average utilisation rates have been
historically been between 40% and 45%, peaking at 77% in October 2021.
Despite the current gas crisis, which prompted an increased use of Spain’s LNG
storage tanks, the utilisation rate is still at 70%.
Figure 7: Spanish LNG Storage
25 90%
80%
20
70%
60%
15
50%
TWh
40%
10
30%
20%
5
10%
- 0%
Jan-20
Feb-20
Jul-20
Aug-20
Sep-20
Oct-20
Jan-21
Feb-21
Jul-21
Aug-21
Sep-21
Oct-21
Jan-22
Feb-22
Mar-20
Apr-20
May-20
Jun-20
Nov-20
Dec-20
Mar-21
Apr-21
May-21
Jun-21
Nov-21
Dec-21
Mar-22
Apr-22
May-22
LNG Storage Stock LNG Storage Capacity Utlilisation Level %
Spain has international interconnections via pipeline with Algeria, Morocco, France
and Portugal. Two gas pipelines from North Africa bring Algerian gas to Spain: The
Medgaz Pipeline and the Maghreb-Europe Gas Pipeline (MEG). Medgaz is an
undersea pipeline with an annual capacity of 8 billion cubic meters (bcm)
8 European Commission. LNG Spain. 27 November, 2018.Gas in Spain: Still Oversupplied and Overcompensated 10
transporting gas from Algeria to Spain. MEG has an annual capacity of 13.5 bcm. It
was used to import gas from the Hassi R‘Mel field in northern Algeria via Morocco to
Tarifa in southwestern Spain until November 1, 2021, when Algeria cut diplomatic
ties with Morocco and stopped supplying natural gas via the route.9
Spain has a virtual interconnection point with France called “VIP Pirineos,” which
gathers the two physical interconnection points “Larrau” and “Biriatou (FR) / Irun
(ES),” and a virtual interconnection point between Portugal and Spain called “VIP
Ibé rico,” which gathers the two physical interconnection points “Valença do Minho
(PT) / Tuy (ES)” and “Badajoz (ES) / Campo Maior (PT)”.10 The annual capacity of
the VIP Ibérico is 4.6 bcm from Spain to Portugal and 2.6 bcm in the opposite
direction. The capacity of the VIP Pirineos is 7.5 bcm in the flow from Spain to
France and 5.5 bcm from France to Spain.
To date in 2022, gas exports to France have increased, and gas imports via Medgaz
have been steady.
Figure 8: Monthly Gas Pipelines Imports and Exports (GWh)
Gas Pipeline Imports Gas Pipeline Exports
12,000 7,000
6,000
10,000
5,000
8,000
4,000
GWh
GWh
6,000
3,000
4,000
2,000
2,000
1,000
- 0
19 19 19 19 1 9 19 20 20 20 20 2 0 20 21 21 21 21 2 1 21 22 22 22 19 19 19 19 1 9 19 20 20 20 20 2 0 20 21 21 21 21 2 1 21 22 22 22
n- ar- ay- Jul- ep - ov- an- ar- ay- Jul- ep - ov- an- ar- ay- Jul- ep - ov- an- ar- ay- n- ar- ay- Jul- ep - ov- an- ar- ay- Jul- ep - ov- an- ar- ay- Jul- ep - ov- an- ar- ay-
Ja M M S N J M M S N J M M S N J M M Ja M M S N J M M S N J M M S N J M M
Medgaz Maghreb Iberian VIP Pyrenees VIP Iberian VIP Pyrenees VIP
Source: CORES, IEEFA.
Spain has four operating underground gas storages (UGS) sites. Three are depleted
gas fields: Gaviota, Serrablo, and Marismas. Yela is a saline aquifer (storage in
porous media). Marismas is owned by a subsidiary of Gas Natural Fenosa, and the
other three are owned by Enagá s Transporte.11 Their working gas capacities are:
Gaviota, 2.7 bcm; Serrablo, 1.1 bcm; Marismas, 0.6 bcm and Yela, 2 bcm.12
9 Reuters. Algeria end gas supplies to Morocco, October 25 2021.
10Acer. Gas Infraestructura. October 2017.
11 International Energy Agency. Energy Policies of IEA Countries: Spain. 2015.
12 S&P Global Platts. Hydrogen: Beyond the Hype. 2021.Gas in Spain: Still Oversupplied and Overcompensated 11
Regulatory Frameworks
Enagás’ Regulated Activities
Spain’s gas network consists of Enagás, a regulated monopoly and the nation’s only large
TSO, as well as one small TSO and 12 transport companies.13
Enagás’ main activities are:
I. Infrastructure:
a) Gas transport: Offers gas transmission through its pipeline network;
b) Regasification: Transforms liquefied natural gas (LNG) into gas form
and stores it in cryogenic tanks;
c) Storage: Operates underground natural gas storage facilities.
II. Technical Management: Coordination of the access, storage, transportation,
and distribution process, maintaining gas infrastructure, and ensuring the
continuity and security of gas supply.
III. Unregulated Activities: Includes deregulated operations and transactions.
Enagás’ annual income comes from regulated and non-regulated activities. The
company’s income from regulated activities is granted on the basis of the use of its
assets and on state payments for these activities, and for Enagás’ role as the
technical manager of the gas transmission system.
In the regulated market, gas tariffs are determined by the Ministry of Energy and the
CNMC (Comisión Nacional de los Mercados y la Competencia). The main regulated
components of gas prices are the tolls and charges (peajes) payable for the use of the
gas system (pipelines, LNG plants, and underground storage facilities).
The company’s regulated returns are calculated by adding the costs of investment,
operation and maintenance (O&M), and management of the gas network. The values
can be found in the Official State Bulletin (Boletín Oficial del Estado).
The regulatory frameworks consist of six-year regulatory periods that are
established for both electricity and gas activities. As of July 2014, the annual
remuneration of the regulated activities (transmission, regasification, and
underground storage) was established according to Royal Decree-Law 8/2014 (see
Table 3).14
13 S&P Global Platts. Spain's Enagas announces work schedule for LNG terminals, storage,
pipelines. September 2020.
14 Agencia Tributaria España. Royal Decree-Law 8/2014.Gas in Spain: Still Oversupplied and Overcompensated 12
The remuneration for the 2015-20 period consists of:
• Remuneration to Availability or Return on Investment Costs (RD or RDA)
o RD is the sum of investment costs and the maintenance and operational
costs of each facility
o Remuneration for investment costs includes:
I. Guaranteed financial returns for investment, at 5.09% per year of
total net investment for 2015 through 2020;
II. Amortization;
III. Remuneration for extension of useful life (Costes de extensió n de
la vida ú til, COEV, or Retribución por extensión de vida útil,
REVU). COEVs are determined as a percentage of the
remuneration for O&M costs that vary according to the age of the
asset;
IV. Costs of Exploitation (COPEX, Gastos de Explotación Activados)
are expenses incurred from updating facility equipment due to
obsolescence or the need to improve operating conditions,
availability, safety and maintenance;15 and
V. Payback for gas heel, where applicable.16
• Remuneration to Continuity of Supply (RCS)
o RCS is a remuneration assigned to each activity—transmission,
regasification, and underground storage—that is then distributed to all
installations of each activity while they are in operation, according to
their standard investment value.
o The remuneration is updated annually for each activity, according to the
evolution of the established demand, the regasified volumes in the
regasification plants, and the gas stored in the underground storages,
corrected by an efficiency factor.
15Global-Regulation, Royal Decree-Law 8/2014. 4 July, 2014.
16It is normal practice to keep onboard 5% to 10% of an LNG cargo after discharge. This is
referred to as the heel, and is used to cool down the remaining tanks that have no heel before
loading.Gas in Spain: Still Oversupplied and Overcompensated 13
Table 3: Regulatory Framework 2015-2020
Regulatory Framework 2015-2020
Total Remuneration RD + RCS + OPEX
Return on investment Costs (RD or RDA) Remuneration linked to net assets during their regulatory lives
Extension of regulatory life pre 2008 transport assets
Financial remuneration rate: 5.09%
Amortization + Remuneration for extension of useful life COEV or REVU + Costs of Exploitation COPEX +
RD= Payback for gas heel
Remuneration for Continuity of Supply (RCS) Remuneration linked to the long-term availability of Gas System assets with adequate maintenance
RCS is not affected by assets' amortization
Limited impact of changes in demand in the formula
RCS= Previous year RCS x 0.97 x (1 + delta gas demand)
Operation and Maintenance (OPEX) Remuneration based on opex availability
Once the useful life ends, the extension of useful life will be remunerated in addition to O&M remuneration
TSO remuneration updated from €11M to €24M from 2016 onwards
Source: Enagás.
In the 2015-20 regulatory framework, costs of exploitation (COPEX) were a very
significant part of Enagás’ remuneration on investment. Because COPEX largely
consists of costs incurred for updating the equipment for facilities in service, more
infrastructure in service results in a higher COPEX.
Figure 9: Enagás Returns for Investment (Transport and Regasification)
2019 Remuneration 2020 Remuneration
for Gas Heel for Gas Heel
1% 0%
Amortization
Amortization
Costs of 30%
32%
Exploitation Costs of
37% Exploitation
40%
Remuneration
Remuneration
for Extension of
for Extension of
Financial Useful Life
Useful Life Financial
Remuneration (COEV)
(COEV) Remuneration
29% 2%
1% 28%
Source: BOEs, Official State Bulletins and IEEFA calculations.
In 2019, COPEX accounted for 37% of all Enagás remuneration for investment—
more than both financial remuneration (27% of total remuneration for investment)
and amortization (32%). In 2020, COPEX accounted for 40% of all Enagás’
remuneration for investment, while the financial remuneration accounted for 28%
and amortization 30%.
In 2019, the Royal Decree Law 1/2019 gave the CNMC powers to set revenues and
tariffs, which was previously done by the energy ministry. Consequently, CNMCGas in Spain: Still Oversupplied and Overcompensated 14
published a new regulation to set revenues for gas and electricity TSOs and
distribution system operators for 2020-25 for electricity and 2021-26 for gas.17
The CNMC proposes a reduction in the remuneration of all electricity and gas
infrastructure activities.18
The current regulatory framework for gas covers a six-year period from 2021 to
2026. The first gas year under this framework started on January 1, 2021, and
ended September 30, 2021, approving remuneration for nine months. Successive
gas years (12 months) will run from October 1 until September 30.19
In the current regulatory period (2021-26), COPEX is audited and has a maximum
cap. CNMC approves the maximum amount of investment that can be made annually
by companies entitled to remuneration and the provisional remuneration for the
concept.20
Return on investment includes amortization plus financial remuneration and gas
heel compensation. The compensation for operation and maintenance costs is
calculated separately and includes costs for useful life, other costs, and COPEX.
RCS includes the payback for continuity of supply related to the demand, plus the
remuneration for extension of useful life and payback for improvement of
productivity.
Table 4: Regulatory Framework 2021-26
Regulatory Framework 2021-2026
Total Reumuneration ROI + RCS + REVU
Return on Investment Costs (ROI) Remuneration linked to net assets during their regulatory lives
Change to a stable and predictable WACC methodology
Financial remuneration rate: 5.44%
RD= Amortization + Financial Remuneration + Compensation for gas heel
Compensation for Operation and Maintenance costs= Costs for useful life + Single and other costs + COPEX
COPEX will be audited and will have a maximum cap
ROI = RD+O&M Amortization + Financial Remuneration + Compensation for gas heel + Costs for useful life + Single and other costs
+ COPEX
Remuneration for Continuity of Supply (RCS) Remuneration linked to the long-term availability of Gas System assets with adequate maintenance
RCS revenues established for 2020 will progressively decrease to 20% at the end of the 2026 regulatory period
Payback for continuity of supply related to the demand + Remuneration for extension of useful life + Payback for
RCS= improvement of productivity
Incentives for Extending Life of Assets (REVU or COEV in Spanish) Compensation based on Opex standards, with room for efficiency
The company could maintain 50% of the efficiencies
REVU component: once the useful life ends, the extension of the useful life will be remunerated with the O&M
remuneration, with a progressive long-term formula
Investments in the System (not RAB) Financial rate: 5.44% and two years of amortisation
Investments greater than 250,000 euros
Incentives to keep the gas system's transmission infrastructure available
Use of existing gas infrastructure is essential to move forward with the energy transition at the lowest cost
Predictable WACC methodology, similar to main European frameworks
Principles
Strengthens incentives to extend the useful life of assets
Regulatory period of 6 years without reviews
First time the regulation is implemented by an Independent Regulator, CNMC
Source: Enagás.
17 CNMC. Proposal for regulation of the national markets and competition commission. Undated.
18 The Oxford Institute for Energy Studies. The future of gas infrastructure remuneration in Spain.
October 2019.
19 Lexology. The CNMC approves a Circular to establish a new remuneration structure for natural
gas distribution. April 8, 2020.
20 Boletín Oficial del Estado. Otras Disposiciones. February 23, 2021.Gas in Spain: Still Oversupplied and Overcompensated 15
As technical manager of the system (Gestor Técnico del Sistema, GTS), Enagás
received €23.9 million annually in the previous regulatory framework period and
has been allowed to receive between €26.3 million and €26.7 million annually from
2021 to 2023, reaching up to €27.2 million considering the maximum incentives
allowed.21
Enagás’ financial statements show that the company’s main source of income has
been slowly declining, falling 4.8% from 2020 to 2021, when the current regulatory
framework came into force.
Figure 10: Enagás Income From Regulated Activities
1,400,000
1,200,000
1,000,000
Thousand Euros
800,000
600,000
400,000
200,000
0
2015 2016 2017 2018 2019 2020 2021
Enagás Transporte, S.A.U. Enagás Transporte del Norte, S.L. Enagás GTS, S.A.U.
Source: Enagás Annual Financial Reports.
An analysis of the allowed annual revenues shows that for 2021, only the values for
nine months (January to September) are included. It is unclear whether the figure
on the financial statement reflects the company’s income for the 12 months of 2021,
or nine months only.
From 2022 onwards, the annual remuneration is calculated from October to
September.
21 CNMC. Retribucion de Enagas. January 16, 2020.Gas in Spain: Still Oversupplied and Overcompensated 16
Figure 11: Enagás Regulated Returns
1,400,000
1,200,000
1,000,000
Thousand Euros
800,000
600,000
400,000
200,000
0
2015 2016 2017 2018 2019 2020 Jan-Sep Oct 21 - Sep Oct 22 - Sep
2021 22 23
Total Enagás Regasification Total Enagás Transport Total Enagás Storage Enagás GTS
Source: BOEs, Official State Bulletins.
Throughout the six years of the previous regulatory period, the return on
investment costs (RD) was Enagás’ largest source of revenue, contributing 71% of
total regulated revenue, followed by renumeration to continuity of supply (RCS) at
25%, and return for operation and maintenance at 4%. RD has made up 67% of
Enagás total revenue (regulated and non-regulated).
Table 5 shows that the regulatory revenues in 2022 (October 2021 to September
2022) are forecasted to see only a small reduction (-2%) compared to 2020 values,
which illustrates that the CNMC regulations are not reducing system costs
significantly. Remuneration for regasification activities should increase by 8% from
2020 to 2022; renumeration for transport activities should decrease by 4%, where
the maximum value of COPEX allowed has been used.
The values for 2023 (covering the period from October 2022 to September 2023)
are not definite yet because of potential adjustments that could increase the
revenues allowed for the year.Gas in Spain: Still Oversupplied and Overcompensated 17
Table 5: Enagás Regulatory Returns per Activity (€’000s)22
Regasification 2015 2016 2017 2018 2019 2020 Jan-Sep 2021 Oct 21 - Sep 22 Oct 22 - Sep 23
RCS 46,911.10 49,576.59 51,817.97 57,251.02 53,481.79 71,478.18 83,898.60 102,240.52 93,178.24
RD Investment 307,007.10 275,092.01 259,607.94 244,462.29 237,184.68 228,423.42 79,985.02 102,572.59 97,445.75
RD Opex 1,941.91 90,907.50 121,329.71 120,714.81
El Musel 23,605.52 23,605.52 23,605.52 23,605.52 23,605.52 23,605.50 18,655.50 24,942.33 24,942.33
Total Enagás 377,523.73 348,274.13 335,031.43 325,318.83 314,272.00 325,449.00 273,446.62 351,085.15 336,281.13
COPEX Maximo 54,567.71 54,567.71 54,567.71
COPEX Enagás Used - 10,516.93 14,022.57 14,022.57
Transport 2015 2016 2017 2018 2019 2020 Jan-Sep 2021 Oct 21 - Sep 22 Oct 22 - Sep 23
RCS 205,914.69 203,086.91 212,508.14 210,759.66 200,702.48 198,609.84 165,857.92 191,562.05 161,829.65
RD Investment 503,257.12 505,726.61 505,905.92 495,167.12 487,196.50 470,600.65 191,152.57 250,048.67 242,410.61
RD Opex 1,988.33 143,767.08 201,692.81 193,572.25
Total Enagás 709,171.81 708,813.52 718,414.06 705,926.79 687,898.98 671,198.82 500,777.57 643,303.54 597,812.51
COPEX Maximo 24,879.38 24,879.38 24,879.38
COPEX Enagás Used 18,406.16 24,541.55 24,541.55
Underground Storage 2015 2016 2017 2018 2019 2020 Jan-Sep 2021 Oct 21 - Sep 22 Oct 22 - Sep 23
RCS 4,733.48 4,422.81 4,754.49 4,360.92 4,693.00 4,462.52 3,148.36 5,954.72
RD Investment 17,837.93 28,091.12 54,837.20 50,852.16 47,557.16 41,362.65 30,841.02 40,208.10
RD Opex 42,782.18 45,193.25 45,193.25 29,475.03 42,239.17 33,836.72 24,836.94 33,236.19
TOTAL Enagás 65,353.60 77,001.85 104,079.62 83,982.78 93,784.00 78,956.56 58,826.33 79,399.01 -
COPEX Maximo
COPEX Enagás Used
Total Enagás 2015 2016 2017 2018 2019 2020 Jan-Sep 2021 Oct 21 - Sep 22 Oct 22 - Sep 23
Total Enagás Regasification 377,524 348,274 335,031 325,319 314,272 325,449 273,447 351,085 336,281
Total Enagás Transport 709,172 708,814 718,414 705,927 687,899 671,199 500,778 643,304 597,813
Total Enagás Storage 65,354 77,002 104,080 83,983 93,784 78,957 58,826 79,399 79,399*
Enagás GTS 11,561 23,966 23,966 23,966 23,893 25,007 26,532 26,532* 26,532*
Grand Total Enagás 1,163,610 1,158,056 1,181,491 1,139,195 1,119,848 1,100,611 859,583 1,073,788 934,094
Source: BOEs, Official State Bulletins, IEEFA calculations.
Note: Asterisk (*) indicates estimated values.
22 Includes reported retrospective amendments in remuneration for preceding years.Gas in Spain: Still Oversupplied and Overcompensated 18 Figure 12: Enagás Regulated Returns Composition Source: BOEs, Official State Bulletins, IEEFA calculations. Decarbonisation and Security of Supply Are the New Investment Rationale Slogan Change From “Security of Supply” to “Decarbonisation” Rate-of-return regulation is a form of price-setting regulation in which government regulators determine the fair price that a monopoly, such as a gas utility, is allowed to charge its customers.23 Its critics argue it provides little incentive to reduce costs and increase efficiency. Rate-of-return regulation can contribute to the so-called Averch-Johnson effect,24 which is named after two economists who developed a stylized model of the rate-of-return regulated firm. They found that firms which are subject to rate-of-return regulation will overinvest in capacity if the allowed return is greater than the required return on capital.25 Is this the rationale behind the decarbonisation investments proposed and planned by Enagás? Enagás has created a significant oversupply of underutilized gas infrastructure, which the company has justified as part of a strategy to achieve security and diversification of supply, passing down the cost of unnecessary infrastructure to its customers. A large number of LNG regasification terminals were built in the past 10 years, but their construction is difficult to justify, given the lack of demand for additional infrastructure projects. In July 2022, Enagás presented its 2022-2030 Strategic Plan, which aims to address “security of supply and decarbonisation” in Spain and Europe to reflect the most pressing challenges in the European and global energy market. The strategic plan 23 Investopedia. Rate of Return Regulation. November 18, 2020. 24 Body of Knowledge on Infrastructure Regulation. Averch-Johnson Effect. 2021. 25 Ibid.
Gas in Spain: Still Oversupplied and Overcompensated                                      19

foresees investments in gas and hydrogen infrastructure and adjacent businesses,
innovation, technology and digitalization, international development with a main
focus on Europe, and green hydrogen and biomethane generation activity and
projects.

With this plan, Enagás aims to become a hydrogen network operator (HNO) by
2030, in line with the current proposal for European Union regulation. The
investments will guarantee that Enagás will continue receiving regulated revenues
that will reflect on an increase in gas consumer bills, as has been the case in recent
years.

There is a real risk that decisions made within such a framework may be driven by
remunerative motivations, not by technical system needs. From the technological,
safety, and environmental perspective, there is still great uncertainty over whether
hydrogen could or should be blended in the natural gas stream. The University of
California at Riverside’s Hydrogen Blending Impacts Study, an independent study
commissioned pursuant to Senate Bill 1369, concluded that hydrogen blends above
5% could require modifications of appliances such as stoves and water heaters to
avoid leaks and equipment malfunctions. If this is the case, consumers will need to
invest in adapting or replacing their appliances, an additional cost to high gas bills.

Conclusion
Evidence analyzed by IEEFA suggests that rate-of-return regulation has encouraged
Enagás to overinvest in gas infrastructure, boosting costs for Spain’s gas consumers
and returns for Enagás shareholders.

Under the premise of security and diversification of supply, Enagás has created a
significant oversupply of underutilized gas infrastructure. The cost of the
unnecessary investments falls on consumers, who continue to face high bills.

A high number of LNG regasification terminals were built in more than 10 years, but
their construction cannot be justified because of the lack of demand for such
projects, as shown by this analysis.

Enagás continues to use the same narrative—that is, seeking to address “security of
supply and decarbonisation” in Spain and Europe to reflect the most pressing
challenges in the European and global energy market—to justify continued
investment in new and potentially unnecessary gas and hydrogen infrastructure. As
this report shows, the company’s aim is to guarantee a regulated revenue,
regardless of whether this comes at the expense of gas consumers.
Gas in Spain: Still Oversupplied and Overcompensated                                     20

       About IEEFA
       The Institute for Energy Economics and Financial Analysis (IEEFA) examines
       issues related to energy markets, trends and policies. The Institute’s mission
       is to accelerate the transition to a diverse, sustainable and profitable energy
       economy. www.ieefa.org

       About the Author
       Ana Maria Jaller-Makarewicz
       Ana Maria Jaller-Makarewicz, energy analyst for IEEFA, is an energy
       consultant and training facilitator with a BSc and MSc in electrical
       engineering. Ana worked in Colombia at Electric Utilities, gas distribution
       company and Universidad de Norte. In the UK, she has worked as an energy
       consultant analysing the global natural gas market and industry. She advised
       electricity regulators in BiH and the Ministry of Power in Nigeria
       and worked as individual contractor for UNFCCC. She has delivered energy
       training programmes in Africa, Asia, Middle East, Latin America and Europe.
You can also read