GASLOG PARTNERS LP Investor Presentation - June 2021

Page created by Lee Horton
 
CONTINUE READING
GASLOG PARTNERS LP Investor Presentation - June 2021
GASLOG PARTNERS LP

Investor Presentation
June 2021
GASLOG PARTNERS LP Investor Presentation - June 2021
FORWARD-LOOKING STATEMENTS
All statements in this presentation that are not statements of historical fact are “forward-looking statements” within the meaning of the U.S. Private Securities Litigation Reform Act of 1995. Forward-looking statements include statements that address
activities, events or developments that the Partnership expects, projects, believes or anticipates will or may occur in the future, particularly in relation to our operations, cash flows, financial position, liquidity and cash available for distributions, and the impact
of changes to cash distributions on the Partnership’s business and growth prospects, plans, strategies and changes and trends in our business and the markets in which we operate. We caution that these forward-looking statements represent our estimates
and assumptions only as of the date of this presentation, about factors that are beyond our ability to control or predict, and are not intended to give any assurance as to future results. Any of these factors or a combination of these factors could materially
affect future results of operations and the ultimate accuracy of the forward-looking statements. Accordingly, you should not unduly rely on any forward-looking statements.
Factors that might cause future results and outcomes to differ include, but are not limited to, the following:
▪   general LNG shipping market conditions and trends, including spot and multi-year charter rates, ship values, factors affecting supply and demand of LNG and LNG shipping, including geopolitical events, technological advancements and opportunities for
    the profitable operations of LNG carriers;
▪   fluctuations in charter hire rates, vessel utilization and vessel values;
▪   our ability to secure new multi-year charters at economically attractive rates;
▪   our ability to maximize the use of our vessels, including the re-deployment or disposition of vessels which are not operating under multi-year charters, including the risk that certain of our vessels may no longer have the latest technology at such time
    which may impact our ability to secure employment for such vessels as well as the rate at which we can charter such vessels;
▪   changes in our operating expenses, including crew wages, maintenance, dry-docking and insurance costs and bunker prices;
▪   number of off-hire days and dry-docking requirements, including our ability to complete scheduled dry-dockings on time and within budget;
▪   planned capital expenditures and availability of capital resources to fund capital expenditures;
▪   disruption to the LNG, LNG shipping and financial markets caused by the global shutdown as a result of the COVID-19 pandemic;
▪   business disruptions resulting from measures taken to reduce the spread of COVID-19, including possible delays due to the quarantine of vessels and crew, as well as government-imposed shutdowns;
▪   fluctuations in prices for crude oil, petroleum products and natural gas, including LNG;
▪   fluctuations in exchange rates, especially the U.S. dollar and the Euro;
▪   our ability to expand our portfolio by acquiring vessels through our drop-down pipeline with GasLog or by acquiring other assets from third parties;
▪   our ability to leverage GasLog’s relationships and reputation in the shipping industry;
▪   the ability of GasLog to maintain long-term relationships with major energy companies and major LNG producers, marketers and consumers;
▪   GasLog’s relationships with its employees and ship crews, its ability to retain key employees and provide services to us, and the availability of skilled labor, ship crews and management;
▪   changes in the ownership of our charterers;
▪   our customers’ performance of their obligations under our time charters and other contracts;
▪   our future operating performance, financial condition, liquidity and cash available for distributions;
▪   our distribution policy and our ability to make cash distributions on our units or the impact of cash distribution reductions on our financial position;
▪   our ability to obtain debt and equity financing on acceptable terms to fund capital expenditures, acquisitions and other corporate activities, funding by banks of their financial commitments, funding by GasLog of the revolving credit facility and our ability to
    meet our restrictive covenants and other obligations under our credit facilities;
▪   future, pending or recent acquisitions of ships or other assets, business strategy, areas of possible expansion and expected capital spending;
▪   risks inherent in ship operation, including the discharge of pollutants;
▪   the impact on us and the shipping industry of environmental concerns, including climate change;
▪   any malfunction or disruption of information technology systems and networks that our operations rely on or any impact of a possible cybersecurity event;
▪   the expected cost of and our ability to comply with environmental and regulatory requirements, including with respect to emissions of air pollutants and greenhouse gases, as well as future changes in such requirements or other actions taken by regulatory
    authorities, governmental organizations, classification societies and standards imposed by our charterers applicable to our business;
▪   potential disruption of shipping routes due to accidents, diseases, pandemics, political events, piracy or acts by terrorists;
▪   potential liability from future litigation; and
▪   other risks and uncertainties described in the Partnership’s Annual Report on Form 20-F filed with the SEC on March 2, 2021, available at http://www.sec.gov.

We undertake no obligation to update or revise any forward-looking statements contained in this presentation, whether as a result of new information, future events, a change in our views or expectations or otherwise, except as required by applicable law.
New factors emerge from time to time, and it is not possible for us to predict all these factors. Further, we cannot assess the impact of each such factor on our business or the extent to which any factor, or combination of factors, may cause actual results to
be materially different from those contained in any forward-looking statement. The declaration and payment of distributions are at all times subject to the discretion of our board of directors and will depend on, amongst other things, risks and uncertainties
described above, restrictions in our credit facilities, the provisions of Marshall Islands law and such other factors as our board of directors may deem relevant.

.

June 2021 | Investor Presentation                                                                                                                                                                                                                                                2
HISTORY, OWNERSHIP STRUCTURE AND ASSETS

June 2021 | Investor Presentation         3
GASLOG HISTORY

  1824                        1982                       2001                      2011                            2014                               2016                    Today
  The Livanos Family          George P. Livanos          The Ceres Group           The GasLog brand                A further ten ships added to       Term charters
  traces its roots to the     founded the Hellenic       enters LNG                is introduced                   the fleet and surpassing           secured with
  island of Chios, where      Marine Environment         Shipping, forming a       A further eight new-            12,000,000 man hours without       Total and
  they made their first       Protection Association     strategic                 buildings are                   an LTIF with SHI                   Centrica
  steps into the              (HELMPA) to promote        relationship with BG      ordered from SHI
  shipping industry           health and safety          Group – the first                                                                            GasLog launches        Leading LNG shipping provider:
                              measures aboard ships      voyage of the                                                                                its FSRU
                                                         Methane Kari Elin                                                                            business               6 Steam vessels
                                                         for BG Group in                                           IPO of GasLog Partners                                    12 X-DF vessels
                                                         2004                                                      (NYSE: GLOP)                                              17 TFDE vessels

    1949                                                                 2007                                                         2015
                               1987
    Ceres Hellenic                                                       Ceres LNG Shipping                                           Formation of the Cool Pool with
                               SeaChem
    Shipping Enterprises                                                 manages and operates                                         Golar and Dynagas
                               established.
    Ltd. was established by                                              eight LNGCs on behalf of                                     LNGreen Award for pioneering
                               Paul Wogan
    George P. Livanos                                                    BG Group. Entry into                                         work in vessel design
                               CEO - Merged
                                                                         LNGC ownership, with six                                     Among the first to order 2-stroke
                               with Odfjell in
                                                                         vessels ordered at SHI                                       XDF vessels                         2018
                               2000
                                                                                                          2012                                                            Delivery of its first X-DF vessels:
                                                 1994                                                                                                                     GasLog Houston, GasLog Hong
                                                  Peter Livanos takes                                     GasLog Ltd. goes public                                         Kong and GasLog Genoa
                                                  over management of                                      with a listing on the New
                                                  Ceres Hellenic from                                     York Stock Exchange                                             Term charters secured with
                                                  his father                                              (NYSE:GLOG)                                                     Centrica and Cheniere

June 2021 | Investor Presentation                                                                                                                                                                               4
ORGANISATIONAL AND OWNERSHIP STRUCTURE

                      Livanos Family(~43%)                                                                                      Onassis Foundation (~12%)                                    Blackrock GEPIF

                                                                                       ~55%                                                                                                           ~45%
                                                                                                                                     GASLOG LTD.
                                                                                                                                      NYSE: GLOG
                                                                                                                                    20 LNG carriers(1)
                                                                                                                                12 XDF / 7 TFDE / 1 Steam

                                                                                                                         100% of GP                                               35.6%(2)

                                                                                                                                  GASLOG PARTNERS LP
                Public Unitholders                                                                                                    NYSE: GLOP
                                                                                       64%                                           15 LNG carriers
                                                                                                                                    10 TFDE / 5 Steam

1) Includes three vessels which have been sold to a subsidiary of Mitsui & Co. Ltd. to CMBFL and ICBC respectively, and leased back by GasLog under long-term bareboat charters
2) Inclusive of 2.0% General Partner interest and Class B units owned by GasLog Ltd.
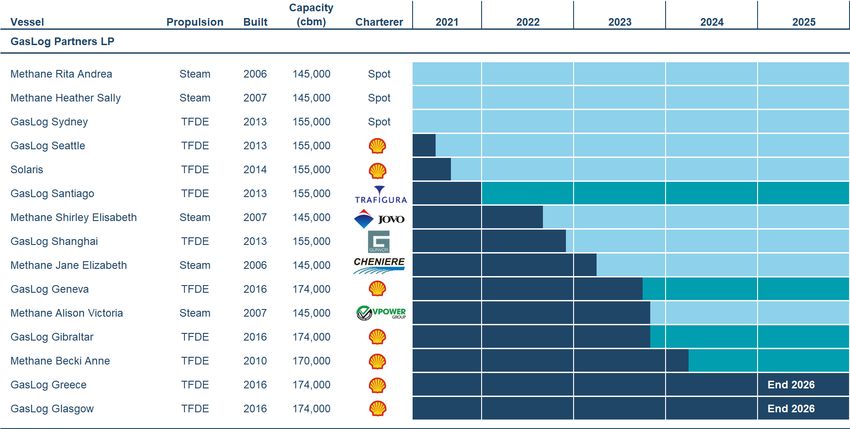
June 2021 | Investor Presentation                                                                                                                                                                              5
THE GASLOG PARTNERS FLEET

GASLOG PARTNERS LP’S FLEET
                                                                                                                                                            15
                                                                                                                                                            Number of vessels in the
                                                                                                                                                            Partnership’s fleet

                                                                                                                                                            c.$660 million
                                                                                                                                                            Contracted revenue backlog as
                                                                                                                                                            of March 31, 2021

                                                                                                                                                            c.2 years
                                                                                                                                                            Average charter duration of the
                                                                                                                                                            GasLog Partners fleet

                                                                                                                                                            c.9 years
                                                                                                                                                            Average age of the GasLog
                                                                                                                                                            Partners fleet

 1.   Refer to the GasLog Partners Q1 2021 Results 6-K filed with the SEC on May 6, 2021 for a detailed description of the charterers and option periods.

June 2021 | Investor Presentation                                                                                                                                                         6
INVESTMENT CASE

June 2021 | Investor Presentation   7
INDEPENDENT STRATEGY OFFERS ATTRACTIVE INVESTMENT CASE

    1           15-vessel fleet backed by leading operational and commercial platform offers a competitive advantage

    2           Strong financial position with no corporate-level debt and no debt maturities until 2024

    3           Capital allocation for 2021 prioritizes debt repayment, more than covered by contracted cash flows this year

    4           Continued strength in the LNG carrier spot market to materially benefit the Partnership

    5           LNG demand growth projected for decades to come

June 2021 | Investor Presentation                                                                                              8
1   EXISTING STRUCTURE AND STRATEGY CREATES PLATFORM FOR VALUE CREATION

                                                                            LNG TRADE BY CHARTER DURATION (MT)

                   Continued forecast growth in LNG market

                   Spot and short-term trade in LNG is growing rapidly

                   Leading commercial and operational platform              Source: Poten

                                                                            NUMBER OF SPOT FIXTURES

                   Fleet size and operational excellence afford us a
                   competitive advantage

                   Financially strong with no corporate level debt and no
                   debt maturities until 2024

                                                                             Source: Poten

    June 2021 | Investor Presentation                                                                            9
2   CONTINUED FOCUS ON DEBT REPAYMENT, NEAREST MATURITY IN 2024

    BALANCE SHEET METRICS                                                    SECURED DEBT BALANCE AND AMORTIZATION 2021-2023 ($M)                                                                              CASH ITEMS

    5.0x                                                                                                                                                                                                       c.$36 million
    Net debt to trailing 12-month                                                                                                                                                                              Debt retired during Q1 2021
    adjusted EBITDA                                                                                                                                                                                            through scheduled amortization

    50%                                                                                                                                                                                                        c.$330 million
    Net debt to total capitalization                                                                                                                                                                           Total scheduled debt
    as of Q1 2021                                                                                                                                                                                              amortization during 2021-2023

    $125 million                                                                                                                                                                                               $0
    Total available liquidity at end                                                                                                                                                                           Committed growth capex
    Q1 2021

    $110 million
    Annual scheduled amortization
    2021-23

    $0
    Corporate level debt

     1.   Capitalization defined as total assets. Net debt defined as borrowings net of cash and cash equivalents. Available liquidity defined as cash and cash equivalents plus undrawn borrowing capacity.
     2.   Forecast for total capitalization determined using our fleet’s depreciation schedule and debt using our amortization schedule.

    June 2021 | Investor Presentation                                                                                                                                                                                                           10
3   CASH GENERATED IN Q1, ALONG WITH 75% CHARTER COVERAGE THROUGH YEAR
    END MORE THAN COVERS OUR DEBT SERVICE OBLIGATIONS FOR 2021
    2021 GASLOG PARTNERS COMMITTED CASH INFLOWS AND OUTFLOWS ($M)(1,2,3,4.5)

    1.   Adjusted EBITDA is a non-GAAP financial measures and should not be used in isolation or as a substitute for the Partnership’s financial results presented in accordance with IFRS. For the definition and reconciliation of these measures to the most directly comparable financial measures calculated and presented in
         accordance with IFRS, please refer to the Appendix to these slides.
    2.   Contracted adjusted EBITDA as of March 31, 2021 and does not include any contribution from charters signed thus far in Q2.
    3.   Contracted adjusted EBITDA assumes daily operating expenses average $14,132 per day and G&A averages approximately $2,275 per day, equivalent to its average during Q1 2021 as well as 2,972 fixed days in Q2-Q4 2021 as of March 31, 2021.
    4.   Interest expense assumed to be the average debt balance in 2021 of approximately $1.25 billion based on our scheduled amortization, with an average cost of debt of approximately 2.4%, equal to the average interest rate during the 3-month period ended March 31, 2021.
    5.   Operating and G&A expenses for open days assume daily operating expenses average $14,132 per day and G&A averages approximately $2,275 per day, equivalent to their average during Q1 2021 as well as 1,071 fixed days in Q2-Q4 as of March 31, 2021.

    June 2021 | Investor Presentation                                                                                                                                                                                                                                                                                       11
4   A RECOVERY IN LNG SHIPPING SPOT RATES TO MATERIALLY BENEFIT GASLOG
    PARTNERS
    2021 OPEN DAYS BY QUARTER(1)                                                                                                                  2021 ADJ. EBITDA SENSITIVITY ($M)(2)

    1.   As of March 31, 2021
    2.   Assumes daily operating expenses average $14,132 per day and G&A averages approximately $2,275 per day, equivalent to the average over Q1 2021 as well as 1017 unfixed days in 2021 as of March 31, 2021

               Each $10,000 per day increase in TCE generates approximately $10 million of incremental EBITDA in 2021

    June 2021 | Investor Presentation                                                                                                                                                                               12
4   SPOT MARKET LIQUIDITY NEAR RECORD HIGH IN Q1, HEADLINE SPOT RATES NEAR 5-
    YEAR HIGHS
     NUMBER OF SPOT FIXTURES Q1 19 – Q1 21                              HEADLINE TFDE SPOT RATES ($/DAY)
                                                                                                                       93
                                                                                                                       Total LNGC spot fixtures in Q1
                                                                                                                       2021

                                                                                                                       41
                                                                                                                       TFDE spot fixtures in Q1 2021

                                                                                                                       23
                                                                                                                       Steam spot fixtures in Q1 2021

                                                                                                                       $54,500 per day
                                                                                                                       Current headline spot rate
                                                                                                                       assessment for TFDE LNGCs

                                                                                                                       $37,500 per day
                                                                                                                       Current headline spot rate
                                                                                                                       assessment for ST LNGCs

    Source: Poten, Clarksons, Fearnleys

                                    A record 18 one-year time charters were fixed in Q1 on the back of the strong winter market
          Source: Wood Mackenzie LNG Tool Q3 2020

    June 2021 | Investor Presentation                                                                                                               13
5   85% OF PROJECTED LNG DEMAND GROWTH TO COME FROM ASIA DURING 2021-2026

    LNG DEMAND GROWTH 2021-2026 (MILLION TONNES)                                                                                      97 mt
                                                                                                                                      Forecast LNG demand growth
                                                                     emand growth b region countr
                                                                                                                                      2021-2026

                                                                                                                                      4%
      L G demand growth b region million tonnes

                                                  0
                                                                                                                                      Compound annual growth in
                                                                                                                                      LNG demand 2021-2026,
                                                                                                                                      according to Wood Mackenzie

                                                                                                                                      85%
                                                                                                                                      Percentage of demand growth
                                                  0                                                                                   coming from Asia during 2021-
                                                                                                                                      26

                                                  0

                                                      urope   A   Africa              LA A          ndia   unker   hina   ther Asia
                                                                                                           Fuel
    Source: Wood Mackenzie LNG Tool Q1 2021

    June 2021 | Investor Presentation                                                                                                                             14
5   LNG OFFERS A CLEAN, INEXPENSIVE AND AVAILABLE SOLUTION TO MEET UPCOMING
    IMO EMISSIONS TARGETS
    2021 AVG BUNKER FUEL PRICE ($/TON)(1)                                                                                 CO2 EMISSIONS BY FUEL TYPE(2)                                                                                       IMO TARGETS

                                                                                                                                                                                                                                              40%
                                                                                                                                                                                                                                                  ’s target reduction in carbon
                                                                                                                                                                                                                                              intensity for shipping by 2030
                                                                                                                                                                                                                                              compared with 2008

                                                                                                                                                                                                                                              EEXI
                                                                                                                                                                                                                                              Energy Efficiency Existing Ship
                                                                                                                                                                                                                                              Index to be compared with a
                                                                                                                                                                                                                                              baseline and required reduction
                                                                                                                                                                                                                                              factor

                                                                                                                                                                                                                                              CII
                                                                                                                                                                                                                                              Carbon Intensity Indicator
                                                                                                                                                                                                                                              determines the annual reduction
                                                                                                                                                                                                                                              factor to ensure improvement of
                                                                                                                                                                                                                                              the vessel’s carbon intensit

               GasLog are currently investigating options for our ST fleet to meet the upcoming EEXI and CII requirements
    Source: UK Government GHG Conversion Factors, Department for Business, Energy& Industrial Strategy, Wood Mackenzie
    1.      asis Singapore for low sulfur fuel oil “LSF ” and Platts apan-Korea Market for LNG. Fuel-oil equivalent utilized for LNG where 1 m3 of LNG is equal to 0.484 tons of fuel oil and 1 m3 of LNG is 24.02 mmBTU. Source: Bloomberg
    2.    American Bureau of Shipping – Setting the course to low carbon shipping

    June 2021 | Investor Presentation                                                                                                                                                                                                                                             15
Q1 2021 RESULTS SUMMARY

June 2021 | Investor Presentation   16
GASLOG PARTNERS Q1 2021 HIGHLIGHTS

1    DELIVERING FOR OUR CUSTOMERS
     ▪ Fleet uptime of 100% in Q1 2021
     ▪ 72 port calls and c.2.2 million tons of LNG delivered in Q1 2021

2    OPERATING ENVIRONMENT REMAINS CHALLENGING
     ▪ Crew changes remain difficult, particularly in Asia
     ▪ Unit operating expenses averaged $14,132 per day in Q1 2021

3    SOLID FINANCIAL PERFORMANCE ENABLED BY COST CONTROL
     ▪ Adjusted EBITDA of c.$64 million, in line with Q1 2020
     ▪ Adjusted EPU of $0.50 per unit, up 19% year-over-year

4    EXECUTING ON OUR STRATEGY TO DELEVERAGE
     ▪ Retired c.$36 million of debt in Q1 2021
     ▪ Improved charter coverage to 75% for remainder of 2021
     ▪ Declared $0.01 per unit distribution for Q1 2021, unchanged from Q4 2020

June 2021 | Investor Presentation                                                 17
Q1 FINANCIAL RESULTS REFLECT COST CONTROL AND STRONG WINTER MARKET

REVENUES ($M)                                                                                             ADJUSTED EBITDA ($M)                                                                                        ADJUSTED EPU ($/UNIT)

 1.   Adjusted EBITDA and adjusted earnings per unit are non-GAAP financial measures and should not be used in isolation or as a substitute for GasLog Partners’ financial results presented in accordance with nternational Financial Reporting Standards “ FRS”). For the definition and reconciliation of
      these measures to the most directly comparable financial measures calculated and presented in accordance with IFRS, please refer to the Appendix to these slides.

June 2021 | Investor Presentation                                                                                                                                                                                                                                                                              18
Q1 EXPENSES POSITIVELY IMPACTED BY COST CONTROL INITIATIVES AND LOWER
LIBOR RATES
UNIT OPEX ($/DAY)                   UNIT G&A ($/DAY)   INTEREST EXPENSE ON LOANS ($M)

June 2021 | Investor Presentation                                                       19
LNG COMMODITY AND LNG SHIPPING REVIEW AND OUTLOOK

June 2021 | Investor Presentation                   20
87% OF THE ORDERBOOK IS COMMITTED ON MULTI-YEAR CHARTERS, DELIVERIES
PEAKING IN 2021
QUARTERLY DELIVERY SCHEDULE

                                           Earliest delivery is
                                           Q4 2023 for vessel
                                           ordered today

  Source: Poten, GasLog estimates

June 2021 | Investor Presentation                                      21
STRONG LNG DEMAND FROM ASIA PROPELLED TRADE GROWTH IN Q1

MONTHLY YEAR OVER YEAR DEMAND GROWTH BY REGION: APR 2020 – APR 2021 (MT)
                                                                           1%
                                                                           LNG demand growth year-over-
                                                                           year in Q1 2021

                                                                           34%
                                                                            hina’s L G demand growth
                                                                           year-over-year in Q1 2021

                                                                           (28%)
                                                                           Decline in LNG demand from
                                                                           Europe in Q1 2021

                                                                           4%
                                                                           Expected LNG demand growth
                                                                           in 2021, according to Wood
                                                                           Mackenzie

   Source: Poten

June 2021 | Investor Presentation                                                                       22
RECORD NUMBER OF LNG CARGOES EXPORTED FROM THE US IN Q1 2021

NUMBER US LNG CARGOES EXPORTED BY QUARTER: Q1 2020 – Q4 2021E(1)
                                                                                                                                                                                       17 MT
                                                                                                                                                                                       US LNG exports in Q1 2021

                                                                                                                                                                                       69 MT
                                                                                                                                                                                       US exports for 2021 as
                                                                                                                                                                                       estimated by Wood Mackenzie

                                                                                                                                                                                       50%
                                                                                                                                                                                       Percentage of US exports to
                                                                                                                                                                                       Asia during Q1 2021

                                                                                                                                                                                       c.1.9x
                                                                                                                                                                                       US shipping multiplier in Q1
                                                                                                                                                                                       2021

   Source: Poten, Platts, Wood Mackenzie, GasLog Estimates
   1.    2021 quarterly estimates calculated from Wood Mackenzie’s quarterl US production estimates per Q 202 Short-Term Trade Outlook and assumes average cargo size of 160,000 CBM

June 2021 | Investor Presentation                                                                                                                                                                                     23
FORECAST REGIONAL GAS PRICE DIFFERENTIALS SUPPORT INTER-BASIN TRADING
OF LNG THROUGH AT LEAST THE WINTER 2021/2022
REGIONAL GAS PRICE DIFFERENTIALS: OCTOBER 2019 – JANUARY 2022 ($/MMBTU)
                                                                                                                                                                                                                                             c.$6.00/mmBTU
                                                                                                                                                                                                                                             Current JKM-HH price
                                                                                                                                                                                                                                             differential

                                                                                                                                                                                                                                             c.$1.55/mmBTU
                                                                                                                                                                                                                                             Shipping cost from USG to NE
                                                                                                                                                                                                                                             Asia through Panama Canal at
                                                                                                                                                                                                                                             current spot rates, according to
                                                                                                                                                                                                                                             Poten

                                                                                                                                                                                                                                             c.$5.15/mmBTU
                                                                                                                                                                                                                                             Current TTF-HH price
                                                                                                                                                                                                                                             differential

                                                                                                                                                                                                                                             c.$0.80/mmBTU
                                                                                                                                                                                                                                             Shipping cost from USG to EU
                                                                                                                                                                                                                                             at current spot rates, according
                                                                                                                                                                                                                                             to Poten

   Source: Poten, Bloomberg as of May 4, 2021
   “   ” refers to Platts apan orea arker, the benchmark spot price for L G delivered in northern Asia. “   F” refers to the   utch itle ransfer Facilit , the benchmark natural gas price for orthern urope. “HH” refers to Henr Hub, the
   benchmark natural gas price in the United States.

June 2021 | Investor Presentation                                                                                                                                                                                                                                          24
FUTURE LNG PRODUCTION AND RECEIVING INFRASTRUCTURE SUPPORT CONTINUED
TON-MILE EXPANSION
LNG CAPACITY ADDITIONS 2021-26 (MT)                            REGAS CAPACITY ADDITIONS 2021-24 (MT)
                                                                                                       120 MT
                                                                                                       LNG capacity additions during
                                                                                                       2021-2026

                                                                                                       56 MT
                                                                                                       LNG capacity additions from
                                                                                                       North America during 2021-
                                                                                                       2026

                                                                                                       110 MT
                                                                                                       LNG regasification capacity
                                                                                                       additions during 2021-2024

                                                                                                       71%
                                                                                                       LNG regasification capacity
                                                                                                       additions from Asia during
                                                                                                       2021-2024

   Source: Wood Mackenzie LNG Tool Q1 2021, GasLog estimates

June 2021 | Investor Presentation                                                                                                    25
APPENDIX

June 2021 | Investor Presentation   26
2021 DRY-DOCKING SCHEDULE AND CONTRACTED REVENUE BACKLOG

DRY-DOCKING SCHEDULE(1)                                                                                                GLOP CONTRACTED REVENUES ($M)

                                                                 Q2 21                    Q3 21                Q4 21

      GasLog Partners

      GasLog Greece                                                  30

      GasLog Glasgow                                                 30

      Methane Rita Andrea                                            26

      GasLog Geneva                                                                           30

      GasLog Gibraltar                                                                        30

 1.     he estimates in this table are management’s forecast as of   a   , 2021 and are subject to revision.

June 2021 | Investor Presentation                                                                                                                      27
NON-GAAP FINANCIAL MEASURES AND RECONCILIATIONS
Non-GAAP Financial Measures:

EBITDA is defined as earnings before financial income and costs, gain/loss on derivatives, taxes, depreciation and amortization.
Adjusted EBITDA is defined as EBITDA before impairment loss on vessels and restructuring costs. Adjusted Profit represents earnings
before (a) non-cash gain/loss on derivatives that includes unrealized gain/loss on derivatives held for trading, (b) write-off and
accelerated amortization of unamortized loan fees, (c) impairment loss on vessels and (d) restructuring costs. Adjusted EPU, represents
earnings attributable to unitholders before (a) non-cash gain/loss on derivatives that includes unrealized gain/loss on derivatives held for
trading, (b) write-off and accelerated amortization of unamortized loan fees, (c) impairment loss on vessels and (d) restructuring costs.
EBITDA, Adjusted EBITDA, Adjusted Profit and Adjusted EPU, which are non-GAAP financial measures, are used as supplemental
financial measures by management and external users of financial statements, such as investors, to assess our financial and operating
performance. The Partnership believes that these non-GAAP financial measures assist our management and investors by increasing the
comparability of our performance from period to period. The Partnership believes that including EBITDA, Adjusted EBITDA, Adjusted
Profit and Adjusted EPU assists our management and investors in (i) understanding and analyzing the results of our operating and
business performance, (ii) selecting between investing in us and other investment alternatives and (iii) monitoring our ongoing financial
and operational strength in assessing whether to purchase and/or to continue to hold our common units. This increased comparability is
achieved by excluding the potentially disparate effects between periods of, in the case of EBITDA and Adjusted EBITDA, financial costs,
gain/loss on derivatives, taxes, depreciation and amortization; in the case of Adjusted EBITDA, impairment loss on vessels and
restructuring costs and, in the case of Adjusted Profit and Adjusted EPU, non-cash gain/loss on derivatives, write-off and accelerated
amortization of unamortized loan fees, impairment loss on vessels and restructuring costs, which items are affected by various and
possibly changing financing methods, financial market conditions, general shipping market conditions, capital structure and historical cost
basis and which items may significantly affect results of operations between periods. Restructuring costs are excluded from Adjusted
EBITDA, Adjusted Profit and Adjusted EPU because restructuring costs represent charges reflecting specific actions taken by
management to improve the Partnership’s future profitabilit and therefore are not considered representative of the underl ing operations
of the Partnership. Impairment loss is excluded from Adjusted EBITDA, Adjusted Profit and Adjusted EPU because impairment loss on
vessels represents the excess of their carrying amount over the amount that is expected to be recovered from them in the future and
therefore is not considered representative of the underlying operations of the Partnership.

 EBITDA, Adjusted EBITDA, Adjusted Profit and Adjusted EPU have limitations as analytical tools and should not be considered as
alternatives to, or as substitutes for, or superior to, profit, profit from operations, earnings per unit or any other measure of operating
performance presented in accordance with IFRS. Some of these limitations include the fact that they do not reflect (i) our cash
expenditures or future requirements for capital expenditures or contractual commitments, (ii) changes in, or cash requirements for, our
working capital needs and (iii) the cash requirements necessary to service interest or principal payments on our debt. Although
depreciation and amortization are non-cash charges, the assets being depreciated and amortized will often have to be replaced in the
future and EBITDA and Adjusted EBITDA do not reflect any cash requirements for such replacements. EBITDA, Adjusted EBITDA,
Adjusted Profit and Adjusted EPU are not adjusted for all non-cash income or expense items that are reflected in our statement of cash
flows and other companies in our industry may calculate these measures differently to how we do, limiting their usefulness as
comparative measures. EBITDA, Adjusted EBITDA, Adjusted Profit and Adjusted EPU exclude some, but not all, items that affect profit
or loss and these measures may vary among other companies. Therefore, EBITDA, Adjusted EBITDA, Adjusted Profit and Adjusted EPU
as presented herein may not be comparable to similarly titled measures of other companies. The following tables reconcile EBITDA,
Adjusted EBITDA, Adjusted Profit and Adjusted EPU to Profit, the most directly comparable IFRS financial measure, for the periods
presented.

In evaluating EBITDA, Adjusted EBITDA, Adjusted Profit and Adjusted EPU you should be aware that in the future we may incur
expenses that are the same as or similar to some of the adjustments in this presentation. Our presentation of EBITDA, Adjusted
EBITDA, Adjusted Profit and Adjusted EPU should not be construed as an inference that our future results will be unaffected by the
excluded items.

June 2021 | Investor Presentation                                                                                                              28
You can also read