Fourth Quarter 2020 Earnings Call - Inspired Packaging. A World of Difference - February 2, 2021

Page created by Tom Stewart
 
CONTINUE READING
Fourth Quarter 2020 Earnings Call - Inspired Packaging. A World of Difference - February 2, 2021
Fourth Quarter 2020 Earnings Call
February 2, 2021

Michael P. Doss                         Stephen R. Scherger
President and Chief Executive Officer   Executive Vice President and Chief Financial Officer

Inspired Packaging. A World of Difference.
Fourth Quarter 2020 Earnings Call - Inspired Packaging. A World of Difference - February 2, 2021
FORWARD LOOKING STATEMENTS
CAUTIONARY STATEMENT REGARDING FORWARD-LOOKING STATEMENTS
Any statements of the Company's expectations in these slides, including but not limited to projected organic sales and EBITDA growth, timing of the new CRB
machine start-up in Kalamazoo, Michigan, and the planned investment in the Texarkana, TX SBS mill constitute "forward-looking statements" as defined in the
Private Securities Litigation Reform Act of 1995. Such statements are based on currently available information and are subject to various risks and
uncertainties that could cause actual results to differ materially from the Company's present expectations. These risks and uncertainties include, but are not
limited to, the effects of the Covid-19 pandemic on the Company’s operations and demand for its products, inflation of and volatility in raw material and energy
costs, continuing pressure for lower cost products, the Company’s ability to implement its business strategies, including productivity initiatives, cost reduction
plans, and integration activities, as well as the Company’s debt level, currency movements and other risks of conducting business internationally and the
impact of regulatory and litigation matters, including the continued availability of the Company’s U.S. federal income tax attributes to offset U.S. federal income
taxes and the timing related to the Company’s future U.S. federal income tax payments. Undue reliance should not be placed on such forward-looking
statements, as such statements speak only as of the date on which they are made and the Company undertakes no obligation to update such statements,
except as required by law. Additional information regarding these and other risks is contained in the Company's periodic filings with the SEC.
.

NON-GAAP FINANCIAL MEASURES
This presentation includes certain financial measures that exclude or adjust for charges or income associated with business combinations, facility shutdowns,
extended mill outages, sales of assets and other special charges or income. The Company’s management believes that the presentation of these financial
measures provides useful information to investors because these measures are regularly used by management in assessing the Company’s performance.
These financial measures are not calculated in accordance with generally accepted accounting principles in the United States (“GAAP”) and should be
considered in addition to results prepared in accordance with GAAP, but should not be considered substitutes for or superior to GAAP results. In addition,
these non-GAAP financial measures may not be comparable to similarly-titled measures utilized by other companies, since such other companies may not
calculate such measure in the same manner as we do. A reconciliation of these measures to the most relevant GAAP measure is available in our latest
earnings press release which can be found in the Investors section on the Graphic Packaging website at www.graphicpkg.com.

                                          ©2021 Graphic Packaging International                                                                                       2
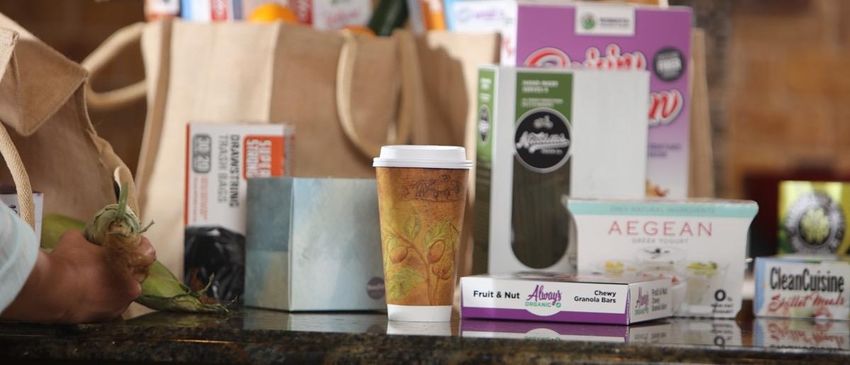
Fourth Quarter 2020 Earnings Call - Inspired Packaging. A World of Difference - February 2, 2021
2020 HIGHLIGHTS

• Vision 2025 Goals on Track with Solid Execution of Initiatives & Strong Financial Performance

• Showcased Corporate Responsibility & Long-Standing Commitment to Sustainability in ESG Report

• Strong Pivot to Growth, Net Organic Sales Increased 4% Year over Year

• Achieved Pre-Pandemic EBITDA Guidance; Exceeded Cash Flow Guidance

• Maintained Supply Chain Continuity for Customers; Delivered to Changing Demand Patterns

• Accelerated Multiple Strategic Business Decisions to Drive Results

• Instituted Protocols to Promote Employee Health and Safety

• Demonstrated Commitment to Production Employees with Special Bonuses and Our Communities
  with Food Bank Contributions

• Increased Paperboard Integration Rate to 70% from 68% in 2019

• Returned Over $900 Million to Stakeholders

                              ©2021 Graphic Packaging International                               3
Fourth Quarter 2020 Earnings Call - Inspired Packaging. A World of Difference - February 2, 2021
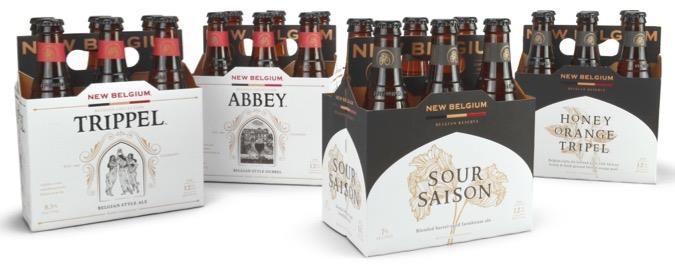
POSITIONED FOR CONTINUED GROWTH IN 2021

• Expect to Grow Sales, EBITDA and ROIC Consistent with Vision 2025 Goals

• Focused on Winning in Growing Markets; Targeting 100 – 200 Basis Points of Net Organic Sales Growth

• Accelerating Execution of Sustainability Supported, Innovative Packaging Solutions

• Pulling Forward New CRB Machine Start-up to Q4 2021; $100M Projected Benefit to EBITDA, Expect to
  Capture 1st $50M in EBITDA Benefit in ‘22 and 2nd $50M in EBITDA Benefit in ‘23

• Investing $100M in Texarkana, TX Mill to Increase Strategic Flexibility Across Both SBS and CUK Substrates
  (Swing Machine) While Meeting Global Demand For CUK Packaging Solutions

• Advancing ESG Initiatives: Sustainability in Operations; New and Innovative Sustainable Packaging
  Solutions; Employee Development and Community Engagement Programs

                             ©2021 Graphic Packaging International                                             4
Fourth Quarter 2020 Earnings Call - Inspired Packaging. A World of Difference - February 2, 2021
Q4 2020 SUMMARY

FINANCIAL PERFORMANCE                                        MARKETS & OPERATIONS                        CAPITAL ALLOCATION
• Q4 net sales $1.7B, up 9% y/y                                 • Q4 net organic sales up 5% y/y         •   Returned $90M to stakeholders
  o Food, Beverage & Consumer sales                                  o Q4 net organic sales growth           o $68M common share repurchase
    up 16% y/y (up 9% before                                           driven by continued conversions       o $22M in dividends and
    acquisitions)                                                      to GPK paperboard packaging             distributions
  o Foodservice sales down 10% y/y                                     solutions and at-home food and    •   Invested $221M in capital
• Q4 pricing unfavorable $11M and net                                  beverage consumption                  expenditures to support strategic
  commodity input cost inflation of $8M;                        • AF&PA Q4 operating rate for SBS            investments
  $21M positive price/cost relationship                           was 96%, CRB was 92%; GPK Q4           •   Significant liquidity of $1.7B;
  for the year                                                                                               borrowing effectively and
                                                                  CUK operating rate 95%+
• Q4 net performance of $25M driven                                                                          maintaining ample balance sheet
  by cost efficiencies, benefits from                           • Backlogs at 5+ weeks for SBS,              flexibility
  capital projects and synergy capture                            CRB, and CUK
                                                                                                         •   Year-end net leverage ratio of 3.26x
• Q4 Adj. EBITDA $265M
• Q4 Adj. EPS $0.28, up 22% y/y

                                   ©2021 Graphic Packaging International                                                                            5
Fourth Quarter 2020 Earnings Call - Inspired Packaging. A World of Difference - February 2, 2021
INCREASED DEMAND FOR SUSTAINABLE PACKAGING IN OUR GROWTH
MARKETS; DRIVES 100-200BPS OF ORGANIC SALES GROWTH PER YEAR
                                            $7.5 BILLION ADDRESSABLE MARKET
PLASTIC SUBSTITUTION                                       COOKING SOLUTIONS               STRENGTH PACKAGING
Foodservice Cups and Cartons                              Microwave Technologies           Club Stores and Mass Retailers

Beverage Multi-packs
                                                          Paperboard Bowls and Trays       E-commerce (SIOC)

Food Trays
(non cooking)

                                                                       PLATFORM ENABLERS
 PACKAGING DESIGN AND
 PREMIUMIZATION

                               ©2021 Graphic Packaging International                                                        6
Fourth Quarter 2020 Earnings Call - Inspired Packaging. A World of Difference - February 2, 2021
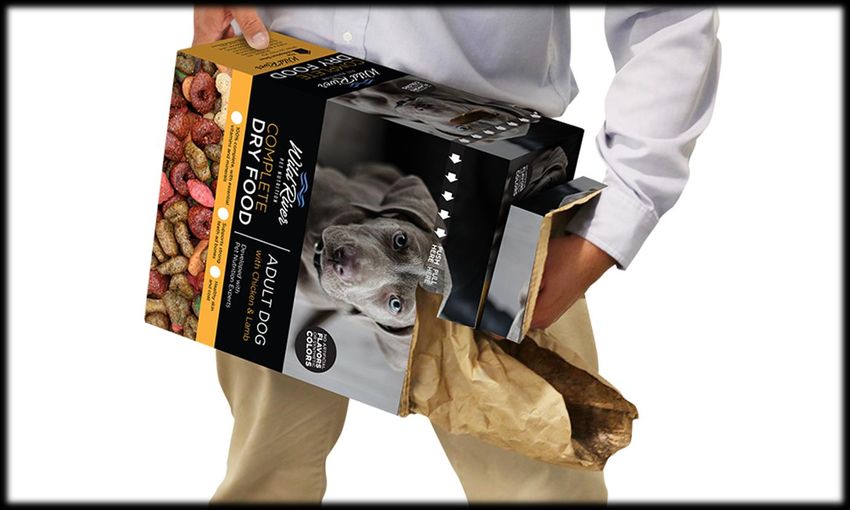
STRENGTH PACKAGING SOLUTIONS ADDRESS OMNI-CHANNEL
DISTRIBUTION REQUIREMENTS; DELIVERS EFFICIENCY BENEFITS

                                                        INTEGRAFLUTETM
                                                        • Omni-channel solution with
                                                          sustainable structure that is sturdy
                                                          and brand enhancing
                                                        • Easily processed through
                                                          e-commerce fulfillment centers;
                                                          improving handling and delivery
                                                        • Ships In Own Container (SIOC)
                                                          increases efficiency while lowering
                                                          cost, waste, materials and supply
                                                          chain challenges
                                                        • Wide range of markets including
                                                          pet care, home and garden, pool
                                                          care, briquettes/wood pellets and
                                                          other consumer bulk items

                ©2021 Graphic Packaging International                                       7
Fourth Quarter 2020 Earnings Call - Inspired Packaging. A World of Difference - February 2, 2021
INVESTMENT IN TEXARKANA, TX TO INCREASE STRATEGIC FLEXIBILITY
ACROSS SBS & CUK WHILE MEETING CONTINUED STRONG DEMAND FOR CUK

                                                                                                                 TEXARKANA PROJECT OVERVIEW
                                                                                                                 • Flexible, swing machine capable of
                                                                                                         1,710     producing CUK or SBS
                                                                                                           90
                                                                                                                 • $100M investment
                                                                                                                 • Expect to capture $20M in EBITDA
                                                                                                                   benefit over 3 years from margin
                                                                                                                   improvement
                                                                                                         1,620
 1,260
                                                                                                                 • Start-up of swing production in Q1 ‘22
                                                                                                                 • Supports global CUK growth
                                                                                                                 • Overall capacity neutral
 2008    2009   2010   2011   2012   2013    2014          2015          2016       2017   2018   2019   2020
                                                                                                                 • 300K ton production capacity on
           CUK Tonnage (Mill Production in 000s)                 CUK Conversion to SBS (000s)                      existing SBS machine (no change)

                                            ©2021 Graphic Packaging International                                                                    8
Fourth Quarter 2020 Earnings Call - Inspired Packaging. A World of Difference - February 2, 2021
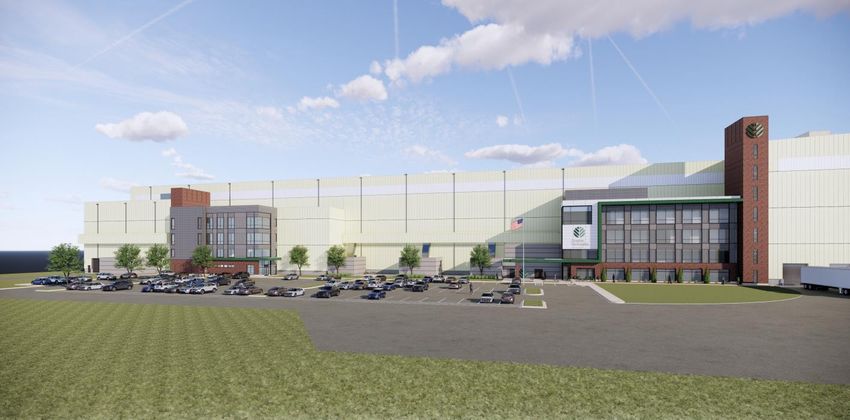
ACCELERATING START UP OF NEW CRB MACHINE

                                                            KALAMAZOO PROJECT UPDATE
                                                            • Start-up paperboard production on new
                                                              machine in Q4 ‘21, ahead of schedule
                                                            • $100M projected benefit to EBITDA
                                                              o Expect to capture 1st $50M in ‘22
                                                              o Expect to capture 2nd $50M in ‘23

                                                            • Multiple benefits:
                                                              o Increased CRB integration
                                                              o Best in class cost structure
                                                              o Lowest basis weight and caliper
                                                                profile in North America
               K2 CRB Machine Hall and Campus (Rendering)     o Highest quality CRB sheet in the
               Kalamazoo, Michigan
                                                                market
                                                              o Reduced environmental impact

               ©2021 Graphic Packaging International                                                9
Fourth Quarter 2020 Earnings Call - Inspired Packaging. A World of Difference - February 2, 2021
RUNNING A DIFFERENT RACE- WINNING WITH SUSTAINABILITY
 SUPPORTED INNOVATION IN GROWING MARKETS, FOCUSED ON
 EXECUTION AND DELIVERING ON OUR VISION 2025 GOALS
                                                                             Grow Converting Volume
                                                                             •   Sustainability supported organic sales growth
                                                                             •   Targeted share gains
                                                                             •   Select tuck-under acquisitions
New Product Innovation                                                                                                    Fill the   Mills, Increase Integration Rates
                                                                             •   Transformational M&A
• Expand new product development                                                                                         • Reduce system volatility
  capabilities to accelerate growth                                                                                      • High fixed-cost utilization
• Sustainable new product development to                                                                                 • Skilled and stable workforce
  support circular economy
• Growth platforms that build upon each
  other every year (optimizing Opex / Capex)

Enhance Process Capabilities                                                                                               Long-Term Strategic Investments
                                                                                          Model
                                                                                      Drives EBITDA                        • New CRB machine and consolidation project
• Drive process innovation to reduce costs
                                                                                                                             (Kalamazoo)
• Enable supply chain to create differentiated,                                        & Cash Flow                         • Substrate flexibility to capture growth
  winning customer experiences                                                                                               (Texarkana)
• Increase talent development capabilities                                                                                 • Global beverage converting platform
• Improve business services capabilities                                                                                     (Monroe, Sneek)

                                         ©2021 Graphic Packaging International                                                                                     10
FULL YEAR 2020 FINANCIAL RESULTS

                                                                                                                           DELIVERING STRONG RESULTS
            (US$ M)                                            2020                              2019   % Chg
                                                                                                                           • Net Sales up 6% y/y
                                                                                                                             o Net Organic Sales(2) up 4% y/y
            Net Sales                                    $6,560                         $6,160            +6%
                                                                                                                           • Adj EBITDA $1,070M up 4% y/y
            Adj. EBITDA                                  $1,070                         $1,030            +4%                o EBITDA margin impacted by SBS cup
                                                                                                                               market downtime & timing of synergy
            Adj. EBITDA Margin                            16.3%                          16.7%          -40bps                 achievement from 2020 tuck-under
                                                                                                                               acquisitions
            Adj. EPS                                        $1.12                          $0.87        +29%
                                                                                                                           • Adj. EPS $1.12 up 29% y/y, benefitted
            Global Liquidity                             $1,717                         $1,557          +10%                 by acquisition of partnership interest
                                                                                                                             and continued repurchase of GPK
            Integration Rate (1)                               70%                               68% +200bps
                                                                                                                             shares

                                                                                                                           • $1.7B in Global Liquidity
(1) Integration rate is defined as paperboard we produce which is converted in manufacturing facilities we operate.
(2) Net organic sales = Net sales – open market sales – sales from acquisitions closed within the last 12 months - pricing – FX impact
Adjusted figures and global liquidity represent non-GAAP measures. Please refer to earnings press release for reconciliations to GAAP measures.

                                                         ©2021 Graphic Packaging International
                                                                                                                                                                      11
2020 NET SALES PERFORMANCE

                                                          +6%

$s in millions

                  ©2021 Graphic Packaging International         12
Q420 NET SALES PERFORMANCE

                                                          +9%
$s in millions

                  ©2021 Graphic Packaging International         13
2020 ADJUSTED EBITDA PERFORMANCE

$s in millions                                               +4%

                                                                   Net Productivity $57M
                                                                   Market / Maintenance
                                                                   Downtime ($15M)

                     ©2021 Graphic Packaging International                                 14
Q420 ADJUSTED EBITDA PERFORMANCE

$s in millions                                              +2%

                    ©2021 Graphic Packaging International         15
2021 ADJUSTED EBITDA AND CASH FLOW GUIDANCE

        Adjusted EBITDA $1,090M - $1,150M                                                                  Cash Flow $175M - $250M

EBITDA Components                                                                              Cash Flow Components

Volume/Mix                                                                       $10M - $40M   Cap Ex                                           ($710M - $690M)
Net Performance                                                                  $70M - $90M   Interest                                         ($130M - $120M)
L&B / Other(1)                                                               ($60M - $50M)     Tax                                                 ($45M - $35M)
FX(2)                                                                        ($10M) - $10M     Working Capital                                     ($30M - $10M)
Price to Commodity Input Cost Spread                                         ($20M) - $20M     Pension                                             ($20M - $10M)

                                                                                                 Return to Substantial Cash Flow in 2022
                                                                                                  Cap Ex ($M)

                                                                                                     $ 350          $ 646           $ ~700            $ ~400
(1) Other inflation is primarily related to property insurance                                         2019            2020              2021             2022
(2) FX range at current rates
                                                                                                Consistent with Vision 2025, normalized capex target (% of sales) of ~5%

                                                  ©2021 Graphic Packaging International                                                                           16
CONSISTENT EBITDA GROWTH AND SIGNIFICANT RETURNS TO
    STAKEHOLDERS DRIVE VALUE CREATION PER GPK SHARE/IP UNIT
                                                                                         Adj. EBITDA/GPK Shares + IP
    Adj. EBITDA $s in millions
                                                                                         Partnership Units(1)

                                                                                $1,070                                                                       $3.40
      Combined with IP’s                   $1,030
      Consumer Business
      Jan 1, 2018                $971

                                                                                                                                       $2.78
                                                                                                                 $2.56
           $712                                                                            $2.30

           2017                  2018       2019                                2020       2017                 2018                   2019                  2020
                                                                                                                      GPK              IP         Total
MAJOR DRIVERS                                                                                 (in millions)         Shares(1)        Units(1) Shares/Units(1)
•    Net organic sales growth                                                                  2017                    310               -              310
•    Productivity greater than labor/benefits inflation                                        2018                    300              80              380
•    Neutral price-cost relationship over time                                                 2019                    290              80              370
•    Acquisition of partnership interest & share repurchases                                   2020                    268              47              315

                                                                                            (1) GPK shares outstanding and IP partnership units as of year end
                                        ©2021 Graphic Packaging International                                                                                        17
APPENDIX
2021 YEAR OVER YEAR IMPACT SCHEDULE AND OTHER GUIDANCE

                                                                                                                                                                                 2019              2020              2021
NET PRICE / COMMODITY INPUT COST SPREAD &                                                                                                                                       Actual            Actual           Guidance
NET OUTAGE COST IMPACT Y/Y
Changes ($M)                                                                                                              Pension Expense/(Income)(1)                            $16M              $14M             $13M
                                                                                                                          (includes pension amortization)
                                Q1                     Q2                          Q3                 Q4
                                                                                                                          Depreciation & Amortization(2)                        $447M             $450M             $460M
Net Price/Cost                                                                                                            (excluding pension amortization)
Spread Impact
                                                                                                                          Pension Amortization                                   $10M               $6M              $5M
Net Outage Cost
Impact                        ($10M)                   $0M                       $15M                 $15M
                                                                                                                          Effective Tax Rate(3)                                   26%               19%            24-26%
                                                                                                                          (Normalized)

                                                                                                                          Year End Net Leverage Ratio                             2.6x              3.3x           3.0-3.5x

   (1) 2019 and 2020 pension expense exclude $39 million and $154 million of non-cash pension plan settlement charges, respectively.
   (2) 2019 D&A includes $5 million of accelerated deprecation. 2020 D&A actual and 2021 D&A guidance excludes $26 million and $24 million of accelerated depreciation related to exit activities, respectively.
   (3) Tax rate applied to GPHC’s share of the partnership earnings.

                                                              ©2021 Graphic Packaging International

                                                                                                                                                                                                                       19
SUPPLEMENTAL INFORMATION

  COMMODITY ANNUAL CONSUMPTION                                     2020 REVENUE BY CURRENCY

     Categories                            Units                               6%   1%
                                                                         6%
     Wood                                      10
     (Million tons)                                                 2%                         USD
     Recycled Fiber                              1             3%                              AUD
     (Million tons)                                           1%
                                                                          0%                   NZD
     Natural Gas                               22             2%                               BRL
                                                                         0%
     (MMBTU)                                                                                   CAD
     Caustic Soda                              40                                              CNY
     (000, tons)                                                                               MXN
     Starch                                   150                                              GBP
     (Million lbs.)
                                                                                               EUR
     TiO2                                      25                                        79%   JPY
     (Million lbs.)
     Polyethylene                             105
     (Million lbs.)

                                                                                                     20
                      ©2021 Graphic Packaging International
You can also read