FLUGHAFEN WIEN AG Traffic Results 2021 and Business Outlook for 2022 - Online press conference, 18 January 2022 - Public Technologies
←
→
Page content transcription
If your browser does not render page correctly, please read the page content below
FLUGHAFEN WIEN AG
Traffic Results 2021 and
Business Outlook for 2022

  Online press conference, 18 January 2022
Pandemic continues to impact the aviation
sector but upturn is on the horizon
Vienna Airport registers 10.4 million passengers in 2021, up 33.2% from 2020 but still
67.1% lower than the pre-crisis year of 2019 – 13.1 million passengers handled by the
Flughafen Wien Group
Much better development of cargo volume in 2021: rise of 19.9% vs. 2020, only 7.9% below
2019
Outlook 2022:
➢ Vienna Airport: approx. 17 million travellers (about 50% of 2019 level) – Q1 still
restrained, considerable upswing expected starting with the summer flight schedule
➢ Flughafen Wien Group: about 21 million passengers
➢ Financial guidance: revenue of approx. € 560 million, EBITDA of at least € 172 million
and earnings of at least € 20 million
The desire to travel remains unbroken and high – easing of travel restrictions directly results
in passenger growth, but Europe still suffers from a patchwork of regulations – business and
tourism require unified travel rules throughout Europe
Vienna Airport continues its climate protection efforts, is well on track towards achieving CO₂
neutrality
2
Traffic development in 2021
Flughafen Wien AG
    Traffic development at                                     Δ%       Δ%
                                     2021    2020    2019
    Vienna Airport                                            2020     2019
    Passengers (millions)             10.4     7.8    31.7   +33.2     -67.1
    Local passengers (millions)        7.8     6.3    24.3   +24.6     -67.7
    Transfer passengers (millions)     2.5     1.5     7.2   +67.9     -65.0
    Flight movements (in 1,000)      111.6    95.9   266.8   +16.4     -58.2
    Passengers per flight
                                       99      87     121    +13.9     -18.8
    movement
    Seats (arrivals and
                                      16.7    13.6    41.1   +22.6     -59.4
    departures, millions)
    Seat load factor (%)              62.5    57.4    77.3   +5.1p.   -14.8p.
    Seats per flight movement         158     151     157     +4.6      +0.5
    MTOW (millions of tonnes)          4.7     4.0    10.9   +18.7     -56.5
    Cargo incl. trucking (in 1,000
                                     261.3   217.9   283.8   +19.9       -7.9
    tonnes

3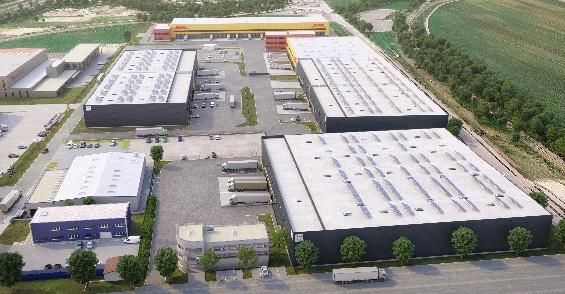
Traffic development in 2021
Flughafen Wien Group
    Group passenger                                                                                      Δ%           Δ%
                                                            2021            2020            2019
    development                                                                                         2020         2019
       Vienna Airport (millions)                             10.4              7.8           31.7       +33.2        -67.1
       Malta Airport (millions)                                2.5             1.7                7.3   +45.3        -65.2
       Kosice Airport (millions)                               0.2             0.1                0.6   +72.7        -70.0
    Vienna Airport and its
    strategic investments (VIE,                              13.1              9.7           39.5       +35.8        -66.8
    MLA, KSC)

             Share of passengers in the Group                                         VIE         MLA    KSC

2021                                                    80%                                               19%         1%

    PAX in
    mill.    0                                                   6                                              12
4                The total number of passengers includes local, transfer and transit passengers
                 Adjustment of comparative figures for 2020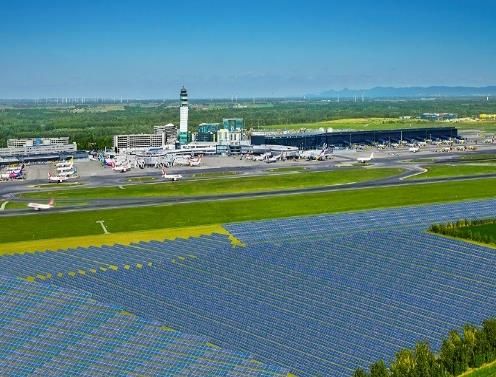
Share held by carriers in 2021

     2021                                          Share          Passengers             PAX Δ% vs.   PAX Δ% vs.
                                                    in %                                      2020         2019
    1. Austrian Airlines                             48.0            4,995,915                 65.2        -63.5
    2. Ryanair/Lauda                                 18.8            1,956,721                 68.9        -26.4
    3. Wizz Air                                       8.7              903,850                  4.5        -56.6
    4. Turkish Airlines                               3.1              318,256                 54.5        -42.2
    5. Eurowings                                      1.8              188,188                -48.1        -91.7
    6. KLM Royal Dutch Airlines                       1.7              171,778                 45.7        -54.7
    7. Pegasus Airlines                               1.5              155,002                 62.8        -46.9
    8. Emirates                                       1.4              149,503                 25.0        -64.0
    9. Lufthansa                                      1.4              148,068                -35.1        -79.7
    10. SunExpress                                    1.2              126,441                176.0        -50.8
    11. SWISS                                         1.2              122,922                  1.2        -72.4
    12. Iberia                                        0.9               96,067                 62.7        -68.4
    13. Air France                                    0.8               79,763                 -9.5        -74.6
    14. Ethiopian Airlines                            0.7               71,215                 74.2        -47.9
    15. Aeroflot                                      0.6               63,480                 -7.2        -81.8
    Other                                             8.2              858,354                -29.2        -87.4
    Total                                          100.0            10,405,523                 33.2        -67.1
                                 1
       thereof Lufthansa Group                       52.9            5,509,617                 46.0        -68,2
       thereof low-cost carriers                     31.0            3,224,205                 28.5        -57.9

5             1Lufthansa   Group: Austrian Airlines, Brussels Airlines, Eurowings, Lufthansa and
              SWISS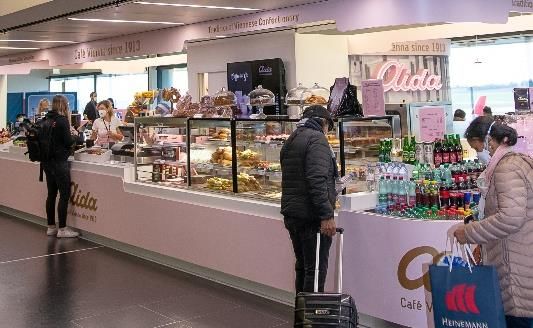
Airport slowly gains altitude again in 2021
 after the “Corona grounding”
                                                           Europe
                                                           +35.7%
                                 thereof Western Europe    90.0%        thereof Eastern Europe
      Growth driven by Austrian Airlines and
  Ryanair, especially to countries with a high   +29.9%                 +61.1%        Growth by Austrian and Ryanair, above all to
   share of vacation destinations e.g., Spain,   70.2%                   19.7%        Pristina, Tirana, Podgorica and Bucharest OTP
                             Greece and Italy
                                                                                                                                Far East
                                                                    Ongoing difficult market environment, especially -66.4%
                          North America                                 as a result of travel restrictions to Thailand,
Growth due to resumption of                                                                  Taiwan, India and China    0.7%
             flight service by     +92.8%
Air Canada, Austrian Airlines;      2.6%                                Middle East
     gradual market openings
                                                                        +43.6%        Mainly by Austrian Airlines, Ryanair and
                                                                          4.8%        Emirates to Tel Aviv, Dubai and Amman

                            Latin America                  Africa
                                                                       Passenger decline by Austrian Airlines and Ryanair,
Austrian launches flight service    >500%                  -4.7%       especially to Marrakech, Cape Town and Marsa
                      to Cancún        0.1%                 1.8%       Alam; in contrast, growth on flights to Cairo,
                                                                       Hurghada and Addis Ababa

                                                                                                   2021: 66 airlines serve 190
                                                                                                   destinations in 63 countries
     Passenger development compared to the previous year
     Share of total passenger volume                        Departed passengers, development in 2021 vs. 2020 and share of total passenger volume in 2021

 6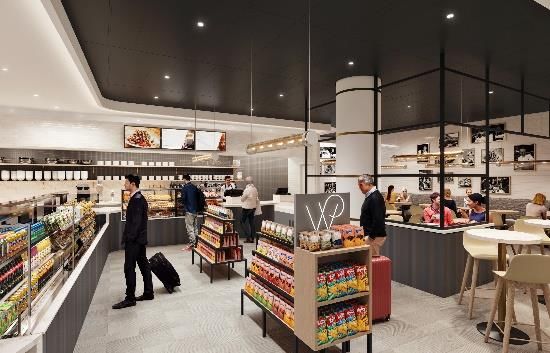
Strong demand for Mediterranean
destinations

                                                                Top 3 winners in terms of change vs. 2020

                                                                Countries     01-12/20 01-12/21        Δ 2020   Δ% 2020
     Top 10 countries in 2021:
                                                              1 Spain           513,612     932,853 +419,241      +81.6
     Countries     01-12/20      01-12/21    Δ 2020 Δ% 2020
                                                              2 Greece          426,884     828,914 +402,030      +94.2
 1 Germany         1,495,208     1,490,608   -4,600    -0.3   3 Turkey          347,083     640,074 +292,991      +84.4
 2 Spain            513,612       932,853 +419,241    +81.6
 3 Greece           426,884       828,914 +402,030    +94.2
 4 Italy
 5   Turkey
                    476,871
                    347,083
                                  714,146 +237,275
                                  640,074 +292,991
                                                      +49.8
                                                      +84.4
                                                                                                +
 6   France         331,387       418,795 +87,408     +26.4
 7   Switzerland    392,724       418,258 +25,534      +6.5
 8
 9
     Netherlands
     UK
                    296,291
                    332,426
                                  338,827 +42,536
                                  245,946  -86,480
                                                      +14.4
                                                      -26.0
                                                                                                -
10   Romania        150,267       243,646 +93,379     +62.1
                                                                Top 3 losers in terms of change vs. 2020:
                                                                                                                    Δ%
                                                                Countries    01-12/20     01-12/21     Δ 2020
                                                                                                                  2020
                                                              1 UK             332,426     245,946    -86,480     -26.0
                                                              2 Thailand        79,171      14,983    -64,188     -81.1
                                                              3 Taiwan          55,443         437    -55,006     -99.2

7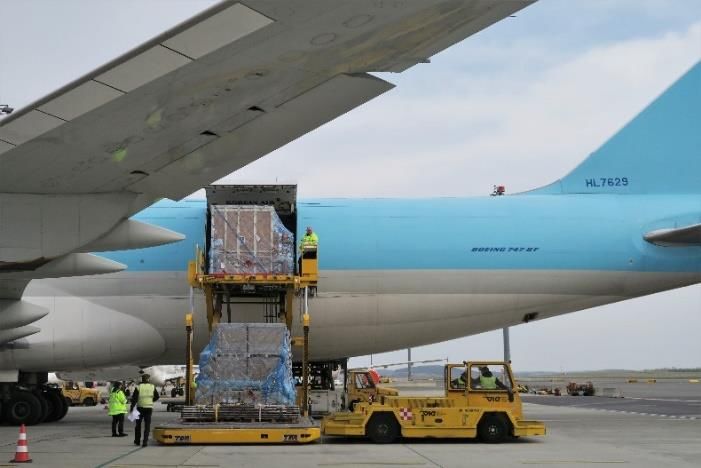
Average passenger volumes
Ø PAX/day by month in 2021
Strongest day 2021: 68,901 (Sunday 1 August 2021)
vs. 2020 (after outbreak of the pandemic): 31,675 (Sunday 16 August 2020)
vs. 2019: 113,069 (Sunday 14 July 2019)
Weakest day 2021: 1,503 (Tuesday 9 March 2021)
vs. 2020: 154 (Monday 13 April 2020)
vs. 2019: 41,343 (Saturday 19 January 2019)
2021 57 400 Ø PAX/day by month
52 500 50 700
47 600
37 200
29 700
24 200
12 900
7 000 9 000
6 400 5 700
JAN FEB MAR APR MAY JUN JUL AUG SEP OCT NOV DEC
8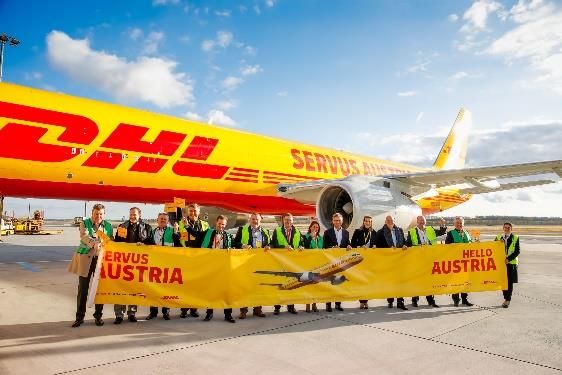
Recovery due to vaccinations and Green Pass
CW 20 (17/5 – 23/5) – CW 28 (12/7 – 18/7)
Passenger volumes were up 237% from CW20 to CW28
Pax total 2019 Pax total 2021 Diff. to 2019
800 000
700 000
600 000
500 000
400 000
-53.3%
300 000 -57.6%
-64.6%
200 000 -71.1%
-74.6% +237%
-79.7% -78.4%
100 000 -83.0%
-84.8%
0
CW20 CW21 CW22 CW23 CW24 CW25 CW26 CW27 CW28
“Green Pass” valid in the
Begin of Phase 1 of the EU as of 1 July More than
“Green Pass” (launch of Entry into Austria possible 50% of
Begin of Phase 2 of the
“3G rule”) with 3G proof (vaccinated, Austrian Foreign Ministry vaccinable
“Green Pass”
recovered or tested) from ends global travel people
(digitalisation)
Re-opening e.g. of most EU member states warning; easier entry to already
restaurants, leisure and Austria from third received
tourism industry in AT countries their first
Start of the summer vaccination
holidays
9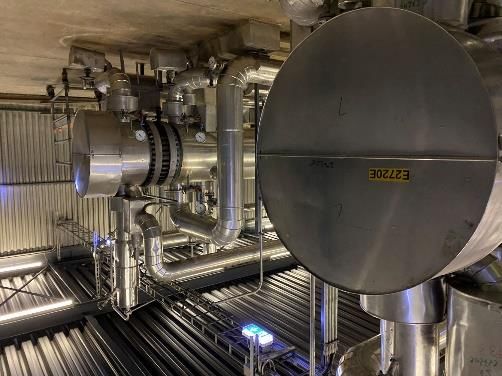
Peak 2021 air traffic congestion almost 90%
of 2019 level, only 70% of flight movements
Challenge for the entire airport system
Greater peak hour air traffic congestion
70 Flight movements
538
61
60
54 54 88.5%
88.9% 48
50 791
40
30
20
10
0
04:00 06:00 08:00 10:00 12:00 14:00 16:00 18:00 20:00 22:00
Comparison of peak day 2021 vs. 2019 flight movements
10 Dotted line = actual situation in 2019Vienna Airport is the most punctual flight
hub in the EU and ranks third in Europe
11 EU and European hub airports >20 million PAX in 2019
Source: OAG
(Chart in German)Air cargo has developed well in the crisis
2021: increase in cargo traffic of 20%
(+43,412 tonnes) to 261,299 tonnes
➢ 4% rise in cargo plane arrivals (+21% vs.
2019)
➢ Consistently strong charter traffic (in particular
Corona tests, charter flights only for shipping)
➢ Vienna Airport guarantees supply reliability in
the pandemic and is accessible 24x7
Slight rise expected in 2022
➢ Strong increase in belly freight due to
resumption of some long-haul flight
connections
➢ Ongoing high frequency of cargo flights with
good capacity utilisation – Vienna is a high-
performance air cargo hub with good road
connections especially to CEE
12Special offering is well received: Cargo
increase in the Pharma Handling Center
The Pharma Handling Center at VIE serves as
a competence centre for temperature-sensitive
cargo
➢ Three separate cooling areas of 1,650m²
➢ Continuous cold chain from aircraft to lorry
Successfully positioned on the market:
➢ 2021: extensive handling agreements
concluded with Lufthansa Cargo (incl. transit
cargo) and with Turkish Cargo
➢ Strong volume growth in 2021, above all in Q4
(+100%)
➢ Ongoing shipment of vaccine doses
➢ High quality standards confirmed by
international GDP certification
➢ 2022: strong growth expected
13Stringent and comprehensive COVID-19
protective measures at the airport
Strict measures are in effect at the airport to protect
passengers and employees:
In the terminal: Mask obligation, minimum physical
distancing recommendation, 280 plexiglass shields, 110
disinfectant dispensers, government-imposed inspection
requirements for restaurants and shops
Since May 2020: antigen and PCR test offering in the
Health Center provides support in fulfilling official testing
requirements for inbound passengers
Stringent and comprehensive entry checks by public
authorities (army and border police on behalf of health
authorities)
➢ All incoming passengers are checked
(about 15,000 PAX per day)
➢ More than 300 employees are deployed
Airport boasts 90%+ immunisation coverage
(vaccinated/recovered), separate teams in crucial areas, home
office work since March 2020
14Top brands open at the airport despite
the crisis
New openings on close to 500m² in spite of the
crisis
Passengers experience more national cuisine in
the departure area of Terminal 3:
➢ AIDA at the F and G gates in addition to the
existing store in Terminal 1
➢ Manner offers its typical product line and
souvenirs at the F gates
➢ Wiener Bierbar 1837 serves Ottakringer
beer and snack at the G gates
The German superfood franchise dean&david
opened a shop in the arrival hall of Terminal 3
15Local heroes turn to Vienna Airport: even
more national stars to open in 2022
Spring 2022 in Terminal 3:
➢ Wolfgang Puck opens the Wolfgang Puck
Kitchen & Bar on 700m² in the arrival hall, his
first Austrian restaurant
In the course of 2022:
➢ Bieder & Maier, the stylish Viennese coffee
house brand, to open its first Austrian coffee
house in the Terminal 3 departure hall
Opening when Terminal 2 is put into operation:
➢ Veganista/The LaLa: Top-notch vegan food on
50 m²
➢ Comeback of Trzesniewski at VIE
16Outlook for 2022: Optimistic but with
several question marks
We expect weaker effects of the global COVID-19 pandemic thanks to
high immunisation rates
Steady easing of travel restrictions in Europe and also more frequently for
intercontinental flights
Promising summer flight schedule with an extensive offering1:
➢ Italy, Spain, Greece, Turkey: almost as many destinations as in 2019
➢ Likely capacities offered: about 80% of 2019 level
➢ 50-60 airlines with 170-180 destinations to 60 countries
Possible medium- to long-term burdens on the aviation sector imposed
by the “Fit for 55” initiative: planned tax on jet fuel, higher emission trading
costs
17 1Benchmark week CW32 2022, Status: January 2022Traffic forecast for 2022
Flughafen Wien Group: Forecast
2019 2020 2021 2022
Passengers: 39.5 mill. 9.7 mill. 13.1 mill. ca. 21 mill.
Flughafen Wien AG: 2019 2020 2021 Forecast
2022
Passengers: 31.7 mill. 7.8 mill. 10.4 mill. ca. 17 mill.
182022: approx. 17 million passengers
Expected quarterly development compared to 2019
3,000,000
Q1: ca. Q2: ca. Q3: ca. Q4: ca.
30% 45% 75% 60%
2,500,000
Ø 20,000 Ø 44,000 Ø 76,000 Ø 50,000
2,000,000 passengers/ passengers/ passengers/ passengers/
day day day day
1,500,000
1,000,000
500,000
01 02 03 04 05 06 07 08 09 10 11 12
19 Status: January 2022; percentage of passenger traffic in 2019New elegance for passengers: Terminal 2
should be in operation before summer 2022
A modern travel experience in a first-class
atmosphere awaits passengers
Terminal 2 was completely modernised:
➢ New centralised security checks for the
B, C and D gates
➢ Large, high-quality lounge on 2,360m²
➢ Attractive shopping and restaurant
offering
➢ Greater overall comfort due to
extensive glass facades and generous
ceiling heights
➢ New and additional baggage reclaim
carousels
Opening planned when the 2022 summer
flight schedule takes effect
20BUSINESS DEVELOPMENT AND FINANCIAL
GUIDANCE FOR 2022
212022 should see an econimic turnaround
– Revenue loss of € 1,3 billion
Coronavirus-related revenue loss 2020-22 of € 1.3 billion for Flughafen Wien AG and more
than € 5 billion for Austria’s aviation sector. – 2022 should bring an economic turnaround
Mastering the biggest crisis in the company’s history has involved major cutbacks: cost-
savings programme, freeze on investments and two years of short-time work – short-time
working scheme for 5,000 FWAG employees expected to expire at the end of March 2022
Mandatory vaccinations comprise an important step towards normalcy
Pandemic-related weak first quarter of 2022. Desire to take holiday trips at a record level,
justifying hopes for a strong summer season
Revenue of about € 560 million, EBITDA of at least € 172 million and consolidated net profit
of at least € 20 million expected in 2022
The crisis is not over: the uncertain development of the pandemic is slowing down the return
to normalcy and the freedom of travel – uniform travel regulations across Europe are
absolutely necessary to prevent the economy and tourism from experiencing a third crisis
year
Increasing traffic problems in the region remain unsolved
22Improved consolidated net profit
expected in 2022
200
150
100
176
152
Consolidated net profit in € mill.
112 113 127
50 92
79 81 20
-4
0
1 2
2012 2013 2014 2015 2016 2017 2018 2019 2020 2021 2022
-50
-76
-100
23 Net profit for the period before non-controlling interests: figures adapted for
2012-2015
1) Guidance 2021: status November 2021
2) Guidance 2022: status mid-January 202229% share price increase since Jan. 2016
outperforms competitors, market capitalisation
about € 2.2 billion at the end of 2021
100
50
+29%
Indexed
+18%
0 +8%
-50
-100
31.12.2015 31.12.2016 31.12.2017 31.12.2018 31.12.2019 31.12.2020 31.12.2021
FWAG Fraport ZRH
Share price development from 1/1/2016 to 13/1/2022
24Financial guidance for 2022
Outlook 2022
Revenue approx. € 560 million
EBITDA at least € 172 million
Consolidated net profit at least € 20 million
Net debt below € 50 million
CAPEX approx. € 84 million
25COVID-19 vaccination is the most
important way out of the crisis – Vienna
Airport implements measures
High immunisation rate, 90%+ of employees at
the site are vaccinated or have recovered
➢ More than 100 companies at the airport site take
advantage of the FWAG‘s in-house COVID-19
vaccination programme
➢ Vaccination possible at the Vienna Airport Health
Center without pre-registration
➢ Stringent protective measures at the workplace
(home office, “3G rule”, testing and vaccination
offering)
More than 300,000 antigen and PCR tests at the
airport testing station since May 2020
➢ 10% of all tests in Austria at peak times
➢ Available seven days a week
➢ PCR test results on the same day
26Airport hub is also growing in the crisis:
new business location projects, modern
office and event space
Airport Region is growing despite the crisis
➢ 1,000 new jobs due to increase in business location
projects
➢ New DLH SkyLog Park Vienna with 25.000 m²
logistic facilities on 45.000 m² area
➢ DHL Air sets up headquarters in the AirportCity –
54 new jobs
➢ Real estate developer Helios Real Estate constructs
70,000 m² logistics centre on 21 hectares
Office Park 4 with its AirportCity Space is
successfully in operation – state-of-the-art office,
event and co-working areas
➢ 50% capacity utilisation in spite of the crisis
➢ Red Arrow 2021: award for infrastructure
expansion in future critical areas
27Vienna Airport well on track to becoming
a CO₂ neutral “green airport”
Despite crisis: Company continues its sustainability strategy
Conversion to district heat leads to massive CO₂
reduction:
➢ Industrial waste heat utilisation of the OMV refinery
in Schwechat enables environmentally-friendly
district heat for Vienna Airport as of 2022
➢ Thus 85% CO₂ reduction overall since 2012
➢ Completely CO₂ neutral operations at Vienna Airport
starting in 2023
As of 2022: Austria‘s largest photovoltaic plant in
operation at Vienna Airport
➢ Output of about 24 megawatt peak generated by
the photovoltaic plant covering 24 hectares – will
come on stream in the spring of 2022
➢ Eight photovoltaic systems will supply 30 million
KWh of electricity in the future – a third of VIE’ s
electricity needs!
28Revenue from the ticket tax and certificate
trading should be earmarked for climate
protection
Aviation only accounts for 2.7% of global CO₂ emissions – the sector is
already doing its share thanks to CORSIA, certificate trading and local
measures
Alternative fuels and synthetic kerosene are the most important levers
for enhanced climate protection
The technology exists and works with existing engine systems – the
EU Green Deal prescribes the obligation to blend more sustainable fuels –
large-scale production is now needed in Europe!
For this reason:
➢ Ticket tax and certificate trading proceeds should be
earmarked for the production of CO₂ neutral kerosene!
➢ National action plan for quick start of production in Austria!
29THANK YOU FOR YOUR ATTENTION! 30
You can also read