Fiscal 2022 1st Quarter Supplemental Slides - December 8, 2021
←
→
Page content transcription
If your browser does not render page correctly, please read the page content below

Fiscal 2022 1st Quarter
    Supplemental Slides

                              December 8, 2021
1
Disclaimer
Certain information in this presentation and discussed on the conference call which this presentation accompanies constitutes forward-looking information within the meaning of
the Private Securities Litigation Reform Act of 1995. Statements regarding the Company’s business that are not historical facts are “forward looking statements” that involve risks
and uncertainties and are based on current expectations and management estimates; actual results may differ materially. The risks and uncertainties which could impact these
statements are described in filings that United Natural Foods, Inc. (the “Company”) has made under the Securities Exchange Act of 1934, as amended, including its annual report on
Form 10-K for the year ended July 31, 2021 filed with the Securities and Exchange Commission (the "SEC") on September 28, 2021 and other filings the Company makes with the
SEC, and include, but are not limited to, the impact and duration of the COVID-19 pandemic; labor and other workforce shortages and challenges; our dependence on principal
customers; the addition or loss of significant customers or material changes to our relationships with these customers; our sensitivity to general economic conditions including
changes in disposable income levels and consumer spending trends; the relatively low margins of our business, which are sensitive to inflationary and deflationary pressures; our
ability to realize anticipated benefits of our acquisitions and strategic initiatives, including, our acquisition of Supervalu; our ability to timely and successfully deploy our warehouse
management system throughout our distribution centers and our transportation management system across the Company and to achieve efficiencies and cost savings from these
efforts; our ability to continue to grow sales, including of our higher margin natural and organic foods and non-food products, and to manage that growth; increased competition in
our industry as a result of increased distribution of natural, organic and specialty products, and direct distribution of those products by large retailers and online distributors;
increased competition in our industry, including as a result of continuing consolidation of retailers and the growth of chains; union-organizing activities that could cause labor
relations difficulties and increased costs; our ability to operate, and rely on third-parties to operate, reliable and secure technology systems; moderated supplier promotional
activity, including decreased forward buying opportunities; the potential for disruptions in our supply chain or our distribution capabilities by circumstances beyond our control,
including a health epidemic; the potential for additional asset impairment charges; the risk of interruption of supplies due to lack of long-term contracts, severe weather, work
stoppages or otherwise; our ability to maintain food quality and safety; volatility in fuel costs; volatility in foreign exchange rates; and our ability to identify and successfully
complete asset or business acquisitions. Any forward-looking statements are made pursuant to the Private Securities Litigation Reform Act of 1995 and, as such, speak only as of the
date made. The Company is not undertaking to update any information in the foregoing reports until the effective date of its future reports required by applicable laws. Any
estimates of future results of operations are based on a number of assumptions, many of which are outside the Company’s control and should not be construed in any manner as a
guarantee that such results will in fact occur. These estimates are subject to change and could differ materially from final reported results. The Company may from time to time
update these publicly announced estimates, but it is not obligated to do so.

This presentation also contains the non-GAAP financial measures adjusted EBITDA, adjusted EPS, adjusted EBITDA leverage ratio, adjusted effective tax rate, and adjusted EBITDA
margin rate. The reconciliation of these non-GAAP financial measures to the most directly comparable GAAP financial measure is presented in the appendix to this presentation. The
presentation of non-GAAP financial measures is not intended to be considered in isolation or as a substitute for any measure prepared in accordance with GAAP. The Company
believes that presenting non-GAAP financial measures aids in making period-to-period comparisons, assessing the performance of our business and understanding the underlying
operating performance and core business trends, and is a meaningful indication of its actual and estimated operating performance. The Company's management utilizes and plans
to utilize this non-GAAP financial information to compare the Company's operating performance during certain fiscal periods to the comparable periods in the other fiscal years and,
in certain cases, to internally prepared projections.

      2
      Better Food. Better Future.
Solid Start To Fiscal 2022
                      r tEeRr RI Ne sSuCl tAsL E

                                                                                              First Quarter

                                                                                                                                         Adjusted                              Adjusted
                                                                                                    Sales                                EBITDA               (1)
                                                                                                                                                                               EPS          (1)
       i rI sLtL QPuOaW

                                                                                                    $7.0B                                $189M                                 $0.97
                                                                                                       +4.7%                                                                      +90.2%
                                                                                                                                                +18.9%
F U LF F

                                                   3

                                                       (1) See appendix for reconciliations and definitions for non-GAAP figures; all percentages refer to changes compared to the first quarter of fiscal 2021.
y EARc cIoNmSpCl iAs LhEm e n t s

                                                                         Unlock
                                                                         UNFI    the
                                                                               Pride
                                                                          Retail
                                                                          UNFI   Optimized
                                                                                 Pride
                      t eLr PKOeW

                                                                         Customer Experience
                                                                    • Sales of $7.0 billion, an increase of 4.7% compared to first quarter of fiscal 2021
                 F rI L

                                                                                                (1)
                La

                                                                    • Adjusted EBITDA of $189 million, up 19% despite a challenging operating environment
              Uu
    F i r s tFQ

                                                                    • Credit rating upgrades by Moody’s and S&P / following Q1, repriced Term Loan B with savings of 25 bps
                                                                    • Announced reseller agreement with DoorDash to bring grocery delivery solutions to independent retailers
                                                                    • Continued investment in distribution center labor to better support our customers
                                                                    • Awarded Progressive Grocer Impact Award for sustainability and resource conservation
                                                                     (1) See appendix for definitions and reconciliations for non-GAAP figures.
4
Q1 consolidated sales – broad based growth
                                                                                                                                   ($’s in millions)

                                                                                                                                                                        21             $ 6,997
                                                                                                                             164                    (4)     (1)
                      r tEeRr RI Ne sSuCl tAsL E
       i rI sLtL QPuOaW

                                                                                                        78
F U LF F

                                                                                   55

                                                          $ 6,684

                                                       Q1 FY21 Net Sales         Chains            Independent          Supernatural               Retail   Other   Eliminations (1) Q1 FY22 Net Sales
                                                                                                     Retailers

                                                   5
                                                        (1) Intercompany sales that are eliminated upon consolidation for external presentation.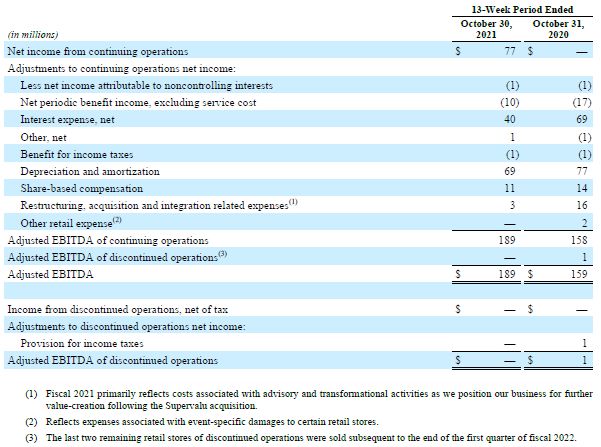
Q1 adjusted EBITDA
                                                                                                                                ($’s in millions)

                                                                                                          34                              (3)
                                                                                                                                                                          (1)                           $ 189
                      r tEeRr RI Ne sSuCl tAsL E
       i rI sLtL QPuOaW
F U LF F

                                                                        $ 159

                                                                     Q1 FY21     (1)               Wholesale /                           Retail                        Disc Ops                      Q1 FY22    (1)
                                                                 Adjusted EBITDA                   Other / Elims                                                                                 Adjusted EBITDA

                                                   6
                                                       (1) See appendix for the Company’s definition of Adjusted EBITDA and the reconciliation of Adjusted EBITDA to net income for the first quarter of fiscal 2021 and fiscal 2022.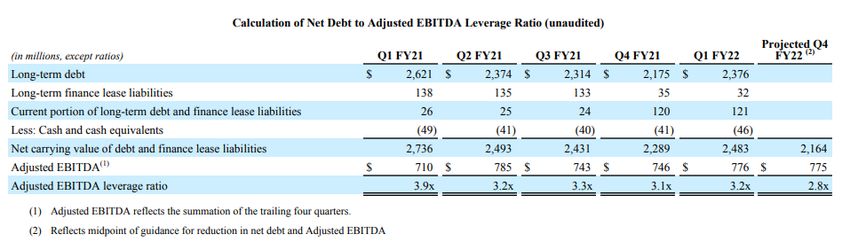
Capital structure reflects ~ $250M of net debt reduction in last 12 months
                                                   Q1 net debt increase driven by seasonal working capital needs
                                                   ($'s in Millions)
                                                                                                                   Maturity                        Rate                   Q1 FY21   Q2 FY21   Q3 FY21   Q4 FY21   Q1 FY22
                                                   Secured term loan B-1 (1)                                     October 2025                  L + 3.25% (2)             $ 1,165 $ 1,015 $ 1,002 $ 1,002 $             994
                                                   $2.1B ABL revolver (1)                                        October 2023           L + 1.25% / Prime + 0.25%              987       885       839       701       910
                                       e ALE

                                                   Senior unsecured notes                                        October 2028                     6.75%                        500       500       500       500       500
                                                   Finance leases                                                   Various                       Various                      150       147       144       142       139
                   OlWSEt rRu IcNt uSr C

                                                   Equipment loans                                                  Various                       Various                       46        43        40        37        34
                                                   Original issue discount / deferred finance fees                                                                             (64)      (56)      (54)      (52)      (48)
                                                   Total Debt and Finance Leases (GAAP)                                                                                  $      2,784    $   2,534     $     2,471      $     2,330       $   2,529
                                                                           (3)
                                                   Balance sheet cash                                                                                                             (49)          (41)            (40)               (41)          (46)
F U L FCI LaLp iPt a

                                                   Net Debt (GAAP)                                                                                                       $      2,735    $   2,493     $     2,431      $     2,289       $   2,483

                                                   Adjusted EBITDA (last four quarters)                                                                                  $       710     $      785    $        743     $          746    $      776

                                                   Net Debt / Adjusted EBITDA (4)                                                                                                3.9x           3.2x            3.3x               3.1x          3.2x

                                                   Available Liquidty (5)                                                                                                $      1,058    $   1,158     $     1,182      $     1,321       $   1,112

                                                   (1) Paid $150M on the secured term loan B-1 in Q2 FY21 with borrowings on the ABL revolver. Subsequent to Q1 FY22, further reduced the balance by $150M with borrowings on the ABL revolver
                                                   (2) Reduced the LIBOR margin on the secured term loan B-1 from 4.25% to 3.50% in Q3 FY21. Subsequent to Q1 FY22, further reduced the LIBOR margin to 3.25% effective 11/10/21

                                                   (3) Includes cash of Discontinued Operations. There is no debt in Discontinued Operations
                                                   (4) Net debt, as shown, divided by Adjusted EBITDA (last four quarters). See appendix for reconcilation of Adjusted EBITDA
                                               7
                                                   (5) Balance sheet cash plus unused capacity under the $2.1B revolving ABL facility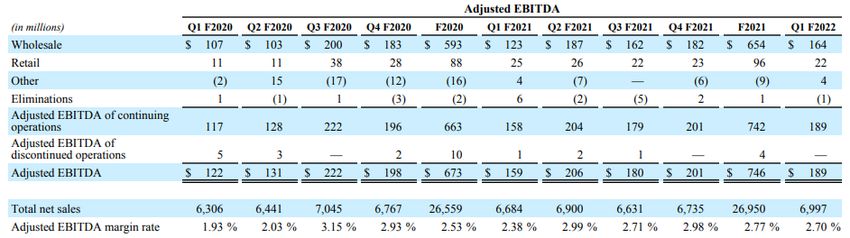
8
    FULFILL POWER IN SCALE

        2022
        Fiscal

        Outlook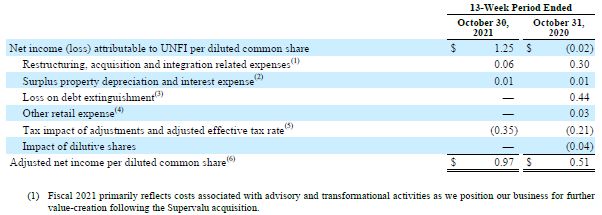
Q3

 9
 Better Food. Better Future.
Affirming Fiscal 2022(1) Outlook
                                                          Includes sales growth of ~ $1 billion (at midpoint) within the $140 billion addressable market
                                                           Net Sales                        Adjusted EBITDA (2)                          Adjusted EPS (2)                    Net Debt Reduction
                                    l oCoAkL E
                                 Nt S

                                                      $27.8 - $28.3 B                           $760 - $790 M                             $3.90 - $4.20                           $100 - $150 M
                       0 2E2R OI u
            s cLaPl O2 W
F U L FF Ii L

                                                          4% growth                                 4% growth                                4% growth
                                                 (1) The outlook provided above is for fiscal 2022. This outlook is forward-looking, is based on management's current estimates and expectations and is subject to
                                                     several risks, including many that are outside of management's control. See cautionary language on slide 2 and the risk factors contained in the Company’s
                                                     Annual Report on Form 10-K for the year ended July 31, 2021 filed on September 28, 2021 and other filings the Company makes with the SEC. Growth
                                                     percentages are based on the midpoint of the range compared to fiscal 2021.
                                            10
                                                 (2) Please refer to the appendix for reconciliations of Adjusted EPS and Adjusted EBITDA to the most directly comparable financial measures calculated in
                                                     accordance with GAAP.
Appendix 11
Reconciliation – Adjusted EBITDA

                                   The non-GAAP adjusted EBITDA measure is defined as a consolidated measure
                                   inclusive of continuing and discontinued operations results, which we reconcile
                                   by adding Net income (loss) from continuing operations, less net income
                                   attributable to noncontrolling interests, plus non-operating income and
                                   expenses, including Net periodic benefit income, excluding service cost,
                                   Interest expense, net and Other, net, plus Provision (benefit) for income taxes
                                   and Depreciation and amortization all calculated in accordance with GAAP,
                                   plus adjustments for Share-based compensation, Restructuring, acquisition
                                   and integration related expenses, Goodwill impairment charges, (Gain) loss on
                                   sale of assets, certain legal charges and gains, certain other non-cash charges
                                   or other items, as determined by management, plus Adjusted EBITDA of
                                   discontinued operations calculated in a manner consistent with the results of
                                   continuing operations, outlined above.

12
 Better Food. Better Future.
Reconciliation – Adjusted EPS (1) See slide 14 for definition of adjusted EPS 13 Better Food. Better Future.
Reconciliation – FY22 Outlook

                                The non-GAAP adjusted earnings per
                                diluted common share measure is a
                                consolidated measure, which the Company
                                reconciles by adding Net income
                                attributable to UNFI plus goodwill
                                impairment      benefits    and    charges,
                                restructuring, acquisition, and integration
                                related expenses, gains and losses on sales
                                of assets, certain legal charges and gains,
                                surplus property depreciation and interest
                                expense, losses on debt extinguishment,
                                discontinued operations store closures and
                                other charges, net, certain other non-cash
                                charges or other items, as determined by
                                management, the impact of diluted shares
                                when GAAP earnings is presented as a loss
                                and non-GAAP earnings represent income,
                                and the tax impact of adjustments and the
                                adjusted effective tax rate, which tax
                                impact is calculated using the adjusted
                                effective tax rate, and certain other non-
                                cash charges or items, as determined by
                                management.

14
 Better Food. Better Future.
Reconciliation – Adjusted Effective Tax Rate
The non-GAAP adjusted effective tax rate excludes the potential impact of changes to various uncertain tax positions and valuation
allowances, as well as stock compensation accounting (ASU 2016-09).
15
Better Food. Better Future.Reconciliation – Last Four Quarters Adjusted EBITDA (1) 16 Better Food. Better Future. (1) See slide 12 for the definition of adjusted EBITDA.
Calculation – Net Debt to Adjusted EBITDA Leverage Ratio

The non-GAAP adjusted EBITDA leverage ratio is defined as the face value of outstanding debt less cash and cash equivalents divided by the trailing four quarters adjusted EBITDA (the definition of
which is shown on slide 12).

Beginning in the fourth quarter of fiscal 2021, the calculation of Adjusted EBITDA leverage ratio was updated to utilize the Net carrying value of debt and finance lease liabilities in the numerator of the
calculation, which is net of the original issue discount on debt and debt finance costs. Historically, the calculation of Adjusted EBITDA leverage ratio added back the original issue discount on debt and
debt finance costs, which had the impact of increasing the numerator of the net debt balance utilized in the calculation. The Company believes this new method better reflects how investors analyze
our debt and leverage positions.

   17
    Better Food. Better Future.
Adjusted EBITDA By Quarter – Fiscal 2021 and Fiscal 2020 (1)
(1) See slide 12 for the definition of adjusted EBITDA.
18
Better Food. Better Future.(1)
Adjusted EBITDA By Segment
(1) See slide 12 for the definition of adjusted EBITDA.
19
Better Food. Better Future.You can also read