BUY PRIMUS INTER PARES: The Global Network for Advanced ...

Page created by Alberto Hunt
 
CONTINUE READING
BUY PRIMUS INTER PARES: The Global Network for Advanced ...
BUY
   PRIMUS INTER PARES:
 AMIT KUMAR ONKAR

 JASKARAN SINGH
 KARISHMA BHURA

 KOUSTAV MANDAL
 SOUMIK SARANGI
Investment                  Company              Industry
                                                                               Financials              Valuation                 Risks
        Thesis                   Overview             Overview

  Direct Benefit Transfer , Nutrient Based Subsidy      Robust Marketing and improved operations

Coromandel is poised to be the biggest
                                                      The company’s marketing strength comes by              MARKET OVERVIEW
beneficiary in the complex fertilizer space in
                                                     means of direct contact with farmers through          Exchange               BSE
India with the implementation positive policy
                                                     Mana Gromor Centers. The company has also
measures as DBT and the NBS. NBS will benefit                                                              Sector                 Fertilizers
                                                     witnessed improvement in operational
in the long term by easing working capital
                                                     efficiency in Retail & Single Super Phosphate         Market Cap (INR        150.38
pressure and lesser volatility in earnings, on
                                                     (SSP) businesses after streamlining its supply        bn.)
the back of its raw material linkages, scale of
                                                     chain and process efficiencies.
operations and operational efficiencies.                                                                   Avg. Volume (‘000)     310.8

              Strategic Partnerships                             Expansion across Portfolio                P/E                    22.31
                                                                                                           EPS Trailing (12 m)    23.07
                                                      The company’s crop protection segment is
The fertilizer segment, has of long term tie-ups
                                                     also likely to benefit from the addition of new
with Foskor, South Africa and Group Chemique,
                                                     capacities for its key molecule, Mancozeb. This
Tunisia, for phosphoric acid along with supply
                                                     will be supported by brownfield expansion at
agreements for Ammonia and Sulphur with
                                                     Dahej plant (10,000TPA). We expect it to
Mitsui. Furthermore, its stake in Andhra
                                                     provide the company with scale and help it
Pradesh Gas Power Plant removes volatility in
                                                     take advantage of the demand in international
power supply.
                                                     markets.
Investment          Company          Industry
                                                Financials        Valuation            Risks
   Thesis           Overview         Overview

    Shortlisting Methodology

             Companies listed in NSE/BSE                          22 Candidates

        Return on capital employed > 12%                        Technical Analysis

    CAGR of Revenue over past 4 years > 12%                       Piotroski Score

     CAGR of EBITDA over past 4 years > 12%                    Sector Attractiveness

      Positive PAT margins over past 5 years                 Coromandel International
Investment            Company               Industry
                                                                    Financials       Valuation                 Risks
   Thesis             Overview              Overview

                          OFFERINGS
                           Offers farming solutions through Fertilisers, Crop
                              protection, Specialty Nutrients, Organic compost                 CREDIT RATING
                           India’s largest private sector Phosphatic fertiliser     CRISIL
                              producer and is also lead organic manure producer         Long Term                AA+
                           Wide portfolio of over 60 brands                            Short Term               A1+
                                                                                        Outlook                 Stable
                          MANUFACTURING FACILITIES & RETAIL OUTLETS
                           15 manufacturing facilities in India, located in the 9
                             Indian states
                           Network of over 800 rural retail outlets under its
    STATEWISE SALES          retail network in its core market of Andhra Pradesh,
                             Karnataka and Telangana (largest rural retail chain)
                           Over 9000 retail touchpoints

                          PRESENCE
                           Caters to 2 mn farmers, covering a total retail space
                              of 0.7 mn square feet
                           Presence in 71 countries, including China and
                              several Latin American, African, South East Asian
                              and Middle East nations
                           40% export share
Investment                   Company                        Industry
                                                                                          Financials                         Valuation                           Risks
       Thesis                    Overview                       Overview

Low mechanisation - meagre growth of 90M agriculture land has nutrient deficient
 soil & >50% districts have low nutrient content
Less crop protection usage - crop protection (kg/hectare) in
 India = 0.6 much less than 7 for USA, 13 for China

                                                                                Source: FAO, IFA                                   Source: Ministry of Commerce & Industry

Impetus for improving agriculture – Gov. aim to double                                              INCREASING PEST PROBLEM
 farm income by 2022; budget allocation = INR 5.5bn                                                              1940                                    2017
Make in India – domestic production ↑; policy target - to                                         Total Pests          Serious Pests      Total Pests          Serious Pests
 become self – sufficient in Urea by 2022                                     Rice                     35                    10               240                    17
Improving pest problem - ↑ed pest problem is healthy
                                                                             Wheat                     20                     2               100                    19
 signal for herbicide manufacturing
                                                                           Sugarcane                   28                     2               240                    43
Scope for water soluble fertilisers - More Crop Per Drop
 aims to ↑ micro irrigation coverage from 8M hectare to 69M                Ground Nut                  10                     4               100                    12
                                                                            Mustard                    10                     4                38                    12
                                                                             Pulses                    35                     6               250                    34
Investment                  Company                      Industry
                                                                                     Financials                 Valuation                        Risks
       Thesis                   Overview                     Overview

                            Solvency Analysis                                                              Liquidity Analysis

                                      FY 14      FY 15      FY 16      FY 17                                          FY 14      FY 15        FY 16      FY 17
         Debt to Capital              44.4%      51.0%      50.4%      43.5%              Current Ratio                1.15      1.13         1.15       1.22
          Debt to Equity               0.62       0.97       0.93       0.79               Quick Ratio                 0.77      0.73         0.77       0.91
     Interest Coverage Ratio           3.4        3.85       3.32       4.18

   Decline in Debt to capital and Debt to equity ratios.                           Improved Quick and Current Ratio -> Improved liquidity
   Improving leverage -> Better interest coverage ratio -> Better solvency
   Advantage Coromandel as farm mechanisation strengthens in India.

                                                 Dividend Analysis                                                              Expense Analysis

                                             Stable dividend per share across                                               Decline in the material cost
                                              years                                                                           composition due to softer raw
                                             Increase in DPS -> Positive                                                     material prices
                                              signal to investors regarding                                                  Locked prices -> Higher margins
                                              cash outlook                                                                    for the next 1-2 quarters

    Our three stage DCF model at 9.90% WACC gave a target price of 590 at an upside of 14.5%. Valuation using multiples like P/E and
                                      EV/EBITDA gave a target price of 602 and 607 respectively.
Investment                   Company                 Industry
                                                                                Financials                  Valuation                     Risks
       Thesis                    Overview                Overview

                         Activity Ratio Analysis                                                      Profitability Analysis

                                     FY 14     FY 15     FY 16     FY 17                                         FY 14      FY 15     FY 16       FY 17
    Total Asset Turnover Ratio       1.22      1.61       1.29      1.20          Net Profit Margin              3.67%     3.57%      3.14%       4.75%
     Inventory Turnover Ratio        5.69      5.09       4.97      5.91                ROCE                    19.79%     18.89%    15.87%     18.55%
    Receivables Turnover Ratio       3.24      2.91       2.47      2.05                 ROE                    15.42%     18.62%    15.18%     16.95%
     Payables Turnover Ratio         2.31      2.35       2.02      1.80
      Cash Conversion Cycle          18.9      41.8       40.5      37.0

   Improved Inventory Turnover Ratio -> Efficient inventory management->      Improved operational efficiency and softening raw material prices->
    Improved cash conversion cycle -> Faster Realisation of revenues            Improved profitability and better margins

Factors supporting financials in next few quarters:
 Agricultural reforms, improved minimum support prices and government’s focus towards improving soil health and rural technology
 Higher contribution from unique grade fertilisers and crop protection segment
 Higher operating leverage due to better utilization rate in fertilisers and higher usage of captive phosphoric acid (Management is
    targeting 90% utilization in FY18)
 Low channel inventory due to higher liquidation of channel inventory and healthy demand

    Our three stage DCF model at 9.90% WACC gave a target price of 590 at an upside of 14.5%. Valuation using multiples like P/E and
                                      EV/EBITDA gave a target price of 602 and 607 respectively.
Investment                 Company                           Industry
                                                                                                 Financials                             Valuation                                   Risks
        Thesis                  Overview                          Overview

                                                                            Tax Rate                 30%                                                   Risk free rate                       6.96%
3 step DCF model:                                                                                                                                          Market return rate                  12.68%
                                                         (in Rs mn)                         2018 E            2019 E        2020 E          2021 E
                                                                                                                                                           Risk Premium                         5.72%
 2018-21: Estimation of FCFF                              EBIT                             10500              12420        14120           16000          Beta                                   1.06
 Next 4 years: 10% growth                           EBIT after tax                          7350               8694         9884           11200          Long Term Rating                     AA+
 Terminal growth: 4%                                    YoY growth                         19.0%             18.3%         13.7%           13.3%          Short Term Rating                    A1+
                                                                                                                                                           Cost of debt                          8.5%
                                             Depreciation & Amortisation                     1074               1145         1220            1298
                                                                                                                                                           Cost of equity                      13.02%
3 step model used because of                     Working Capital Change                      2833               1326         1032             987          Debt/Equity                            0.79
relatively growing business due                            Capex                            -2000               -2100       -2205           -2315          WACC                                 9.90%
to farm mechanization.                                     FCFF
                                                                                                                                                           Terminal Growth Rate                 4.00%
                                                                                             9257               9065         9931           11169

                          Sensitivity Analysis                                         Assuming growth rate to be 10% for next 4 years from 2022 to 2025 and terminal growth rate of 3% thereafter,
                                          WACC                                         PV (2022-2025)                                           30694
            590   8.30% 8.70% 9.10% 9.50% 9.90% 10.30% 10.70% 11.10% 11.50%
                                                                                       PV (terminal)                                            114675
            0%    764   707   657   613    575     540      510       482   457
                                                                                       PV (2018-2021)                                           31066
            1%    770   712   661   617    578     544      513       485   460

 Terminal   2%    775   717   666   622    582     547      516       488   462        PV (Total FCFF value)                                    176435
  growth    3%    781   722   671   626    586     551      519       491   465        Market value of debt                                     4236
            4%    787   727   675   630    590     554      522       494   468
                                                                                       Market value of equity                                   172199
            5%    792   732   680   634    594     558      526       497   471
                                                                                       Shares Outstanding                                       292                   Entry Price                     515
            6%    798   737   684   638    597     561      529       500   473

            7%    803   742   689   642    601     565      532       503   476        Share price                                              590                   Upside                          14.5%

    Our three stage DCF model at 9.90% WACC gave a target price of 590 at an upside of 14.5%. Valuation using multiples like P/E and
                                      EV/EBITDA gave a target price of 602 and 607 respectively.
Investment              Company                  Industry
                                                                      Financials               Valuation                 Risks
       Thesis               Overview                 Overview

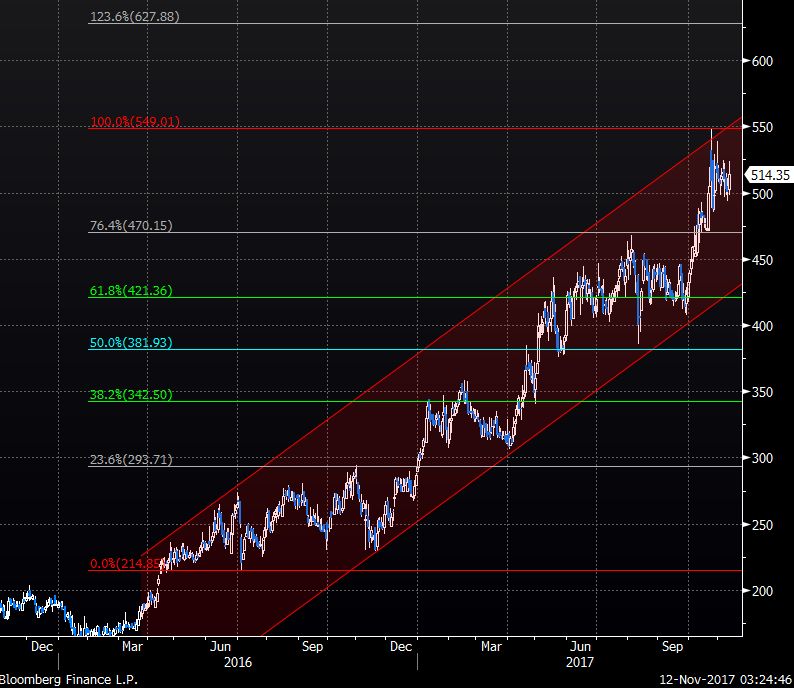
Scatter plot of P/E and RoCE amongst the peers of fertilizers   Trading in a channel; difference between MACD and signal is
industry; Coromandel International is attractive (cheap)        negative, contrarian view implies bullishness; Fibonacci retracement:
amongst its peer on the basis of the current valuation          Target : 627 (at 123.6% levels); high deliverables in futures contract.

We recommend a “BUY” given the Fibonacci and MACD analysis and Coromandel’s attractiveness as exhibited by the P/E and ROCE plot
Investment                  Company                  Industry
                                                                                                                         Financials                             Valuation                    Risks
         Thesis                   Overview                 Overview

                COMPANY RISKS                                                                                                                                            EXTERNAL RISKS
                                                                                     Cost USD/Ton
•   Delay in expansion of Kakinada plant: The Rs. 225      1000                                                                                      1000   •      Financial Risks: Large part of revenue
    Cr expansion plan at the Kakinada plant might be                                                                                                               comes from government as part of
                                                            800                                                                                      800
    delayed due to potential increase in pollution                                                                                                                 subsidy; any fluctuation in the exchange
    levels as well as problems on acquisition of land.      600                                                                                      600           rate will lead to under recovery of the
    Hence, there is a potential for opportunity cost        400                                                                                      400           subsidy revenue; direct impact on the
    being incurred on the capital invested here                                                                                                                    business profitability of the company
                                                            200                                                                                      200
•   Volatility in raw material prices: The cost of           0                                                                                       0      •      Macro Risk: The expected GDP growth

                                                                                     Jul-15

                                                                                                                          Jul-16
                                                                  Jan-15
                                                                            Apr-15

                                                                                                       Jan-16
                                                                                                                Apr-16

                                                                                                                                            Jan-17
                                                                                              Oct-15

                                                                                                                                   Oct-16
    production can be directly impacted by volatility in                                                                                                           for 2018 has reduced from 7.4% to 6.9%
    crude oil productions as most of the raw materials                                                                                                             (Fitch rating) after the GDP growth
    are derived from crude oil. The chart alongside                                                                                                                flattered in the first quarter of the
    shows that the cost Phosphoric acid and Ammonia                        Ammonia (right)                                   Phosphoric Acid                       current fiscal year. This is likely to
    has slowed down and become stable but there is                                                                                                                 adversely impact demand for fertilizers
    quite significant supply risk associated with oil
                                                           Government has been implementing
    based inputs                                                                                                                                            •      Regulatory Risk: Poor handling of
                                                           Nutrient Based Subsidy (NBS) Policy for
                                                                                                                                                                   hazardous material like Ammonia might
                                                           decontrolled P&K fertilizers which might
•   Operational Risks: A significant amount of risk is                                                                                                             cause a similar case as in 2015.
                                                           impact the sales of Coromandel fertilizers
    posed due to obsolescence of technology in the                                                                                                                 Moreover there is a risk of crackdown
                                                           which are phosphatic in nature
    near future being a possibility. Also, there is a                                                                                                              by the Pollution Control Board.
    significant threat posed due to development of BT
    crops which might affect the demand of fertilizers
You can also read