November 4, 2021 technicolor.com

Page created by Walter Mcbride
 
CONTINUE READING
November 4, 2021 technicolor.com
November 4, 2021

                   technicolor.com
November 4, 2021 technicolor.com
contains certain statements that                              are based on
constitute "forward-looking                management's current expectations
statements”, including but not             and beliefs and are subject to a
limited to statements that are             number of risks and uncertainties that
predictions of or indicate future          could cause actual results to differ
events, trends, plans or objectives,       materially from the future results
based on certain assumptions or            expressed, forecasted or implied by
which do not directly relate to            such forward-looking statements.
historical or current facts.

              and description of such risks and uncertainties,
              refer to Technicolor’s filings with the French
              Autorité des Marchés Financiers.
November 4, 2021 technicolor.com
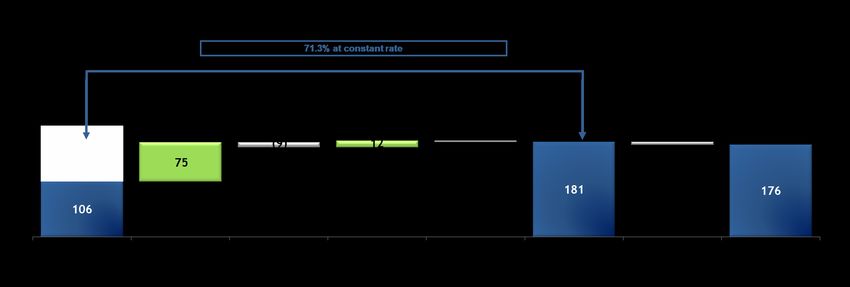
KEY FIGURES FROM CONTINUING OPERATIONS YTD SEP-21

               For the first nine months of the year, REVENUES totalled         ADJUSTED EBITDA of €176           ADJUSTED EBITA of €46           FCF (before financial results and tax) of €(206)
               €2,050 million, DOWN 4.4% at constant rate.                      million, UP 71.3% at constant     million, HIGHER BY €111         million was HIGHER BY €72 MILLION at
                                                                                rate driven by strong revenue     MILLION as a result of          current rate, reflecting higher consolidated
               Benefiting from STRONG AND GROWING DEMAND                                                          EBITDA      increase      and
                                                                                pipeline and operational &                                        EBITDA
               across all activities, Technicolor delivered a positive third                                      positive impact of efficiency
                                                                                financial improvements mainly
               quarter 2021, and a SIGNIFICANT IMPROVEMENT IN                                                     measures
                                                                                in Technicolor Creative Studios
               PROFITABILITY, despite supply constraint challenges
               affecting both Connecting Home and Technicolor Creative
               Studios

                                                                                                                                       Technicolor Creative Studios has been awarded
                                                                                  Change YoY Change YoY
                                                          YTD Sep     YTD Sep                                                           numerous new projects, with approximately 75% of its
                                In € million                                       at current at constant
                                                           2021        2020                                                             expected 2022 sales for FEV and Animation & Games
                                                                                      rate        rate
                                                                                                                                        committed
                                                                                                                                       Continued strong demand in North America and in
                                 Revenues                  2,050        2,230       (8.1)%       (4.4)%
                                                                                                                                        Eurasia in Connected Home
                                                                                                                                       Strong catalog demand and continued growth in non-
                                 Adjusted EBITDA            176          106        +66.6%      +71.3%                                  disc related supply chain activity in DVD Services

                                 Adjusted EBITA             46           (65)         na           na

                                 FCF before Financial &                                                                                  Revenues still impacted by component shortages in
                                                           (206)        (278)       +26.0%      +22.1%
                                 Tax                                                                                                      Connected Home and hiring constraints in TCS
                                                                                                                                          leading to sales being pushed into 2022

                          BASED ON BUSINESS ACTIVITY FOR THE FIRST NINE MONTHS AND THE CONTINUED SUCCESSFUL OPTIMIZATION OF
                                        OUR BUSINESSES, THE GROUP IS CONFIRMING ITS OUTLOOK FOR 2021 AND 2022             4
C3 - Restricted Natixis
TECHNICOLOR CREATIVE STUDIOS

                          Revenues (in € million)       Adjusted EBITDA (in € million)
                                                                                         REVENUE HIGHLIGHTS:                          APPOINTMENT OF JEANEANE FALKLER
                                                                                                                                      as the President of Technicolor Games, a newly
                                                                                          UP 37.9% QOQ AT CONSTANT
                                       +37.9%                                                                                         created position to lead growth in the games sector
                                                                                           RATE
                                    (@ constant rate)
                                                                                             Surge in demand for original content in
                                                           21.3%                                   Film & Episodic VFX and Animation,
                                                                                                   combined with an outstanding
                                                                                                   performance from Advertising                            Numerous new projects awarded, with
                                                                                                                                                            more than 75% of the expected 2022
                                                                         +22.8pp          ADJ. EBITDA HIGHLIGHTS:                                           sales pipeline for Film & Episodic Visual
                              157                            33
                                                                                                                                                            Effects and Animation committed
                                                 111                                         UP €35 MILLION QOQ
                                                                                              AT CONSTANT RATE
                                                                         (1.5)%                                                                            As capacity to deliver remains one of
                                                                            -2
                                                                                                +22.8 pp margin increase as a result                       the main challenges, TCS continues to
                                                                                                   of margin growth and aggressive                          recruit on a large scale to keep pace
                                                                                                   permanent cost reduction measures                        with the volume of work
                           Q3 2021           Q3 2020      Q3 2021        Q3 2020
                                                                                          CONTINUED HARMONIZATION of
                                                                                          technology infrastructure and the creation of a
                                                                                          single delivery pipeline to maximise efficiencies

                                                                              Film & TV - VFX                               Advertising                         Animation & Games

                                                                    ►   20+ theatrical film and 35+ streaming   ►    c. 660 commercials                     ►   c. 1,060 minutes of
                                                                        /episodic projects in production                                                        animation delivered for Film
                                                                                                                ►    7 Creative Circle Awards,
                                                                    ►   HPA Award nomination for                     including Gold for Most Creative           & TV
                                                                        Outstanding Visual Effects -                 Post Production Company (The           ►   Contributed to recent AAA
                                                                        Theatrical Feature (Godzilla vs.             Mill); 4 Kinsale Shark Awards;             games releases like NBA
                                                                        Kong)                                        and VFX Gold at shots Awards               2K22 (2K), FIFA 22 (EA),
                                                                                                                     Asia Pacific                               and NHL 22 (EA)
                                                                                                                                                                                                    5
C3 - Restricted Natixis
CONNECTED HOME

                                        Revenues (in € million)                REVENUE HIGHLIGHTS:                                  NEW WINS AND PRODUCT
                                                                                                                                    LAUNCHES are driven by better
                                              (33.9)%                             REVENUE DOWN 33.9% QOQ AT
                                           (@ constant rate)                                                                        user experience in the home with
                                                                                   CONSTANT RATE
                                                                                                                                    Wi-Fi 6, while innovation is coming
                                                                                     Despite strong growth in demand in
                                                                                       North America and in Eurasia…
                                                                                                                                    with new technologies in the field of
                                                                                                                                    sound and far-field voice
                                                                  302                …the worldwide semiconductor/key
                                             Broadband                                 component crisis, combined with supply             Next-generation Wi-Fi 6
                                  193
                                                                                       chain dislocation, has further                     Deployment of next-generation
                          330                                            488           deteriorated during the third quarter,                 Android TV set-top boxes
                                                                                       creating renewed challenges for
                                                                  187                  Connected Home
                                  137           Video
                                                                               ADJ. EBITDA HIGHLIGHTS:                               RESTORING PROFITABILITY:

                                Q3 2021                        Q3 2020
                                                                                   DOWN €14 MILLION at current rate                     Focus on selective investments in
                                                                                       due to the sales shortfall and higher                   key customers, platform-based
                                                                                       component prices, partially offset by                   products and partnerships to
                                  Adjusted EBITDA (in € million)                       reductions in opex and costs partially                  improve margin
                                                                                       recharged to customers
                                                                  6.3%
                                              (1.2)pp

                                                                                                        The division is working with clients and suppliers to optimize
                                 5.1%                                                                    deliveries, and to mitigate potential negative profitability and working
                                                                   31                                    capital impacts

                                   17                                                                   Continued difficulties in obtaining components, challenges in finding
                                                                                                         transportation, cost increases across multiple categories of
                                                                                                         components and logistics
                                Q3 2021                        Q3 2020                                                                                                              6
C3 - Restricted Natixis
DVD SERVICES

                          Revenues (in € million)        Adjusted EBITDA (in € million)
                                                                                              REVENUE HIGHLIGHTS:                               COVID-19 SITUATION UPDATE
                                                                                                 VOLUME DOWN 6.7%                                  Theatrical new release is showing an
                                     +3.6%                                                                                                              accelerating trend of improvement, with
                                 (@ constant rate)
                                                                                                    The impact of Covid-19 on disc                     significant box office results from recent
                                                             14.6%                                     volumes eased somewhat in the
                                                                             14.1%                                                                      major releases
                                                                                                       third quarter, with an increased
                                                                    +0.5pp                             level of new release activity,                DVD/Blu-ray™ release remains the
                                                                                                       which helped drive the higher mix                normal windowing sequence for Studios
                                                                                                       of Blu-ray™ volume in the quarter             Retailers are expected to re-allocate
                              198                              29             27
                                                                                                                                                        shelf space in favor of higher priced new
                                               193
                                                                                                                                                        release product
                                                                                                 REVENUE UP 3.6% QOQ AT                             Some production facilities continue to
                                                                                                  CONSTANT RATE                                         experience temporary staffing
                                                                                                    Increase in Blu-ray™ volume and                    shortages, but the overall impact to
                                                             Q3 2021        Q3 2020                    ongoing growth in non-disc                       operations remains limited
                           Q3 2021         Q3 2020
                                                                                                       related supply chain activity

                                                                                              ADJ. EBITDA HIGHLIGHTS:
                                                                                                                                                                 DVD Services has
                                                                                QoQ
                               (in million units)    Q3 2021 Q3 2020                             UP €2 MILLION                                                   accelerated certain aspects
                                                                               Change
                                                                                                    €29 million at current rate in the third                     of its future restructuring
                                                                                                       quarter, or 15% of revenue, slightly                       plans in an effort to adapt to
                                    DVD               168.0         189.3      ( 11 . 2 ) %            better than expectations                                   the ongoing Covid-19 impact
                                                                                                    Profitability improvement has benefited
                               Blu-ray™               66.5          61.5           7.8%                from the acceleration of cost saving
                                                                                                       actions and higher activity in freight
                                                                                                       and logistics despite continued labor
                                    CD                 8.5           9.4       (9.8)%                  and material cost pressures
                                                                                                                                                                                                     7
C3 - Restricted Natixis
SHORT AND MEDIUM-TERM OUTLOOK CONFIRMED

                                                                                                                                                                Technicolor will continue to target an improvement of its
                                                                                                                                                                EBITDA, EBITA and FCF throughout 2021 & 2022
                            In € million, post IFRS 16
                                                                                                                       Outlook3
                            Continuing Operations                                                                                                               ► All Technicolor activities currently benefit from strong
                                                                                                                                                                   and growing demand
                                                                               2020a1                        2021e                   2022e4
                                                                                                                                                                ► As previously communicated, we adjusted our
                                                                                                                                                                   guidance in Q1 for the change in perimeter (sale of
                             Adj. Continuing EBITDA                                167                         270                      385
                                                                                                                                                                   Post Production) and the change in forex assumptions.
                                                                                                                                                                   We are now reaffirming that guidance, as follows:
                               Adj. Continuing EBITA                               (56)                         60                      180                          For 2021, revenues from continuing operations broadly
                                                                                                                                                                        stable vs. 2020, adjusted EBITDA of around €270 million,
                                                                                                                                                                        adjusted EBITA of around €60 million, continuing FCF
                                    Continuing FCF2                               (124)                        c. 0                     230                             before financial results and tax2 at around breakeven and
                                                                                                                                                                        net debt to EBITDA leverage ratio below 4x

                           Net debt to EBITDA leverage ratio should reduce to below 4X level by                                                                      For 2022, Adjusted EBITDA of €385 million, Adjusted
                           December 2021                                                                                                                                EBITA of €180 million, and Continuing FCF before financial
                                                                                                                                                                        results and tax2 at around €230 million

                                                                                                                                                                ► The Group is on track to achieve the c. €115 million
                          (1) In the June 22nd 2020 press release, forecast costs related to Covid-19 were accounted as non-recurring (therefore not part of
                          EBITDA & EBITA), these costs have been reintegrated in the EBITDA and EBITA of the Group in 2020 and in coming years                     cost savings planned for calendar year 2021, with €75
                                                                                                                                                                   million cost savings realized end of September YTD,
                          (2) Before financial results and tax. Free cash flow defined as: Adj. EBITDA – (net capex + restructuring cash expenses + change in
                          pension reserves + change in working capital and other assets & liabilities + cash impact of other non-current result)
                                                                                                                                                                   en route to delivering a cumulative €325 million by the
                                                                                                                                                                   end of 2022
                          (3) Outlook based on constant exchange rates

                          (4) In 2022, the cumulated impacts of foreign exchange fluctuations and change in Group perimeter as a result of the sale of Post
                          Production are €(40) million on Adjusted EBITDA and €(23) million on Adjusted EBITA                                                                                                                   8
C3 - Restricted Natixis
KEY FIGURES (YTD) – GROUP
                                                                                                                                                    YTD Sep
                                                                                                                                                                                Forex        vs. LY
                                                                                                                                                             vs. LY
                                                                                                                2021                     2020                                  impact   at constant rate
                                                                                                                                                               (a)               (b)        (c=a+b)

                                                                           (in € million)         Current rate         LY rate          LY rate            Current rate                        LY rate

                                                                 Revenues                              2,050            2,131            2,230      (181)            (8.1)%     +82     (99)        (4.4)%
                                                           Adjusted EBITDA                              176              181                 106    +70              +66.6%     +5      +75         +71.3%
                                                           in % of Revenues                            8.6%             8.5%                 4.7%
                                                         (1)                 (2)
                                                  D&A          & Reserves w/o PPA                                                                   +41              +24.0%     (5)     +36         +21.1%
                                                                                                       (130)            (135)            (171)
                                                                amortization
                                                               Adjusted EBITA                            46               46                 (65)   +111               ns       (0)     +111             ns
                                                           PPA amortization                             (28)             (30)                (31)    +3              +9.1%      (1)     +1          +4.5%
                                                         Non-recurring items                            (11)             (13)            (116)      +104             +90.4%     (2)     +103        +89.0%
                                                                    EBIT                                 7                 4             (212)      +219               ns       (3)     +216             ns
                                                        Net Result Continuing                          (105)            (110)            (111)       +5              +4.9%      (4)     +1          +1.0%
                                                      Net Result Discontinued                           (1)               (1)                (10)    +9              +93.8%     +0      +9          +94.1%

                                                  Net Result Group (Group share)                       (106)            (110)            (121)      +15              +12.3%     (4)     +10         +8.7%

                                                           Adjusted EBITDA                              176              181                 106    +70              +66.6%     +5      +75         +71.3%
                                                                   Capex                                (64)             (67)                (83)   +19              +22.8%     (3)     +16         +19.1%

                                                Non-recurring items (cash impact)                       (78)             (79)                (60)   (18)             (29.3)%    (1)     (18)        (30.6)%

                                                         WC-OAL variation (1)                          (240)            (252)            (240)       +1              +0.2%      (12)    (11)        (4.7)%
                                                    FCF before Financial & Tax                         (206)            (216)            (278)      +72              +26.0%     (11)    +61         +22.1%
                                                     FCF after Financial & Tax                         (277)            (289)            (335)      +57              +17.1%     (12)    +45         +13.5%
                                                               Net Debt (IFRS)                        (1,183)          (1,179)           (955)      (227)            (23.8)%

                            (1)   Including IT capacity use for rendering in Technicolor Creative Studios of 0m€ in 2021 and (2)m€ in 2020
                            (2) Risk,   litigation and warranty reserves
                                                                                                                                                                                                              10
C3 - Restricted Natixis
ADJUSTED EBITDA BRIDGE VS. LY (YTD)

                                                                11
C3 - Restricted Natixis
TECHNICOLOR CREATIVE STUDIOS Q3 2021 PROFITABILITY

                                                                                                                                                        Q3
                                                                                                                                                                                          vs. LY
                                                                                                                                                         vs. LY
                                                                                                       2021                               2020                              Forex   at constant rate
                                                                                                                                                           (a)
                                                                                                                                                                           impact         (c=a+b)
                                                                                                                                                                             (b)
                          Technicolor Creative Studios
                                                                                     Current rate                LY rate                LY rate     Current rate                          LY rate
                                        in € million

                                        Revenues                                            157                     153                    111    +46         +41.2%        (4)     +42         +37.9%

                                 Ajusted EBITDA                                              33                      33                     (2)   +35              ns       (0)     +35              ns

                                in % of Revenues                                          21.3%                   21.7%                  (1.5)%
                              (1)
                          D&A         & Reserves(2) w/o PPA                                 (18)                    (17)                   (22)   +4          +19.6%        +0      +4          +20.5%
                                       amortization
                                 Adjusted EBITA                                              16                      16                    (24)   +39              ns       (0)     +39              ns

                                 PPA amortization                                            (2)                    (2)                     (2)   (0)             (2.2)%    +0      +0              +0.0%

                                Non-recurring items                                          (5)                    (5)                     (4)   (0)             (9.3)%    (0)     (0)         (11.6)%

                                             EBIT                                             9                       9                    (30)   +39              ns       (0)     +39              ns

                                (1)   Including IT capacity use for rendering in Technicolor Creative Studios of 0m€ in 2021 and (2)m€ in 2020
                                (2)   Risk, litigation and warranty reserves                                                                                                                                12
C3 - Restricted Natixis
CONNECTED HOME Q3 2021 PROFITABILITY

                                                                                                                         Q3
                                                                                                                                                             vs. LY
                                                                                                                           vs. LY
                                                                                        2021              2020                               Forex    at constant rate
                                                                                                                             (a)
                                                                                                                                            impact
                                                                                                                                                             (c=a+b)
                                                                                                                                              (b)
                              Connected Home
                                                                             Current rate      LY rate   LY rate      Current rate                           LY rate
                                 in € million

                                  Revenues                                       330            323       488      (158)        (32.4)%      (7)     (165)         (33.9)%

                              Ajusted EBITDA                                     17              15        31      (14)         (45.5)%      (2)     (16)          (50.9)%

                              in % of Revenues                                  5.1%            4.7%      6.3%

                          D&A & Reserves (*) w/o PPA
                                                                                 (15)           (16)      (16)      +1              +3.8%    (0)      +0               +2.8%
                                amortization
                              Adjusted EBITA                                      1              (0)       15      (13)         (90.7)%      (2)     (15)               ns

                              PPA amortization                                   (5)             (5)       (5)      +0              +1.6%    (0)      +0               +1.5%

                             Non-recurring items                                 (2)             (2)       (3)      +1          +41.0%       +0       +1           +44.1%

                                      EBIT                                       (6)             (8)        6      (12)              ns      (2)     (14)               ns

                                (*) Risk, litigation and warranty reserves
                                                                                                                                                                               13
C3 - Restricted Natixis
DVD SERVICES Q3 2021 PROFITABILITY

                                                                                                                        Q3
                                                                                                                                                          vs. LY
                                                                                                                         vs. LY
                                                                                       2021              2020                               Forex   at constant rate
                                                                                                                           (a)
                                                                                                                                           impact
                                                                                                                                                          (c=a+b)
                                                                                                                                             (b)
                               DVD Services
                                                                            Current rate      LY rate   LY rate     Current rate                          LY rate
                                 in € million

                                 Revenues                                       198            200       193      +5              +2.5%     +2      +7              +3.6%

                              Ajusted EBITDA                                    29              30        27      +2              +6.1%     +1      +3              +9.9%

                             in % of Revenues                                 14.6%           15.0%     14.1%
                                              (*)
                          D&A & Reserves w/o PPA                                (11)           (11)      (12)     +1              +9.2%     +0      +1              +9.3%
                                amortization
                              Adjusted EBITA                                    18              19        15      +3          +18.6%        +1      +4          +25.4%

                              PPA amortization                                  (2)             (2)       (2)     (0)             (7.9)%    (0)     (0)             (8.3)%

                             Non-recurring items                                 0               1        (0)     +0               ns       +0      +1               ns

                                      EBIT                                      16              17        13      +3          +23.7%        +1      +4          +35.1%

                               (*) Risk, litigation and warranty reserves
                                                                                                                                                                             14
C3 - Restricted Natixis
FROM ADJUSTED EBITDA TO EBIT IN SUMMARY (YTD)

                                                                                                                                                           YTD Sep

                                                                                                                                                                                                   vs. LY
                                                                                                                                                                  vs. LY
                                                                                                                       2021                       2020                                        at constant rate
                                                                                                                                                                    (a)        Forex impact       (c=a+b)
                                                                                                                                                                                    (b)

                                              in € million                                          Current rate                  LY rate        LY rate        Current rate                      LY rate

                                          Adjusted EBITDA                                                  176                       181          106                +70           +5              +75

                          D&A(1) & Reserves(2) w/o PPA amortization                                      (130)                      (135)         (171)              +41           (5)             +36

                                           Adjusted EBITA                                                  46                         46          (65)             +111            (0)             +111

                                           PPA amortization                                               (28)                       (30)         (31)               +3            (1)              +1

                                       Impairments & write-off                                              0                          0          (71)               +71           (0)             +71

                                              Restructuring                                               (31)                       (32)         (51)               +20           (1)             +19

                                          Other Non Current                                                20                         19            6                +14           (1)             +13

                                           EBIT Continuing                                                  7                          4          (212)            +219            (3)             +215

                                (1)   Including IT capacity use for rendering in Technicolor Creative Studios of 0m€ in 2021 and (2)m€ in 2020
                                (2)   Risk, litigation and warranty reserves                                                                                                                                     15
C3 - Restricted Natixis
FROM EBIT TO NET RESULT GROUP (YTD)

                                                                                                     YTD Sep

                                                                                                                                             vs. LY
                                                                                                            vs. LY
                                                                          2021              2020                                        at constant rate
                                                                                                              (a)        Forex impact       (c=a+b)
                                                                                                                              (b)

                                   in € million            Current rate          LY rate   LY rate        Current rate                      LY rate

                                 EBIT Continuing                7                   4       (212)            +219            (3)             +215

                               Net Interest Expense            (93)               (94)      (54)               (39)          (2)             (40)

                                 Others Financial              (1)                 (1)      159              (161)           +0              (160)

                                Profit before Tax              (87)               (92)      (106)              +19           (5)             +15

                                       Tax                     (19)               (18)       (5)               (14)          +0              (14)

                              Net Result Continuing           (105)               (110)     (111)              +5            (4)              +1

                              Net Result Discontinued          (1)                 (1)      (10)               +9            +0               +9

                          Net Result Group (Group share)      (106)               (110)     (121)              +15           (4)             +10

                                                                                                                                                           16
C3 - Restricted Natixis
FREE CASH FLOW FROM CONTINUING OPERATIONS

                                                          Free Cash Flow from continuing operations: YTD Sep 2021 vs. YTD Sep 2020

                                                                                                                                 (289)                  (277)
                            (335)

                                                  +16         (24)
                                                                            (14)        +2          (7)                                       +12
                                         +75                                                                  (9)     +6

                          FCF YTD Sep    EBITDA    Net          Net        ∆ WC/OAL   Rendering   Financial   Tax    Pensions   FCF YTD Sep    Forex   FCF YTD Sep
                              2020        ADJ     Capex    Restructuring                                            and Other      2021       impact      2021
                          as published                                                                                             @LYR                   @CR

                                                                                       €57m                                                                          17
C3 - Restricted Natixis
DEBT STRUCTURE

                                                                                        Nominal                 IFRS                Type of    Nominal     Repayment                     Moodys/
                          In million currency                        Currency                                                                                          Final maturity
                                                                                        Amount                 Amount                 rate      rate (1)     Type                       S&P rating

                          New Money Notes                              EUR                  371                   381               Floating   12.00%(2)     Bullet    Jun. 30, 2024     Caa1/B
                          New Money Term Loans                         USD                  110                   113               Floating   12.15%(3)     Bullet    Jun. 30, 2024     Caa1/B
                          Reinstated Term Loans                        EUR                  467                   398               Floating   6.00%(4)      Bullet    Dec. 31, 2024    Caa3/CCC

                          Reinstated Term Loans                        USD                  126                   107               Floating   5.90%(5)      Bullet    Dec. 31, 2024    Caa3/CCC
                          Subtotal                                    EUR                  1,074                  999                           8.69%
                          Lease Liabilities(6)                       Various                186                   186                Fixed      8.20%
                          Accrued PIK Interest                     EUR+USD                    5                     5                 NA         0%
                          Accrued Interest                           Various                  4                     4                 NA         0%
                          Wells Fargo Line                             USD                   37                    37               Floating    5.25%      Revolving   Dec.31,2023
                          Other Debt                                 Various                 1                     1                  NA         0%
                          Total Gross Debt                                                 1,307                 1,232                          8.46%
                          Cash & Cash equivalents                    Various                 49                    49
                          Total Net Debt                                                   1,258                 1,183

                               (1) Rates as of September 30, 2021.
                               (2) Cash interest of 6-month EURIBOR with a floor of 0% +6.00% and PIK interest of 6.00%.
                               (3) Cash interest of 6-month USD LIBOR with a floor of 0% +6.00% and PIK interest of 6.00%.
                               (4) Cash interest of 6-month EURIBOR with a floor of 0% + 3.00% and PIK interest of 3.00%.
                               (5) Cash interest of 6-month USD LIBOR with a floor of 0% + 2.75% and PIK interest of 3.00%
                               (6) Of which €10 million are capital leases and €176 million is operating lease debt under IFRS 16
                                                                                                                                                                                                     18
C3 - Restricted Natixis
LIQUIDITY

                                                                                        Amount of credit           Available credit
                               Liquidity at September 30, 2021 (€m)                                                                   Drawn amount   Available amount
                                                                                             line                        line*

                               Cash on hand                                                                                                                 49

                               Committed credit facilities:

                                 Wells Fargo credit line ($125m)                                108                      108               37               71

                               Liquidity                                                                                                                 €120m

                               ► $42.5 million (€37 million) drawn on Wells Fargo line at September 30, 2021 and $82.5 million (€71 million) available

                               ► €5 million used at September 30, 2021 on CH-France’s €40 million committed factoring line

                           * The availability of this credit line varies depending on the amount of receivables.

                                                                                                                                                                        19
C3 - Restricted Natixis
GROUP PROFILE – REVENUE

                                                          YTD Sep 2021                                                                Q3 2021

                                              54%                                                                    48%
                                                         60%                                                                    61%
                          Connected Home                                                            Connected Home

                                                                               23%                                                                      28%
                                                          YTD Sep 2020               DVD Services                                     Q3 2020                 DVD Services
                                                                      22%
                                                                                                                                                24%

                                                           1%                                                                    1%    14%
                                                                17%
                                                                         22%                                               1%                     23%
                                                    1%
                          Corporate & Other                                     Technicolor         Corporate & Other                                   Technicolor
                                                                                Creative Studios                                                        Creative Studios

                                                                                                                                                                             21
C3 - Restricted Natixis
DETAILS OF DEBT AT SEPTEMBER 30, 2021
                          (INCLUDING OP. LEASE DEBT)

                                                                  22
C3 - Restricted Natixis
DETAILS OF DEBT AT SEPTEMBER 30, 2021
                          (EXCLUDING OP. LEASE DEBT)

                                                                  23
C3 - Restricted Natixis
THANK YOU

C3 - Restricted Natixis
You can also read