Exploring Non-Invasive Instruments to Assess the Microbiological Quality and Authenticity of Meat and Meat Products - International ...
←
→
Page content transcription
If your browser does not render page correctly, please read the page content below
Exploring Non-Invasive Instruments to Assess
the Microbiological Quality and Authenticity
         of Meat and Meat Products
 Organized by: Microbial Modelling and Risk Analysis PDG
       Moderator: Panagiotis Skandamis, Researcher,
             Agricultural University of Athens, Greece
       Sponsored by the
                    Please consider making a contribution
  This webinar is being recorded and will be available to IAFP members within one week.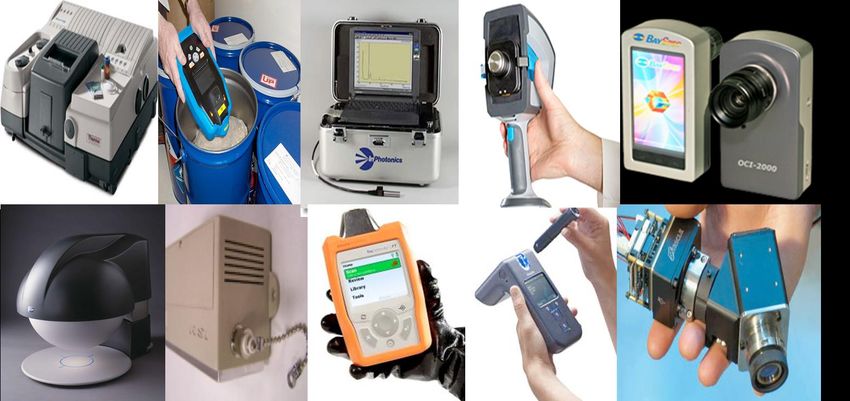
Webinar Housekeeping
  • It is important to note that all opinions and statements are
    those of the individual making the presentation and not
    necessarily the opinion or view of IAFP.

  • All attendees are muted. Questions should be submitted to the
    presenters during the presentation via the Questions section at
    the right of the screen. Questions will be answered at the end
    of the presentations.

  • This webinar is being recorded and will be available for access
    by IAFP members at www.foodprotection.org within one week.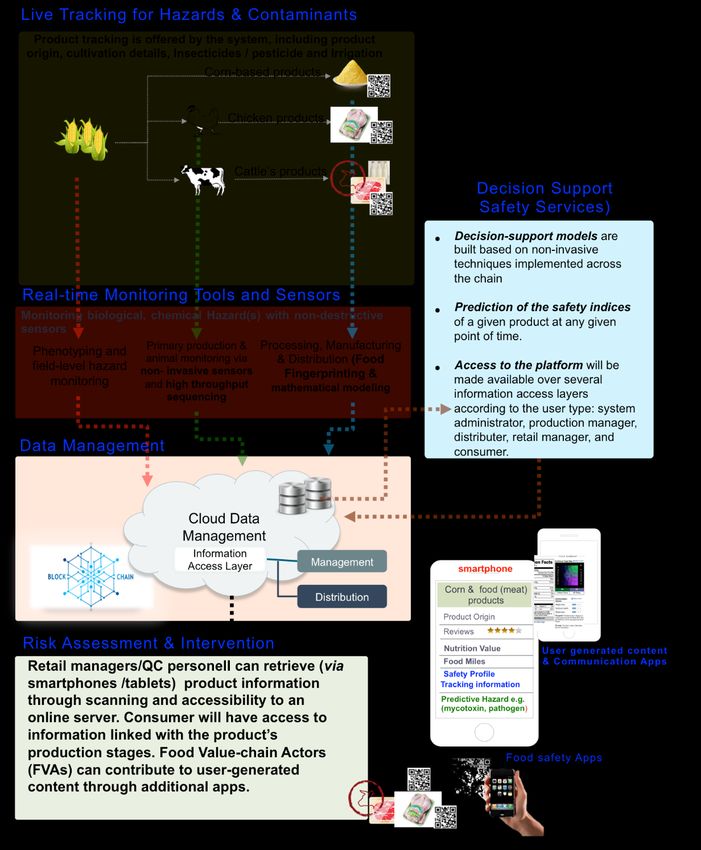
Today’s Moderator
                Panagiotis Skandamis, Moderator
                Researcher, Agricultural University of Athens, Greece

Dr. Panagiotis N. Skandamis is Professor of Food Microbiology and Food Quality Control and Food Hygiene in the Agricultural
University of Athens and member of the BIOHAZ panel of European Food Safety Authority (EFSA). He has worked as a post-
doctoral fellow in the Department of Animal Science of Colorado State University in USA. In 2004, he joined the Department of
Food Science & Technology of AUA. Dr. Skandamis has (co-) authored 187 original research papers in journals of SCI, 30 book
chapters, another two, currently under preparation, edited 1 book and has a total number of 7042 citations (h-index 37).

His research is funded by 5th-7th EU Framework Programs, HORIZON 2020, competitive Grants from Greek Research and
Technology Funding Agency, as well as direct contracts with the Greek Food Industry in the following areas: (i) active
antimicrobial and intelligent packaging of foods; (ii) food spoilage and safety; (iii) biofilm formation and removal by chemical and
natural disinfectants, (iv) predictive microbiology of foods and quantitative microbial risk assessment, (v) application of
antimicrobial interventions; (vi) detection, isolation and subtyping of foodborne pathogens from foods and food processing
environments.

He has been Associate Editor in Food Research International (2012-2017). Currently he is serving as scientific co-editor in
Journal of Food Protection and member of the Editorial Board in Applied and Environmental Microbiology, International Journal of
Food Microbiology and Frontiers in Microbiology.

Dr. Skandamis is member of the scientific committee of International Conference in Predictive Microbiology in Foods (ICPMF)
since 2008, member of the organizing committee of European symposium of International Association of Food Protection (IAFP)
since 2015, and current co-President of the FoodMicro 2020. He is also Chair of the Professional Development Group of
“Microbial Modelling and Risk Assessment” of IAFP.

Predictive Modeling software development: Dr. Skandamis is the developer of GroPIN (www.aua.gr/psomas), a Predictive
Modelling Software tool, which constitutes a database of >400 kinetic and probabilistic models for pathogens and spoilage
organisms in response to a variety of intrinsic and extrinsic foods parameters (e.g., T, pH, aw, preservatives, atmosphere, etc.).
Today’s Presenters
               George Nychas
               Professor, Agricultural University of Athens, Greece

George Nychas is Professor in Food Microbiology in the Dept of Food Science & Human Nutrition of
Agricultural University of Athens (Greece). The last 25 years coordinated 6 European Projects and
participated in more than 35 EU projects (budget >15 M €).

Through these projects, the team of Prof. G-J., Nychas has acquired extensive experience on; (a) on
modelling the behaviour of microbial populations throughout the food chain to assist reliable estimation of
microbial food safety risk (b) Implementation of Process analytical technology (PAT) in Food Industry
introducing sensors (non destructive non- invasive) (c) the assessment of food safety and spoilage through
microbiological analysis in tandem with metabolomics and data mining.

So far he has published 284papers (Scopus) with ca. 14700 citations and h=71 and he is (i) Chairman of
food safety group of European Technological platform food for life (ii) member of the pool of scientific
advisors on risk assessment for DG SANCO, while he served as co-chair (2008-2010) in the Professional
Development Group of “Microbial Modeling and Risk Analysis" of International Association for Food
Protection, member of the Biohazard panel and the Advisory Forum of EFSA, external expertise to the
European Parliament, President of the Greek Food Authority.

Recently (Nov 2018) he was listed among the top 1% of highly cited researchers in the field of Agriculture
Science (Web of Knowledge – Clarivate)
Exploring Non-Invasive Instruments to Assess
     the Microbiological Quality, Fraud
and Authenticity of Meat and Meat Products

              George-John NYCHAS
  Laboratory of Microbiology and Biotelogy of Foods,
   Department of Food Science and Human Nutrition
   Agricultural University of Athens, Athens, Greece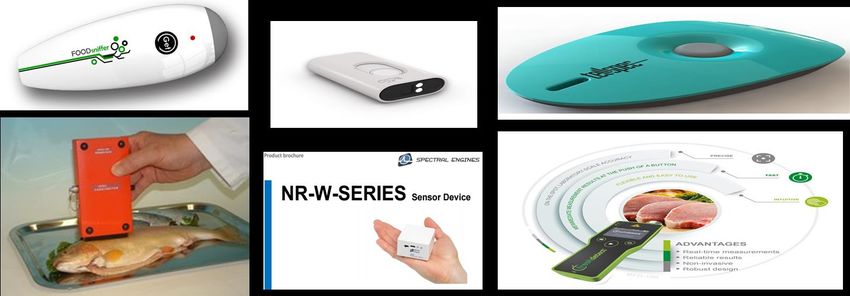
WEBINAR’s STRUCTURE

▪ Definitions; Quality vs Safety vs Fraud vs Food Crime
▪ Current approaches; Assessing Meat Quality, Safety &
  Adulteration
▪ Future approaches; Assessing Meat Quality, Safety &
  Adulteration
▪ Tools; (a) Non-destructive methods for assessing meat
  quality, safety and Fraud (b) Implementation of ML in
  meat quality safety, authenticity (c) loT serving meat
  sector
▪ Use Cases; Meat microbiological quality, beef vs
  horsemeat, beef vs pork & poultry vs pork
WEBINAR’s STRUCTURE

▪ Definitions; Quality vs Safety vs Fraud vs Food Crime
▪ Current approaches; Assessing Meat Quality, Safety &
  Adulteration
▪ Future approaches; Assessing Meat Quality, Safety &
  Adulteration
▪ Tools;(a) Non-destructive methods for assessing meat
  quality, safety and Fraud (b) Implementation of ML in
  meat quality safety, authenticity (c) loT serving meat
  sector
▪ Use Cases;

QUALITY vs SAFETY

Food safety is dealing with all those hazards, whether chronic or
acute, that may make food injurious to the health of consumers,
and is not negotiable.

Quality includes all other attributes that influence a product's
value e.g. spoilage, flavour, texture, contamination and
adulteration.
[QUALITY vs SAFETY] vs FRAUD

Fraud in the context of food, means that the description of the origin of food,
its composition and how it has been obtained and/or prepared, shall be
truthful, i.e.

(i) nothing of lesser economic value must be added, or

(ii) removed if it is of higher economic value.

(iii) the information about origin, composition, etc

Meat fraud:
Examples;
Pork does not belong in a kebab (beef or lamb)or a beef sausage.
[QUALITY vs SAFETY vs FRAUD] vs FOOD CRIME

Food crime can be defined as “serious fraud and related criminality within
food supply chains that impacts the safety or the authenticity of food, drink or
animal feed. It can be seriously harmful to consumers, food businesses and
the wider food industry."

Examples of food crime include the use of stolen food in the supply chain,
unlawful slaughter, diversion of unsafe food, adulteration, substitution or
misrepresentation of food, and document fraud.
WEBINAR’s STRUCTURE

▪ Definitions; Quality vs Safety vs Fraud vs Food Crime
▪ Current approaches; Assessing Meat Quality, Safety &
  Adulteration
▪ Future approaches; Assessing Meat Quality, Safety &
  Adulteration
▪ Tools;(a) Non-destructive methods for assessing meat
  quality, safety and Fraud (b) Implementation of ML in
  meat quality safety, authenticity (c) loT serving meat
  sector
▪ Use Cases;
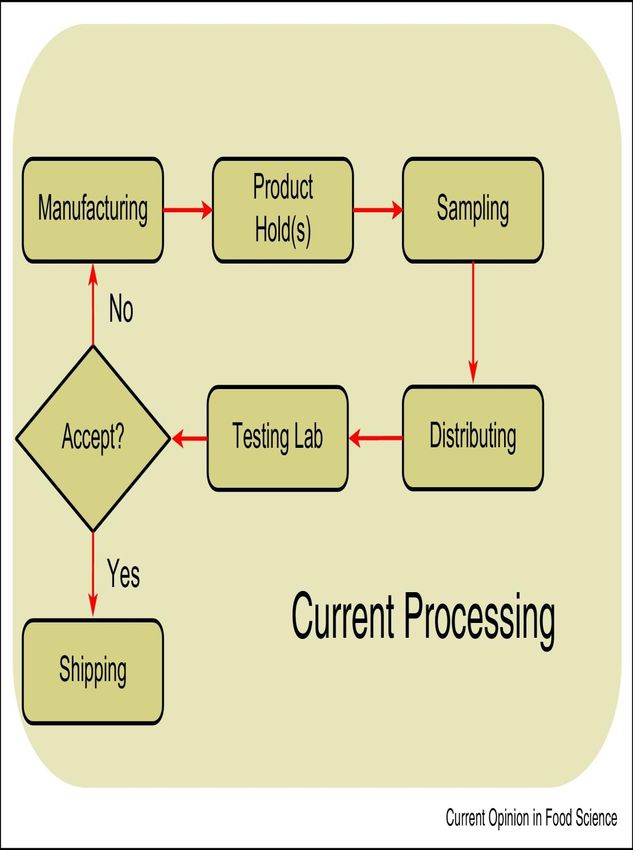
Current Food Safety Management System

  The (whole) production
  process is based on the
  analysis of THE END /
  FINISHED product.

Nychas et al., 2016, Curr. Opin. Food Sci. 12: 13–20
Current Tools
• Sensory analysis (expensive, time-consuming)

• Conventional microbiology (Results in 2-3 DAYS)

• Molecular tools (results in 18-30 HOURS)

• Single (bio-chemical metabolite) compound [not feasible]

• Modelling (Predictive); Few public free and private software are
  available [Initial population should be known (measurements
  take 18 to 72 h)]
  Food Industry, Food Authorities and consumers need
         results in minutes, if not in seconds!!!
                                                 13
WEBINAR’s STRUCTURE ▪ Definitions; Quality vs Safety vs Fraud vs Food Crime ▪ Current approaches; Assessing Meat Quality, Safety & Adulteration ▪ Future approaches; Assessing Meat Quality, Safety & Adulteration ▪ Tools; (a) Non-destructive methods for assessing meat quality, safety and Fraud (b) Implementation of ML in meat quality safety, authenticity (c) loT serving meat sector ▪ Use Cases; Meat microbiological quality, beef vs horsemeat, beef vs pork & poultry vs pork
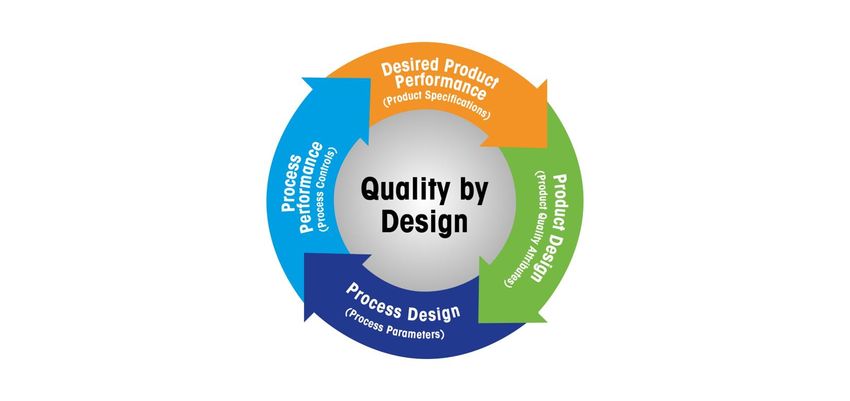
Future Approaches ….

                                                   Process
                                                 Analytical
                                                Technologies

Nychas et al., 2016, Curr. Opin. Food Sci. 12: 13–20
(What is) Process Analytical Technology (PAT)
Basis for the concept of “Quality by Design” : holistic systematic
approach in which predefined specifications, processes and critical
parameters are taken into account in quality controlFuture Tools
Process Analytical Technologies (PAT)
[Implementation of QbD]
• Sensors; In – On – At line analytical instruments to
measure parameters (including Next Generation
Sequencing)
• Data Science; Data Analytics, Data mining, Machine
Learning
• Information Communication TechnologyPAT’s Tools; (a) Sensors In – On –At line non-invasive analytical technologies (desktop, handheld, miniaturized ) based on spectroscopy and/or image analysis to measure quality & safety parameters
PAT’s Tools; (a) Sensors con/ed In – On –At line non-invasive analytical technologies (desktop, handheld, miniaturized ) based on spectroscopy and/or image analysis to measure quality & safety parameters
PAT’s Tools; (a) Sensors .. con/ed
List of representative rapid methods e.g. Imaging and Spectroscopy applied in
meat which their measurement can be ‘translated’ into quality parameters
Type of Food Type Purpose
Sensor
Imaging Beef fillets, Meat, Pork, Spoilage, adulteration (horse),
beef, Chicken fillets, meat colour, pseudomonads,
Packaged beef, Beef and microbial counts
horsemeat (minced)
Spectroscopy Animal origin foods: beef, Spoilage Detection of
pork, lamb, pork, poultry adulteration, Quality control
analysis, Assessment of
microbial contamination
Ropodi et al. Trends in Food Sci. & Techn. 50,11-251.6 ***F1a time1 a1595 a2650 a3772 a4800 a5900 a6la a7109 a9aa a10142 a11149 f1 f2 f3
***F1b 0-0 188137 0 53793 4168 129935 2171460 872928 0 30522 37721 559925.75 26896.5 298792
PAT’s Tools; (b) Data Science …con/ed
1.5 ***10F2 72-0 162172 0 17278 16288 90968 2052876 528128 0 27784 101539 545549.75 8639 199389
***10F3
120-0 117525 12199 9998 1087 59267 1698282 388386 0 19496 113097 457718.75 11098.5 141566.3
***10F5
1.4 168-0 163032 123717 383448 16240 155697 2502703 182667 0 52040 43730 649618.25 253582.5 129409
***10F6
***10F7 216-0 110482 149360 216311 17312 103662 1787944 108295 4613 34377 17436 461092.5 182835.5 84937.75
1.3 ***10F8 264-0 115580 9329 17818 28913 116854 693017 248053 16427 70286 48707 207109.25 13573.5 127350
Data Science; Data mining, Data analysis, Machine Learning
***10F9 336-0 62182 0 50632 17240 71473 526507 489496 7009 105479 136613 193902 25316 160097.8
1.2 ***10F10
384-0 55796 87697 75354 13064 93450 1157255 486248 21012 104511 46081 332214.75 81525.5 162139.5
***10F11
***10F12 0-5 129516 0 146136 4200 97153 2088412 1033919 0 18537 53668 540154.25 73068 316197
1.1 ***10F13 48-5 119447 2657 13319 11497 127042 1916881 735624 0 13948 93442 506067.75 7988 248402.5
***10F14 72-5 131257 50892 19475 12841 75678 2056684 438285 0 19042 51697 531855.75 35183.5 164515.3
1.0
A massive amount of data is generated by various analytical
***10F15 96-5 87139 350175 1705514 1690 62746 2206934 205222 3923 51905 5804 567141.5 1027845 89199.25
***10F16
144-5 26770 67715 74895 11211 110905 1475829 565796 45536 81817 48695 412969.25 71305 178670.5
0.9 ***10F17
***10F18 192-5 42167 21442 61994 13354 175687 519290 370630 42109 233320 121497 229054 41718 150459.5
240-5 27092 45314 93485 43778 119681 129887 420243 25258 403942 128071 171789.5 69399.5 152698.5
0.8
instruments and this is a challenging issue for food safety.
288-5 22800 107817 100262 5711 60663 142774 373663 61758 861875 437588 375998.75 104039.5 115709.3
0-c 175319 0 37362 9754 150843 2543830 532001 0 15777 22211 645454.5 18681 216979.3
0.7
10c 202355 0 37781 28377 133473 2690024 550102 0 38494 28205 689180.75 18890.5 228576.8
21-c 202353 0 32440 22032 148902 2163020 427808 3736 20745 30949 554612.5 16220 200273.8
0.6
31-c 233058 7061 62141 34930 154852 2920061 556933 4103 33822 31548 747383.5 34601 244943.3
43-c 154879 233403 1364954 30000 68046 2231233 600000 13658 33106 7129 571281.5 799178.5 213231.3
0.5
53-c 100000 425579 1298550 25000 154153 2476799 450000 7065 19293 100000 650789.25 862064.5 182288.3
67-c 42359 80834 57332 21371 49853 879401 342373 58181 27885 406869 343084 69083 113989
0.4
79-c 139184 32041 155572 15000 108229 1939082 650000 45903 59927 39578 521122.5 93806.5 228103.3
122-c 54840 21560 80966 1778 105575 805929 654447 60859 380681 729282 494187.75 51263 204160
0.3
0-d 129516 0 146136 5000 97153 2088412 1033919 0 18537 53668 540154.25 73068 316397
0.2
products purpose 10-d
21-d
26-d
399058
241044
158004
0
0
73721
21141
31532
86699
19100
data analysis
99768 2186056 1114078
15969 150005 2439689 914983
14373 81916 2003180 301380
0
3972
5000
25585
23075
41784
81713
54142
31687
573338.5
630219.5
520412.75
10570.5
15766
80210
408001
330500.3
138918.3
0.1
31-d 157901 410132 2328757 15000 11868 2711605 197055 19997 45184 80000 714196.5 1369445 95456
0.0 43-d 131517 33378 50890 28723 59145 1477237 237078 50853 80848 94002 425735 42134 114115.8
Compound AIR MAP
Beef fillets, Meat,
2000 1800
Spoilage, Monitoring
1600 1400
Wavenumbers (cm-1)
0 5
meat
10
1200
15 0
1000
5
Principal
53-d
67-d
79-d10 15
Component Analysis (PCA),
68737
126277
36295
70966
46682
99297
40653
86075
68333
21617
18000
18259
50614 1279652 230283
75965 1891059 150000
38561 1128308 115890
53700
37316
65412
96858 345000
42794 16738
92865 469571
443802.5
496976.75
439039
55809.5
66378.5
83815
92812.75
92560.5
52251.25
Pork, beef,
Aldehydes Prawn,
Octanal *
colour, Adulteration,
+ +
Detection
+ + +
of Principal
0-e
5-e
+ +
Component Regression (PCR)
413801
237618
+
0
8083
62616
54085
39892 134739 2736578 1444463
29723 158403 2332833 1186520
0
7098
38731
38709
97060
65679
718092.25
611079.75
31308
31084
508223.8
403066
11-e 245331 10360 36386 34746 105520 2204399 840886 6603 34499 87590 583272.75 23373 306620.8
Beef, horsemeat,
trans-2-octenal * adulteration, Detection+ + + of + + + Hierarchical
18-e
25-e
+ +
190694
99776
Component Analysis (HCA)
23455 286718
74892 480346
24107
14690
55832 2490581 765878
4241 1272179 228238
14360
18502
39709
28238
37519
29560
645542.25
337119.75
155086.5
277619
259127.8
86736.25
Nonanal * + + + + + +
35-e + +95320 227697 2570049 15096 52654 1857016 168233 45867 69814 26866 499890.75 1398873 82825.75
Minced mutton,
trans-2-Nonenal * adulteration, Discrimination
+ + + + of + + Partially
48-e
68-e
+ + Linear Model (PLM)
71510
61231
87420 256426
92458 437633
26723
20616
18110 1934934 1361547
20332 2599821 47987
78392
54847
44637 123829
50057 35535
545448
685065
171923
265045.5
369472.5
37541.5
3-Phenylpropionaldehyde + + + + + + + +
Pork, Minced beef, beef and horse +meet,
cis-4-Decenal + Quality
+ + + + Partially
90-e
+ + Least Squares Regression (PLS)
50000 330152 63140 21911 102605 323185 359410 471121 420489 985371 550041.5 196646 133481.5
n-decanal * + + + + + + + +
Minced beef control analysis,+ Assessment
trans,trans-2,4-Nonadienal + + + of+ + PLS+ - discriminant
+ analysis (PLS-DA)
trans-2-Decenal + + + + + + + +
microbial
trans,trans-2,4-Decadienal (1) contamination,
+ + + + + + Linear
+ +Discriminant Analysis (LDA)
trans,trans-2,4-Decadienal (2) + + + + + + + +
Ketones
authentication, adulteration Support Vector Machine (SVM)
detection
Diacetyl (3-hydroxy-2-butanone) *
Methyl ethyl ketone (2-Butanone ) *
(pork++ proportion
+
+
+
+
+in +
+ +
+ Least
+
+
+
Squares-SVM,
+
+
2-Pentanone * minced mutton),
Acetyl propionyl (2,3-Pentanedione) *
+ Freshness
+
+
+
+
+
+ (TVB-
+
+
+
+ Artificial
+
+
+
+ Neural Networks (ANN)
+
3-Methyl-2-pentanone
N content),
Acetoin (3-Hydroxy-2-butanone) * Identification
+
+
+
+
+ of
+
+
+
+
-
+ k-Nearest
-
+
-
+
-
Neighbors Algorithm (kNNA)
2-Heptanone *
6-Methyl-2-heptanone
frozen-then-thawed +
+
+ minced
+
+
+
+ beef
+
+
+
+ Random
+
+
+
+ Forest Regression (RFR)
+
labelled
2,3-Octanedione or 2,5- * as fresh+ + + + + + + +
3-Octanone * + + + + + + + +
2-Octanone * + + + + + + + +
3-Octen-2-one + + + + + + + +
Acetophenone + + + + + + + +
Tsakanikas, et al.,(2020) A machine learning workflow for raw food spectroscopic classification in a future industry. Scientific Reports 10:10:111212
2-Nonanone * + + + + + + + +
Nychas et al (2021) Data-3,5-Octadien-2-one
trans,trans Science in the Food Industry. Annual
+ Review
+ of
+ Biomedical
+ + data +Science
+ https://doi.org/10.1146/annurev-biodatasci-020221-123602
+WEBINAR’s STRUCTURE ▪ Definitions; Quality vs Safety vs Fraud vs Food Crime ▪ Current approaches; Assessing Meat Quality, Safety & Adulteration ▪ Future approaches; Assessing Meat Quality, Safety & Adulteration ▪ Tools;(a) Non-destructive methods for assessing meat quality, safety and Fraud (b) Implementation of ML in meat quality safety, authenticity (c) loT serving meat sector ▪ Use Cases; Meat microbiological quality, beef vs horsemeat, beef vs pork & poultry vs pork
USE CASE 1; Assessing microbial quality of minced pork
Combining analytical instruments (metabolomics) & machine
learning
Metabolomics
Pork, beef, fingerprinting
poultry Microbiological
analysis
Regression model
Metabolomics data Bacterial count
(Machine learning)
• The use of metabolomics analytical platform in tandem with machine learning
allows to assess the freshness of meat samples.Combining analytical instruments (metabolomics) &
machine learning
▪ Microbiological spoilage experiments
Packaged in modified
atmospheres (80% O2-
20% CO2) and stored at:
• Isothermal conditions
(4, 8, 12°C)
Minced pork • Dynamic temperature
conditions (periodic
temperature changes
between 4 and 12°C)
4 batches
431 samples
VideometerLab/
Microbiological analysis
FTIR
25Minced pork ; FTIR (A) & VIS (B) measurements; Comparison between
observed and predicted total viable counts (TVC) by PLSR model
A B
Training (solid symbols, 170 samples); validation (open symbols, 58 samples) datasets (solid
line: the ideal y= x line; dashed lines: the ±1 log; The root mean squared error (RMSE, log
CFU/g) for the prediction of the test (external validation) dataset for the FTIR and VIS models
was 0.915 and 1.034, respectively, while the corresponding values of the coefficient of
determination (R2) were 0.834 and 0.788. 26USE CASE 2; Beef vs Pork
Materials & Methods - Sample data
• The original data set consists of 319 minced meat samples.
Specifically:
➢ 100% Pork; 21 batches x 5 replicates = 105 samples
➢ 100% Beef; 22 batches x (4) 5 replicates = 109 samples
➢ 70,50 & 30 % beef vs pork; 21 batches x 5 replicates = 105
samples
• Packaging: MAP (80% O2, 20% CO2).
• Samples were provided from a local meat processing plant.Materials & Methods-Multi Spectral Imaging
(VideometerLab) In ActionMaterials & Methods – Multi Spectral Imaging Wavelengths
(nm)
(VideometerLab) 405
• Wavelengths ranging from 405-
435
450
970nm (visible & NIR region). 470
505
525
570
590
630
645
660
700
850
870
890
910
940
970LDA and PLS-DA (12 PLS components) for both validation set and external
validation batch with 3 classes (pork—adulterated—beef).
LDA PLS-DA
Validation set
classified as classified as
pork adulterated beef Recall pork adulterated beef Recall
is pork 5 1 0 83.3% is pork 5 1 0 83.3%
is is
adulterated
0 54 0 100.% adulterated
0 54 0 100%
is beef is beef
0 0 6 100.% 0 0 6 100%
Precision 100% 98.2% 100% Precision 100.% 98.2% 100%
LDA PLS-DA
EXTERNAL Validation BATCH
classified as classified as
pork adulterated beef Recall pork adulterated beef Recall
is pork 4 0 1 80% is pork 5 0 0 100%
is is
adulterated
0 35 10 77.8% adulterated
0 45 0 100%
is beef is beef
0 0 5 100% 0 0 5 100%
Precision 100% 100% 31.5% Ropodi et al., 2015
Precision 100% 100% 100%USE CASE 3; Beef vs Horsemeat Multispectral Imaging (MSI); a Promising Method for the Detection of Minced Beef Adulteration with Horsemeat (Food Control 2017)
Background knowledge & Previous work
• DNA-based methods are very accurate however, they are expensive,
time-consuming and require highly-trained personnel.
• Limited number of studies have been published concerning rapid
methods and meat adulteration, mostly featuring vibrational
spectroscopy instruments (IR, Raman)
• Concerns/ Limitations of published studies:
– The samples come from one meat batch and is not representative of
variability found in real life.
– The number of tested samples is usually small.
– Validation without external (independent) dataExperiment Design
100% beef The mixed samples were stored
90% beef - 10% horsemeat at 40C for 6, 24 & 48h
80% beef - 20% horsemeat
60% beef - 40% horsemeat
40% beef - 60% horsemeat 240 MS images
were captured
Beef & Horse fillets using
were purchased & VideometerLab.
minced (3 different 20% beef - 80% horsemeat
batches)
Image segmentation
100 % horsemeat &
Data analysis*
Meat was mixed in order to
achieve various % w/w levels
*http://www.metaboanalyst.ca
of adulterationResults con/ed
PCA 3D
pure
• common autolight/calibrationEffect of Storage on adulteration assessment
Principal Components Analysis
• PCA – 2D • PCA – 3D
Pure at 0h
Pure at 0h
• PCA – 2D • PCA – 3DEffect of Storage on adulteration assessment
Partial Least Square Discriminant Analysis
Pure at 0h
Pure at 0h
• PLSDA – 2D • PLSDA – 3DConcerns … .. Since the discrimination among various levels of adulteration is more complex depending on whether the horse samples are freshly minced or not…. a more sophisticated algorithm was used for model development such as FOREST TREE
Results from Random Forest
Only one sample was categorized in
a non-adjacent category.
Only 3.8% of samples were
categorized in a ≥20% category.
Sample Predicted Predicted Predicted as Predicted as Predicted as Class error
as 0 as 60 80 90 100
Is 0 (0 B/100H) 32 0 0 0 0 0.0
Is 60 0 30 2 0 0 0.0625
Is 80 0 3 26 2 0 0.161
Is 90 0 0 0 28 3 0.0968
Is 100 0 0 1 4 27 0.156USE CASE 4; pork vs poultry
Experimental design
Fengou et al., 2021 (Food Control)Confusion matrix for SVM classification for the External Validation
(n=90) of the fresh samples using MSI data considering 3 classes;
0% pork-100% chicken (0%) - adulterated (A) - 100% pork-0% chicken
(100%).
Predicted class
True class 0% A 100% Recall (%)
0% 14 0 0 100.00
A 0 62 0 100.00
100% 0 3 11 78.57
Accuracy (%)
Precision (%) 100.00 95.38 100.00
96.67
Fengou et al., 2021 (Food Control)Support Vector Machine (SVM) classification of fresh, stored at 4o C, and cooked minced pork,
poultry or mixed [0% pork - 100% chicken and vice versa] samples, using Multi Spectral
Imaging data. Nine (9) or three (3) steps of Adulteration were considered while External
Validation evaluated with either 90 or 45 no of samples
type of meat No of condition of adulteration steps/ Accuracy (%)
samples meat samples Replicates External
/validation samples Validation
pork vs 360 Fresh 9 /6/ 90 84,44
poultry,
360 Fresh 3 /6/ 90 96,67
Adulteration
from 0 to 180 stored for 24H 9 /5/ 45 73,33
100%
180 stored for 48H 9 /3/ 45 66,67
(steps either 9
or 3) & 180 stored for 24H 3 /5/ 45 97,78
3,5 or 6
180 stored for 48H 3 /3/ 45 95,56
replicates
180 cooked 9 /5/ 45 84,44
180 cooked 3 /5/ 45 95,56Summarizing …
Number
Type of Data
Food type Purpose of Reference
sensor analysis
samples
Detection of frozen-
FTIR, minced PLSDA, Ropodi et al.,
then-thawed minced 105
MSI beef SVM 2018
beef labelled as fresh.
Minced beef
adulteration with
horsemeat, 110
beef vs. PLSDA, RF, Ropodi et al.,
MSI as well as model (350
horsemeat SVM 2017
performance during images)
storage in refrigerated
conditions.
Minced beef
beef vs. fraudulently PLSDA, Ropodi et al.,
MSI 220
pork substituted with pork LDA 2015
and vice versa.Summarizing …
Type of Number of Data
Food type Purpose Reference
sensor samples analysis
Detection of meat 360 samples/images
Fengou et al.,
pork vs. adulteration in fresh, (fresh)
MSI SVM 2021
chicken stored, and cooked 180 images (stored)
(Food Control)
meat. 180 Images(cooked)
Detecting minced
pork meat substitution of: PLS
vs. (i) beef with bovine 120 samples pork transform
MSI,
chicken offal and vs. chicken ed Fengou et al.,
Vis,
& (ii) pork with chicken 120 samples beef spectral 2021 (foods)
Fluo
beef (and vice versa) both vs. offal data,
vs. offal in fresh and frozen- SVM
thawed samples.Next Generation Strategies …
Future Tools

       Process Analytical Technologies (PAT)
            [Implementation of QbD]

     • Sensors; In – On – At line analytical instruments to
       measure parameters (including Next Generation
       Sequencing)

     • Data Science; Data Analytics, Data mining, Machine
       Learning

     • Information Communication Technology
PAT’s Tools; (c) ICT
Information/data management and continuous optimization
Tsakanikas, et al.,(2020) A machine learning workflow for raw food spectroscopic classification in a future industry. Scientific Reports 10:10:111212
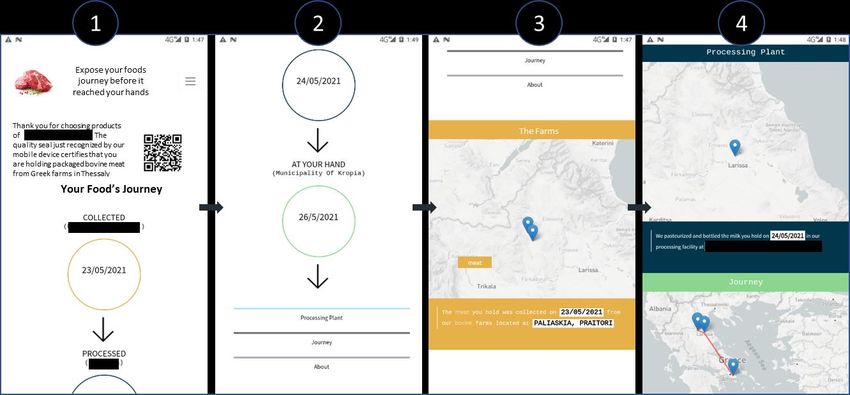
Nychas et al (2021) Data Science in the Food Industry. Annual Review of Biomedical data Science https://doi.org/10.1146/annurev-biodatasci-020221-123602MeatTrack
DEMOCRATIZING TRACEABILITY AND QUALITY
PAT’s Tools; (c) ICT
Agritrack’s CEM
Customer Engagement Module
Ledger
Based Note:
Certificate Product
specific
details
removed
ORIGIN
CERTIFICATE
QUALITY CERTIFICATEMeatTrack
DEMOCRATIZING TRACEABILITY AND QUALITY
PAT’s Tools; (c) ICT
Agritrack’s CEM
Customer Engagement Module
Ledger
Based
Certificate Note:
Product
ORIGIN
CERTIFICATE specific
details
removed
QUALITY CERTIFICATESummary - Conclusions – Future Plans • FTIR, MSI, VIS are indeed a promising methods for assessing microbial quality of meat and meat products as well as for the detection of fraud / adulteration of meat. • Storage of minced meat has a significant effect on the images captured by the MSI instrument and consequently on the final developed model. • More experiments involving different batches should be added, so that the developed model takes into account the variability found among different batches. • Further, independent validation of the model(s) developed should be performed.
Meat adulteration/fraud
1. Ropodi, A. I., Pavlidis, D. E., Mohareb, F., Panagou, E. Z., & Nychas, G. J. (2015).
   Multispectral image analysis approach to detect adulteration of beef and pork in raw
   meats. Food Research International, 67, 12-18.
2. Ropodi, A. I., Panagou, E. Z., & Nychas, G. J. E. (2017). Multispectral imaging (MSI): A
   promising method for the detection of minced beef adulteration with horsemeat. Food
   Control, 73, 57-63.
3. Ropodi, A. I., Panagou, E. Z., & Nychas, G. J. E. (2018). Rapid detection of frozen-then-
   thawed minced beef using multispectral imaging and Fourier transform infrared
   spectroscopy. Meat science, 135, 142-147.
4. Fengou, L. C., Tsakanikas, P., & Nychas, G. J. E. (2021). Rapid detection of minced pork
   and chicken adulteration in fresh, stored and cooked ground meat. Food Control, 125,
   108002.
5. Fengou, L. C., Lianou, A., Tsakanikas, P., Mohareb, F., & Nychas, G. J. E. (2021).
   Detection of Meat Adulteration Using Spectroscopy-Based Sensors. Foods, 10(4), 861.
SPOILAGE; Beef, Pork, Poultry,

▪   Ammor, et al. (2009)– "Rapid Monitoring of the Spoilage of Minced Beef Stored Under Conventionally and Active
    Packaging Conditions Using Fourier Transform Infrared Spectroscopy in Tandem with Chemometrics" Meat
    Science 81, 507-515

▪   Argyri, et al (2010) Rapid qualitative and quantitative detection of beef fillets spoilage based on Fourier
    transform infrared spectroscopy data and artificial neural networks 20/7 Sensors and Actuators B 145, 146-154

▪   Panagou et al. (2011). A comparison of artificial neural networks and partial least squares modelling for the rapid
    detection of the microbial spoilage of beef fillets based on Fourier transform infrared spectral fingerprints. Food
    Micro 28, 782-790

▪   Papadopoulou, et al. (2011) Contribution of Fourier transform infrared (FTIR) spectroscopy data on the
    quantitative determination of minced pork meat spoilage Food Research International 44, 3264-3271

▪   Argyri, et al.(2013) A Comparison of Raman and FT-IR Spectroscopy For The Prediction of Meat Spoilage. Food
    Control 29, 461-470

▪   Papadopoulou, etal. (2013) Potential of a portable electronic nose in rapid and quantitative detection of the
    microbial spoilage of beef fillets. Food Research Int. 50,241

▪   Dissing et al. (2013). Using multispectral imaging for spoilage detection of pork meat. Food and Bioprocess
    Technology 6, 2268-2279

▪   Fengou, et al. (2019) Estimation of Minced Pork Microbiological Spoilage through Fourier Transform Infrared and
    Visible Spectroscopy and Multispectral Vision Technology, Foods (MDPI) 8,238 doi:10.3390/foods8070238
DATA SCIENCE ❑ Ropodi, A, E.Z. Panagou and G.-J. E. Nychas (2016) Data mining derived from Food analyses using non- invasive/non-destructive analytical techniques; Determination of Food authenticity, quality & safety in tandem with Computer Science Disciplines, Trends in Food Science & Technology 50,11-25 ❑ Mohareb, F., Iriondoa, M., Doulgeraki, A.I, Van Hoekc, A., Aarts, H., Cauchia, M, and Nychas, G-J (2015) Identification of meat spoilage gene biomarkers in Ps. putida using gene profiling, Food Control 57, 152-160 ❑ Fengou, L-C., Mporas, I., Syrelli, E., Lianou, A., Nychas, G-J (2020) Estimation of the Microbiological Quality of Meat Using Rapid and Non-Invasive Spectroscopic Sensors IEEE Access - DOI 10.1109/ACCESS.2020.3000690 ❑ Nychas, G., Sims, E., Tsakanikas, P., Mohareb, F. (2021) Data Science in Food Industry. Annual Rev. in Biomedical Data Science (Nature Series) In press
DiTECT: Digital Technologies as
an enabler for a continuous
transformation of food safety
system. Funded by HORIZON
2020 www.ditect.eu

EU / CHINA Project 11/2020 till
10/2023
PhD candidates,                            Academic Staff
Eugenia SPYRELLI,             Stathis PANAGOU (Prof. AUA)
Eva KATSOURI,           Athanasios MALLOUCHOS (Asst Prof)
Eirini SXOINA,                                          )

Post-Doc fellows
Dr. Panos TSAKANIKAS
Dr. Lenia FENGOU
Dr. Evita MANTHOU
Dr. Anastasia LYTOU                             Collaborator
Dr. Dimitris PAVLIDIS                 Prof Fady MOHAREB,
Dr. Fotini PAVLI         Cranfield University, Cranfield, UK,
Dr. Maria Govari                         Mr. Vlassis TSEZOS
                                                 AGRITRACK
Exploring Non-Invasive Instruments to
Assess the Microbiological Quality
and Authenticity of Meat and Meat Products
THANKS FOR YOUR ATTENTION
George-John NYCHAS
Laboratory of Microbiology and
Biotechnology of Foods
Department of Food Science and
Technology Agricultural University of
AthensContact Information • George Nychas gjn@aua.gr • Panagiotis Skandamis pskan@aua.gr
Join us for these upcoming webinars:

December 1 Process Validation to Meet FSMA Regulations Part 3: Validation Report

December 8 Why Quantification? The Road to Revolutionizing Food Safety

January 26, 2022 Practical Guidance for Validation Studies: From Start to Finish

                     More information can be found at
         https://www.foodprotection.org/events-meetings/webinars/
This webinar is being recorded and will be available for access by IAFP members at www.foodprotection.org within one week. Not a Member? We encourage you to join today. For more information go to: www.FoodProtection.org/membership/ All IAFP webinars are supported by the IAFP Foundation with no charge to participants. Please consider making a donation to the IAFP Foundation so we can continue to provide quality information to food safety professionals.
You can also read