Estimation Areas - Geographical grouping for stratification of population estimates - Scotland's Census 2022 - August 2020
←
→
Page content transcription
If your browser does not render page correctly, please read the page content below

Scotland’s Census 2022

    Estimation Areas -
Geographical grouping for
stratification of population
        estimates

        August 2020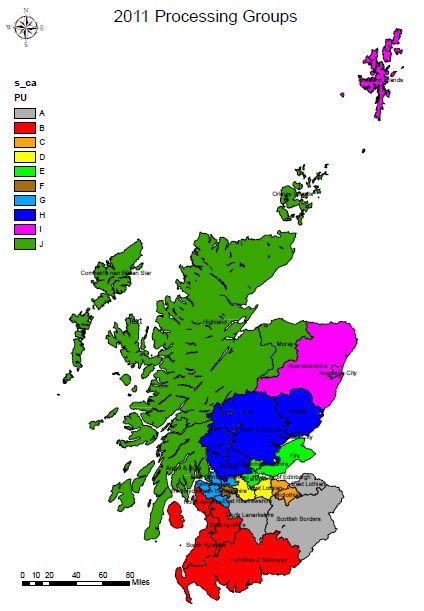
Contents
1.  Plain English Summary ............................................................................................ 2
2.  Executive Summary .................................................................................................. 3
3.  Introduction................................................................................................................ 4
  3.1    Overview of EA Groups .................................................................................... 4
  3.2    Purpose of Document ....................................................................................... 5
4. Summary of Methodology used in 2011 .................................................................. 5
  4.1    The 2011 EA groupings .................................................................................... 5
    4.1.1   How the data was grouped ......................................................................... 5
    4.1.2   Issues in 2011 ............................................................................................. 6
  4.2    2017 Review ..................................................................................................... 8
    4.2.1   Findings regarding the 2011 groupings ..................................................... 8
    4.2.2   Options reviewed ........................................................................................ 9
    4.2.3   Conclusions and Recommendations ......................................................... 9
5. Proposal for 2022 Methodology ............................................................................. 10
  5.1    Changes to Data processing and the Census .............................................. 10
    5.1.1   Changes to Census Collection ................................................................. 10
    5.1.2   Changes to downstream processing........................................................ 11
  5.2    Proposal .......................................................................................................... 11
6. EA grouping method ............................................................................................... 12
  6.1    Considerations around Grouping Approach .................................................. 12
  6.2    Proposed 2017 method .................................................................................. 14
  6.3    Manual EA grouping method.......................................................................... 15
  6.4    Cluster analysis............................................................................................... 16
  6.5    Evaluation........................................................................................................ 19
    6.5.1   Variation..................................................................................................... 19
    6.5.2   Collapsing .................................................................................................. 20
7. Strengths and limitations of methodology ............................................................. 21
  7.1    Potential Concerns ......................................................................................... 22
8. Conclusion............................................................................................................... 22
    8.1.1   Post-stratification....................................................................................... 23
    8.1.2   EA grouping method ................................................................................. 23
9. References .............................................................................................................. 25
10. Appendix ................................................................................................................. 26
  10.1 Appendix A – Definitions ................................................................................ 26
    10.1.1     List of Acronyms .................................................................................... 26
    10.1.2     Geography Definitions ........................................................................... 26
  10.2 Appendix B - Measures of success for Scotland’s Census 2022 objectives,
  as at November 2019. ............................................................................................... 27
  10.3 Appendix C – Maps of EA Groupings ............................................................ 28

                                                                                                                                1
1. Plain English Summary
National Records of Scotland counts Scotland's population using the Census. To
make sure that the count is correct, we must correct for people who do not respond
or respond more than once. We achieve this through a process called Dual System
Estimation (DSE). We must carry out DSE on people with similar response levels to
get the population counts right. To do this we run DSE on areas of Scotland where
we think people are equally likely to respond. This paper looks at how we decide
these groups, called estimation areas (EA).
In 2011 we used groups of Local Authorities that are next to each other as estimation
areas (EA). These worked well. However, there were some problems when our
groups included LAs where different numbers of people responded.
Some of the ways we work have changed since the last Census, which makes EA
groupings less important. We have ways of making people in different areas respond
in similar ways. We also don't need to use the EA groups for other parts of our
processing. However, we recommend that area based EA groups should be used for
DSE. Dividing up the country like this will make it easier for us to make people in the
groups respond the same way. The EAs groups we use in 2022 should made up of
Local Authorities (LAs) and we should group LAs which are we think will respond the
same based on their features. The LAs making up estimation areas do not have to
be next to each other.
We also recommend that the EAs should be reviewed before DSE once we have all
the returns. We can regroup the EAs at that point if the people in the LAs making up
EAs do not respond in a similar way.
We considered four different EA groupings methods in this paper. Two of the
groupings were made manually, while two semi-automatically using a computer
program. One of the automatic approaches has seven groups and the rest have
eight. Based on analysis, the automatic grouping with seven EA groups is the best
approach. Since the Census is now scheduled for 2022, this chosen method should
2be re-run with the final Hard to Count and geographies data in 2021 to determine the
EA groupings for 2022.
Note: On 17 July 2020 Scottish Government announced the decision to move
Scotland’s Census to 2022 following the impact of the COVID-19 pandemic.
2. Executive Summary
Scotland’s population is assessed, accounting for people who are missed or counted
more than once in the Census, using Dual System Estimation (DSE). This method
requires that the population it is run on is homogenous; otherwise, there will be
additional error in the estimates and bias in the lower level estimates for the Local
Authorities (LAs) that make up the population. To make this more likely, DSE is run
on geographical strata, which should encompass regions with similar response rate.
This paper looks at how these geographic strata, called estimation areas (EA),
should be decided on.
In 2011, geographically contiguous groupings, based on groups of LAs, were used
as estimation areas (EA). While these were reasonably effective, there were issues
in some EAs with the LAs underlying them having differing response rates (for
example, the grouping of Aberdeen with Aberdeenshire and Shetland).
The EA groupings were reviewed in 2017 and a recommendation made to regroup
the EAs using non-contiguous LAs to pair those that are expected to be similar in
terms of response. A proposed grouping was put forward, with a recommendation to
re-evaluate this when more details of the 2022 Census method and geography is
known. The purpose of this paper is to carry this out re-evaluation.
EAs are now less necessary due to response rate equalisation and the absence of
batching in downstream processing. However, the recommendation is to continue to
use geographical EA groups as strata for DSE. Stratifying in this way should reduce
the heterogeneity of response rates in the estimation strata during Census through
response rate equalisation. The EAs in 2022 should be based on Local Authorities
3(LAs) grouped based on the similarity of demographics related to the expected
response rate. The LAs making up estimation areas will not necessarily be
geographically contiguous.
It is also recommended that, after collection, return rates are examined and the
levels of heterogeneity assessed. If there is a large amount of within EA
heterogeneity, then post-stratification should be considered, regrouping LAs into
more homogenous strata.
Four different EA grouping methods were evaluated. Three of these judged the
similarity of the EAs by comparison of the Hard to Count (HtC) score, while the
fourth, proposed in the 2017 review, used the HtC index. Two are based on cluster
analysis while the other two utilise a manual approach. The evaluation indicates that
one of the cluster analysis based groupings, with seven EA groups, is the most
advantageous. With the Census now moved to 2022, the recommendation is that
this is re-run with the new HtC and geographies in 2022.
3. Introduction
Scotland’s Census aims to gather information from everyone in Scotland. However, it
is possible that some people will be missed from the Census or their information will
be collected more than once. Dual System Estimation (DSE) 1 is the process that is
used to account for people who are missed or counted more than once in the
population totals. This allows the final population estimates for Scotland to be as
accurate and reliable as possible. DSE is not run on the whole country in one go.
Instead the country is stratified into estimation areas before this process is run.
3.1 Overview of EA Groups
Estimation area (EA) groupings serve two purposes: to increase the speed of
processing by creating more manageable dataset sizes; and, importantly, to
1
More information on DSE can be found in the Estimation and Adjustment methodology paper
https://www.scotlandscensus.gov.uk/documents/Scotlands%20Census%202021%20-%20SMDP%20-
%20Estimation%20and%20Adjustment%20Methodology%20paper%20(pdf).pdf
4decrease the risk of heterogeneity errors in our estimates by estimating the level of
undercount for smaller areas with similar levels of non-response. In 2022 changes to
collection methodologies make batching of data for processing less necessary, but
there remains a need to conduct DSE on estimation areas with homogenous
response rates.
Estimates are conducted on EA subgroups made by combining each EA with the 5
Hard to Count strata (HtC) 2. To increase the homogenous response rates within
each EA subgroup, non-response follow up for the Census will be prioritised to areas
which deviate furthest from the EA subgroup mean response rate.
3.2 Purpose of Document
This paper aims to re-evaluate the EA groupings with the finalised HtC/ planning
area definitions and in the light of changes to Census collection and downstream
processing. Consistent with the findings of the 2017 review, EA grouping is carried
out based on grouping together existing Local Authorities (LAs). The method of
manual grouping is refreshed based on up to date information and evaluated
alongside the original 2017 proposal and two groupings using clustering algorithms
to obtain groupings of similar LAs.
4. Summary of Methodology used in 2011
4.1 The 2011 EA groupings
4.1.1 How the data was grouped
During all stages in 2011, from capture to output preparation, data was grouped into
the same ten Estimation Areas, also known as Processing Units. Each EA contained
one or more LAs (see Table 1) with approximately equal estimated populations in
each EA - around 500,000. Where possible, each EA contained geographically
adjacent LAs, although one exception was made to allow for practical issues
2
More information on HtC can be found in the Developing a Hard-to-count Index paper
https://www.scotlandscensus.gov.uk/external-methodology-assurance-panels-emaps-0
5associated with data collection (Shetland was grouped with Aberdeen). Contiguous
groups were also used in 2001 (see Table 2) although these differed from those
used in 2011. Maps showing the geographical distribution of processing groups for
2011 and 2001 can be found in Appendix B.
While the need for homogeneity for optimal estimation processing was
acknowledged, the design of processing groups for 2011 focussed more on
contiguity than homogeneity as it was felt to be the most appropriate approach to
meet upstream and early downstream requirements. It was suggested that
functionality could be provided within the data processing system to allow regrouping
of EA in order to better meet the balance between contiguity and homogeneity. In
particular it was noted that the most likely areas that would need revision for the
purpose of homogeneity would be the divorcing of Dundee and Aberdeen from their
surrounding areas. However, no changes to the EA were made during live 2011
processing.
4.1.2 Issues in 2011
LAs were grouped together to meet the needs of field operations and to obtain
approximately equal numbers across all EAs. Review and analysis of Census 2011
suggests that these groupings potentially did not best meet the needs of the
estimation process, particularly where LAs with markedly different demographics
were grouped together. For example Aberdeen, Aberdeenshire and Shetland in EA I.
This issue was evident during estimation and adjustment; however no major issues
relating to how the LAs had been grouped were reported during other parts of
census processing.
6Table 1: EA in 2011
Estimated
EA Council Area % of total
population
A Scottish Borders, East Lothian, South Lanarkshire
10.0
B Dumfries & Galloway, East Ayrshire, North Ayrshire, South
9.9
Ayrshire
C Edinburgh, Midlothian 10.6
D North Lanarkshire, West Lothian 9.7
E Clackmannanshire, Falkirk, Fife
10.8
F Glasgow 11.2
G West Dunbartonshire, East Dunbartonshire, East
10.2
Renfrewshire, Inverclyde, Renfrewshire
H Angus, Dundee, Perth & Kinross, Stirling 9.4
I Aberdeen, Aberdeenshire, Shetland 9.4
J Argyll & Bute, Highland, Moray, Orkney, Na h-Eileanan An Iar 8.7
7Table 2: EA in 2001
Estimated
EA Council Area % of total
population
1 Dumfries & Galloway, North Ayrshire, South Ayrshire, East
12.3
Ayrshire, Scottish Borders
2 East Lothian, Midlothian, Edinburgh, West Lothian 15.1
3 Falkirk, Stirling, Clackmannanshire, Fife 12.2
4 Aberdeen, Aberdeenshire, Moray 10.3
5 Dundee, Angus, Perth & Kinross, Highlands, Orkney,
13.1
Shetland, Na h-Eileanan An Iar
6 South Lanarkshire, North Lanarkshire 12.4
7 Glasgow, East Renfrewshire, East Dunbartonshire, West
17.8
Dunbartonshire
8 Inverclyde, Renfrewshire, Argyll & Bute 6.9
4.2 2017 Review
Due to these issues there was a review of estimation areas in 2017. It found that
while 2011 EAs had been beneficial, there was room for improvement.
4.2.1 Findings regarding the 2011 groupings
The EAs used in the previous census worked well in terms of allowing processing to
progress in batches and the size of each EA was manageable. Processing complete
LAs together allowed statistical quality assurance (SQA) to be undertaken with
minimal reworking of the comparator sources and effectively utilized existing staff
knowledge of the council area.
However, the diversity of the response level within the EA had a noticeable impact
on production of the estimates both in terms of the accuracy of the estimates and in
8the width of the confidence intervals around those estimates. Response levels varied
considerably over age groups, tenure and data zone as well as across other sub
groupings. Therefore, there is a need to consider alternative groupings which
minimise the heterogeneity of response rates within the EA as part of the process of
ensuring the best possible estimates are produced.
4.2.2 Options reviewed
The 2017 review examined three main options for grouping EAs in 2021: the 2011
groupings, new, non-contiguous groupings of LAs, and groupings based purely on
the demographics of the planning areas.
The advantage of grouping by council area is that it would minimise the additional
work required to enable effective SQA. However, these groupings would not need to
be the same as those used for 2011. Instead, the 2017 review suggested a better
approach would be to group together LAs with similar demographics and therefore
similar expected levels of response. The proposed grouping used hard to count
(HtC) levels generated for 2011 and splits LAs according to the percentage of their
data zones at each HtC level.
Another option considered was forming EA groups on the basis of the demographics
of the population. Data zones were used as a basic unit of geography and then
grouped depending on demographics in a similar way to the generation of HtC
levels.
4.2.3 Conclusions and Recommendations
The 2017 review recommended grouping LAs together based on similarity of
demographics/ expected response rate, using the percentage of data zones at each
Hard to Count level to achieve this. Eight groupings were proposed, rather than ten
which were used for the 2011 census. The review recommended that these
groupings should be reviewed once the final Hard to Count (HtC) levels had been
9generated and the distribution of data zones across the levels in each council area
had been reviewed.
5. Proposal for 2022 Methodology
5.1 Changes to Data processing and the Census
There have been a number of changes to the planned approach for the 2022 Census
since both 2011 and the 2017 review that are important for the chosen EA groups.
These can broadly be grouped into changes to Census collection and changes to
downstream processing.
5.1.1 Changes to Census Collection
The first major change to Census collection is the move to digital first. This should
mean that the majority of returns are via the digital capture channel. This will reduce
the capture and coding lead times meaning that processing will start on return data
earlier. In addition there is no batching of returns by suppliers as in 2011, instead the
data will be provided in a constant drip feed as soon as it is available.
There have also been changes to the prioritisation of follow-up enumeration
methodology for field force. An algorithm will be used to equalise response rates
across EA-HtC subgroups by prioritising follow up to the Planning Area (PA) with the
response rate furthest from the subgroup mean. This should increase the
homogeneity within EAs significantly.
Finally, the low level geography used by Census collection and the Census
Coverage Survey (CCS) 3 has changed from data zones to planning areas since the
2017 review. This further reinforces the need to update the EA groupings
recommended in the review with the final PA-HtC definitions.
3
More information on the CCS sample methodology can be found in the CCS Sample Methodology
and the CCS Sample Allocation and Reserve Sample papers
https://www.scotlandscensus.gov.uk/external-methodology-assurance-panels-emaps-0
105.1.2 Changes to downstream processing
Due to the availability of quickly available, drip-fed, returns, cleansing in the 2022
Census will operate with a more on demand approach. Cleansing processes will be
run regularly as data comes in, rather than on large batches of data at once. Some
processes, such as Resolve Multiple Responses (RMR), require all returns in that
area to be present in order to be finalised. In this case, processing will be run
iteratively until a complete dataset is available, allowing clerical checks to be spread
over a larger time period.
There are also changes to the way Edit and Imputation (E&I) is conducted. More
computational resources mean that E&I can be conducted on larger data sets. At the
same time it seems likely that conducting E&I on several batches will increase QA
times as the same checks would need to be replicated on each batch. Finally, E&I
works best on geographically close areas, as imputation from distant records can
cause issues. Given that current plans are to have non-contiguous EA groups, these
would not make optimal batches for E&I. For these reasons E&I will be conducted on
the whole population together rather than in batches.
5.2 Proposal
The proposal is to stratify the estimates by geographical area, called Estimation
Areas (EA). Stratifying in this way should reduce heterogeneity of response rates in
the groups that estimates are created for, reducing bias and error. The EAs in 2022
should be made up of LAs grouped together based on similarity of demographics
related to expected response rate. The LAs making up an estimation area will not
necessarily be geographically contiguous.
In addition, it is recommended that after collection, return rates are examined and
the levels of heterogeneity assessed. If there is a large amount of within EA
heterogeneity then post stratification should be considered, regrouping LAs into
more homogenous strata.
11Four different EA groupings were evaluated (below) based on their likely within
group variability, likely level of collapsing of strata and size. All three judge similarity
of the EAs by the comparison of Hard to Count (HtC) score 4. Two are based on
cluster analysis while another utilises a manual approach:
1. 2017 Proposal – Highest variation across the EA-HtC groups, high levels of
collapsing. Relatively equal grouping in terms of number of households.
2. Manual approach – This produced a fairly equal division of the household
population and a lower variation that the 2017 proposal.
3. Cluster analysis algorithm with eight groups – This approach has less risk of
collapsing (particularly HtC 3) compared to the manual approach. It also
produced groupings with the lowest variation in HtC score. The grouping by
similarity of the whole HtC score range, rather than on the basis of one HtC
index group and a time, might also reduce the heterogeneity - for example if
areas that neighbour other HtC index areas respond differently to those who
do not.
4. Cluster analysis algorithm with seven groups – This grouping also has less
risk of HtC collapsing (again HtC 3) than the manual approach, and lower
collapsing risk than the eight group cluster analysis. It also has less risk of
collapsing non-white groups in island LAs as they are grouped with other LAs.
As with (3) it benefits from grouping by similarity of the whole HtC score
range. It also has a fairly equal division of the household population.
Based on this evaluation the seven group algorithm (number 4) was chosen as the
most optimal grouping. This algorithm should be re-run on the final HtC index and
geographies in 2021 to produce the final grouping.
6. EA grouping method
6.1 Considerations around Grouping Approach
4
The HtC score is based on a number of demographic features of areas and is intended to predict
response rates.
12The changes to Census processing have a number of consequences for the creation
of EA groups. The move away from batching means that EA groups are solely for the
purpose of estimation, rather than serving a purpose for consistent end to end
batching through processing. This means that the restrictions on EA groupings are
reduced.
As the response equalisation algorithm used during collection aims to remove the
issue of response rate heterogeneity, one possibility is to not use any EA groups and
simply use the five HtC index areas as strata. This would, however, be very
optimistic about the extent to which the algorithm will be able to equalise response
across distant geographic areas, particularly given that it was not tested in the
Census 2019 rehearsal. Also, using large EA areas might make the process more
difficult, as the range of field workers would increase.
Another possibility would be to treat the whole country as one area for the response
rate equalisation mechanism, but once collection is finished, post stratify by the
response rates that are observed (from return rates). This would mean EA groups
could be chosen based on a much better metric to reduce heterogeneity than using
HtC composition or some other demographic feature as a proxy. However, this
would still have the previously mentioned issue of hindering the equalisation
mechanism. It therefore is better to select EA groups in advance that are likely to
have similar response rates, then post stratify these groups for Estimation if
necessary.
A final possibility is to not use LAs as the basis for EA groupings, instead grouping
planning areas according to their demographics. This option was rejected in the past
as LAs are useful for SQA, which is still the case. Any groupings would also likely be
very similar to HtC index groups, as this is attempting to do a similar thing (group
planning areas by likely response rate). In addition, such groupings might cause
complications for the response rate equalisation algorithm which is set up under the
assumption of LA groups.
13A number of approaches have been considered for grouping EAs out of LAs. As a
baseline there are the 2017 proposed groupings. These could be improved by,
instead of using their breakdown into HtC index groups by proportion, instead
making use of the raw HtC score underlying this which would add granularity. The
process of finding LAs that are similar across a wide range of scores is complex and
there are a huge number of possible combinations, therefore the use of a clustering
algorithm may provide a better approach to finding the optimal combination.
6.2 Proposed 2017 method
The three island LAs where grouped together as they have very similar HtC
distributions and are likely to share similar factors affecting response rate. The
remaining 29 LAs were split based on the proportions of data zones within the
council area at each HtC level. As the four cities have a very high proportion (>5%)
of the hardest to count HtC (5), they should be in separate EAs. They were split into
two separate EAs to manage the size. Glasgow, as the largest, on its own and the
other three together.
After this, the easiest to count (HtC1) LAs were put into a group. A minimum of 60%
in HtC 1 was selected as the criteria for this group. The remaining 20 LAs were then
ranked according to the percentage of data zones in the two easiest to count
categories (HtC 1 and 2). Determining where to split these was a bit more subjective
- for example East Lothian could have been the last council area in EA 6 or the first
in EA 7. The final suggested groupings were made taking into account estimated
population sizes and trying to have a reasonably even split of the population across
EA.
14Table 3: 2017 EA proposal
Estimated
% of
EA Council Area
household
population
1 Na h-Eileanan An Iar, Orkney Islands, Shetland Islands
1.36%
2 Glasgow 12.04%
3 Aberdeen City, Dundee City, City of Edinburgh 16.67%
4 Fife, Inverclyde, North Ayrshire, Renfrewshire, Stirling 15.99%
5 Falkirk, North Lanarkshire, Perth and Kinross, South
Lanarkshire 17.65%
6 Angus, Argyll and Bute, East Lothian, Highland, Scottish
Borders, West Dunbartonshire 13.97%
7 Clackmannanshire, East Ayrshire, East Dunbartonshire, East
Renfrewshire, South Ayrshire, West Lothian 11.89%
8 Aberdeenshire, Dumfries and Galloway, Midlothian, Moray 10.44%
6.3 Manual EA grouping method
Use of the HtC score allows a more fine grained way of comparing LA-HtC index
subgroups. This was used to supplement the 2017 method. Firstly, the island LAs,
Glasgow, and the three cities (as the next three areas with the highest proportion of
HtC 5), were grouped. The remaining LAs were divided in to two based on whether
HtC 1 and 2 planning areas made up greater than or less than a 95% proportion of
them. Those with proportion less than 95% were ordered by average HtC 2 score,
dividing them in to groups of around 300,000 households. Those with a proportion
higher than 95% were grouped using the average HtC 1 score instead, to similarly
break them up in to groups.
15Table 4: EA derived from manual approach
Estimated
% of
EA Council Area
household
population
1 Na h-Eileanan an lar, Orkney Islands, Shetland Islands
1.36%
2 Glasgow 12.04%
3 Aberdeen City, Dundee City, City of Edinburgh 16.67%
4 Aberdeenshire, Argyll and Bute, East Lothian, Highland,
14.43%
Scottish Borders
5 Dumfries and Galloway, East Dunbartonshire, Midlothian,
Moray 7.86%
6 East Renfrewshire, North Ayrshire, South Lanarkshire, West
13.16%
Lothian
7 Clackmannanshire, East Ayrshire, Falkirk, North Lanarkshire,
Perth and Kinross, South Ayrshire 17.17%
8 Angus, Fife, Inverclyde, Renfrewshire, Stirling, West
17.31%
Dunbartonshire
6.4 Cluster analysis
An alternative method to a manual approach is to use a machine learning cluster
algorithm to quickly create optimal groupings. The first step is to define a feature to
maximise. The best approach to achieve groups with similar numbers of planning
areas across the whole HtC range is to maximise similarity of the HtC score
distribution. To do this, a density profile was estimated and numerically integrated
over. Intersections of each LA’s HtC score distributions were calculated as
proportions – a score of 1 indicates a perfect overlap, zero indicated no overlap. With
this method we have a score for how similar two LAs are by how much overlap there
is in their HTC score profiles. Figure 1 illustrates this with a density plot of Aberdeen
City and West Dunbartonshire, showing the proportion of overlap.
16Figure 1: Density distribution of Aberdeen City compared to West Dunbartonshire
The best suited clustering methods for this format of data is a hierarchical algorithm.
Under this method, LAs with good overlaps were grouped iteratively. Firstly, the two
LAs with the most similar scores are grouped, then groups are combined on the
basis of the similarity between each member of the two groups, the two groups being
combined if their most dissimilar LAs are less dissimilar than in any other
combination. In order to group them with a hierarchical clustering method the scores
were inverted such that small scores indicate similarity. This is achieved by dividing
1 by the overlap score.
17Table 5: EA grouping using cluster analysis - 8 groups
Estimated
% of
EA Council Area
household
population
1 Na h-Eileanan An Iar, Orkney Islands, Shetland Islands
1.36%
2 Glasgow 12.04%
3 Aberdeen City, Dundee City, City of Edinburgh 16.67%
4 Inverclyde, Renfrewshire 4.99%
5 North Lanarkshire, West Dunbartonshire, West Lothian, North
Ayrshire, Clackmannanshire 14.62%
6 Angus, East Lothian, Fife, Perth and Kinross, Scottish
Borders, South Ayrshire, Stirling 19.45%
7 East Ayrshire, Falkirk, Midlothian, South Lanarkshire
12.51%
8 Aberdeenshire, Argyll and Bute, Dumfries and Galloway, East
Dunbartonshire, East Renfrewshire, Highland, Moray 18.36%
Hierarchical clustering allows the number of groups to be controlled. Two
approaches for the number of groups were used. Firstly, an approach in which the
algorithm is instructed to create six groups from the data, with the islands and
Glasgow removed and treated as two additional groups, to make a total of eight
groups. Secondly, an approach in which the algorithm is instructed to create eight
groups, and Na h-Eileanan An Iar, which the algorithm grouped on its own, is
merged with the other islands in group 1, to form seven groups.
18Table 6: EA grouping using cluster analysis - 7 groups
Estimated
% of
EA Council Area
household
population
1 Aberdeenshire, Dumfries and Galloway, East Dunbartonshire,
Highland, Orkney Islands, Shetland Islands, Na h-Eileanan An
Iar 14.77%
2 Glasgow 12.04%
3 Aberdeen City, Dundee City, City of Edinburgh 16.67%
4 Argyll and Bute, East Renfrewshire, Moray 4.95%
5 Clackmannanshire, Inverclyde, North Ayrshire, North
Lanarkshire, Renfrewshire, West Dunbartonshire, West
Lothian 19.60%
6 Angus, East Lothian, Fife, Perth and Kinross, Scottish
Borders, South Ayrshire, Stirling 19.45%
7 East Ayrshire, Falkirk, Midlothian, South Lanarkshire
12.51%
6.5 Evaluation
The results from the various grouping methodologies were compared using three
criteria. Firstly, the variation (Standard Deviation) within each EA-HtC subgroup was
found and averaged across each EA in each HtC. These scores were examined and
compared for each method. Secondly, the likely level of collapsing was examined.
To do this the number of planning areas (PAs) in each EA-HtC subgroup were
compared. Small numbers of PAs could indicate an issue. Finally, the number of
people from minority ethnic groups, based on the previous Census, was determined
for each EA. Small numbers could again indicate a problem for estimation.
6.5.1 Variation
19Table 7 shows the standard deviations of the HtC-EA subgroups, averaged across
HtC for the four EA groupings. The three HtC index based groupings all perform
notably better than the 2017 proposed grouping. There is not a large amount of
difference between the three new proposals in terms of variation however. The eight
group cluster algorithm approach has the lowest, followed by the seven group
algorithm and finally the manual approach.
Table 7: Average SD of HtC subgroup across each HtC index for the various EA groupings
Grouping HtC1 HtC2 SD HtC3 SD HtC4 SD HtC5 SD Total
SD SD
EA 2017 11.1 22 13.7 16 10.7 73.5
proposed
Manual 11 22 13.8 14.3 10.7 71.8
Grouping
Clustering 8 10.9 22.2 13.7 14.5 9.6 70.9
Groups
Clustering 7 11.1 22 12.9 14.6 10.7 71.1
Groups
6.5.2 Collapsing
The amount of strata collapsing likely to be needed was examined for the four EA
groupings. When there are less than five PAs available for DSE in an EA-HtC strata,
they are collapsed together for the purposes of DSE to increase statistical power and
decrease error. The number of PAs available is constrained by the number sampled
in the Census Coverage Survey (CCS). There is uncertainty around which areas will
be sampled in the CCS, but it will be around 9% of Census PAs, meaning that
subgroups with less than 50 PAs are at risk for collapsing.
Based on this threshold of 50 PAs for collapsing, the two EA groupings generated by
cluster analysis have the lowest level of collapsing: the seven group method has
eight subgroups in danger of collapsing while the eight group method has 10
20subgroups. With the two manual methods showing higher collapsing - both manual
methods have 11 subgroups in danger of collapsing.
The differences in collapsing levels are due to two HtC 3 groups requiring collapsing
for both the 2017 and manual methods. For both the cluster analysis based
approaches there was no HtC 3 collapsing. Collapsing in the HtC 4 and 5 groups
was relatively consistent across the four methods, with collapsing being likely for
these HtCs across all groups apart from the cities in all the methods.
The non-white population was also examined to see if there were any concerns
around collapsing for this group in any of the groupings. This was only found to be
an issue in the island grouping. For this reason the seven group cluster grouping
which did not include an island EA performed best in this evaluation.
7. Strengths and limitations of methodology
All the new approaches performed well, markedly better than the 2017 proposal.
Both the cluster analysis algorithms have good performance in the evaluation, with
the lowest variation in HtC score within groups. Importantly, they avoid collapsing
HtC 3 groups with HtC 2 as much. In addition it seems possible that the approach of
judging similarity across the whole HtC score range distribution might cause them to
have more homogenous response rates than analysis of HtC score variation would
suggest. This might be the case if neighbouring other HtC levels influence response
rate for instance.
The main differences between the two approaches are the inclusion of the islands as
a separate group and the equality of the groups in terms of number of households.
The island group is small and may cause collapsing issues, particularly for non-white
ethnic groups. However, it is possible that the response patterns for island
communities will be similar, beyond what is suggested by the HtC score. The seven
group approach also has more even group sizes.
21The manual method also performs well. It shows slightly higher HtC subgroups than
the cluster approaches. It also has a more even split of households across the EA
groups than the eight group cluster analysis approach which should mean that the
variation of the estimates is more consistent across EA groups for this method as
well as the seven group cluster analysis method.
7.1 Potential Concerns
With the delay in the Census to 2022, the data set that was used to create these
groups is now not the final version. Therefore, the groupings will need to be updated
in 2021 when the final HtC and geographies are created. The recommendation is
that an algorithm is chosen now, and re run on the final data set to create the
groupings.
All the proposed methods decrease the number of EA groups from the 10 that were
used in 2011. The advantage of this is that they will have less collapsing and likely
lower estimate variance. The reduction in groups is due to the low level of
geographic variation in response rates expected across many rural LAs away from
the large cities. If these LAs instead have more variation in response rates, then a
higher number of groups to divide into those with similar response would be a better
approach.
The methods used rely heavily on the HtC index groups and HtC score being a good
predictor of response rates. If there is another source of response rate variation not
captured in the HtC model (for example, digital exclusion), the groupings described
may not adequately divide the county into groups with similar response rate. In this
case, however, post stratification would allow regrouping along different lines.
8. Conclusion
This review of the EA groupings method examines the approach that should be
adopted for 2022 and suggests that with minor modifications the approach proposed
in 2017 is appropriate. While there have been a number of changes to the working
of the Census that effect EA groups, such as response rate equalisation during
22collect and no batching outside of estimation and adjustment for data processing,
there still seems to be a good rational for creating estimates stratified by
geographical groupings. Given the benefits to SQA, the geographical areas created
should be groupings of LAs, although unlike in 2011, they do not have to be
geographically contiguous.
8.1.1 Post-stratification
Designating these EA groups before collection starts will be likely to improve their
homogeneity via response rate equalisation. However, it seems sensible to re-
examine how well this has worked after collection has finished using the return rate.
If EA subgroups within EAs have high variation in the return rate, then this could be
improved by post stratification. LAs could be re-grouped on the basis of the return
rate, that should provide a more exact estimate of the response rate than the HtC
score.
8.1.2 EA grouping method
Four EA grouping methods were examined, three utilising HtC score to judge
similarity, and the 2017 approach, updated with new data, which uses the HtC index
proportion. The three new approaches all performed better than the 2017 method
using HtC index, but there are some variations between them. All four options are
presented below:
1. 2017 Proposal – Highest variation across the EA-HTC groups, high levels of
collapsing. Relatively equal grouping in terms of number of households.
2. Manual approach – This produced a fairly equal division of the household
population and a lower variation that the 2017 proposal.
3. Cluster analysis algorithm with eight groups – This approach has less risk of
collapsing (particularly HtC 3) compared to the manual approach. It also
produced groupings with the lowest variation in HtC score. The grouping by
similarity of the whole HtC score range, rather than on the basis of one HtC
index group and a time, might also reduce the heterogeneity - for example if
23areas that neighbour other HtC index areas respond differently to those who
do not.
4. Cluster analysis algorithm with seven groups – This grouping also has less
risk of HtC collapsing (again HtC 3) than the manual approach, and lower
collapsing risk than the eight group cluster analysis. It also has less risk of
collapsing non-white groups in island LAs as they are grouped with other LAs.
As with (3) it benefits from grouping by similarity of the whole HtC score
range. It also has a fairly equal division of the household population.
Based on both the low level of collapsing and the equality of the groups in terms of
household size, number 4, the seven group cluster analysis algorithm is the
recommended approach.
Due to the delay in the Census to 2022, the HtC index and geographies have not yet
been finalised and will be next year. Therefore the recommendation is to choose the
algorithm now, and run it again on the final data in 2021 to choose the finalised
grouping.
249. References
Estimation and Adjustment Methodology
https://www.scotlandscensus.gov.uk/documents/Scotlands%20Census%202021%20
-%20SMDP%20-
%20Estimation%20and%20Adjustment%20Methodology%20paper%20(pdf).pdf
Developing a Hard-to-count Index
https://www.scotlandscensus.gov.uk/external-methodology-assurance-panels-
emaps-0
CCS Sample Methodology
https://www.scotlandscensus.gov.uk/external-methodology-assurance-panels-
emaps-0
CCS Sample Allocation and Reserve Sample
https://www.scotlandscensus.gov.uk/external-methodology-assurance-panels-
emaps-0
2510. Appendix
10.1 Appendix A – Definitions
10.1.1 List of Acronyms
CCS Census Coverage Survey
DSE Dual System Estimation
EA Estimation Area
E&I Edit and Imputation
HtC Hard to Count Index
LA Local Authority
PA Planning Area
RMR Resolve Multiple Responses
SQA Statistical Quality Assurance
10.1.2 Geography Definitions
Data Zone The data zone geography covers the whole of Scotland and
nests within local authority boundaries.
Estimation Areas The estimation areas are made up of council areas grouped
together based on similarity of demographics related to
expected response rate. The council areas making up an
estimation areas will not necessarily be geographically
contiguous
Hard to Count Index The Hard to Count index is a scale of 1 (easiest to count) to
5 (hardest to count) which was created to indicate how
difficult it may be to enumerate a particular geographic al
area based on certain demographic features.
Local Authority Local Authorities are the 32 council areas within Scotland.
Planning Areas Planning Areas are geographic areas built from groups of
postcodes and averaging between 200-400 residential
addresses. They nest within Local Authorities.
2610.2 Appendix B - Measures of success for Scotland’s Census 2022
objectives, as at November 2019.
How will we measure success?
How we will achieve high quality results? (Level 1 Key Performance Indicators (KPIs)1
and acceptance levels)
We will maximise our overall person
Person response rate2 of at least 94%
response rate
We will ensure a minimum level of
Person response rate in every council
response with every local authority in
area of at least 85%.
Scotland
Variability3: national estimates will
We will maximise the accuracy of our
achieve 95% Confidence Intervals (CI)
national population estimates
+/- 0.4%; Bias: < 0.5%
We will maximise the accuracy of our local Variability4: council area estimates will
authority population estimates achieve 95% CI +/- 3%
We will minimise the non-response to all Achieve or exceed target non-response
mandatory questions rates for all mandatory questions
Our data will demonstrate high agreement Agreement rates of at least XX%5
rates with post coverage quality surveys achieved for all questions
All national and local authority level results
Undertaken with no residual issues
for each main release will be assessed by
remaining
a quality assurance panel
We will publish details of methods and full
Published on our website
details of all our data quality indicators
We will publish the results of an
Positive review published.
independent methodology review
We will maintain our National Statistics
Accreditation maintained throughout
Accreditation
1. Lower-level KPIs may sit below individual Level 1 KPIs.
2. Precise measure for person response rate to be defined.
3. This target is under review.
4. This target is under review.
5. Precise measure for agreement rate to be defined.
2710.3 Appendix C – Maps of EA Groupings
2829
You can also read