MNPD's Response Times, Caseloads, and Clearance Rates: Informational Report
←
→
Page content transcription
If your browser does not render page correctly, please read the page content below
MNPD’s Response Times, Caseloads, and Clearance Rates: Informational Report
Background

The response times for the Metro Nashville Police (MNPD) for almost all call types are increasing at a
rapid rate, which has important public safety implications for the city. Long response times create a
twofold issue: first of public perception (i.e., the public not believing that police will respond promptly),
and second from a safety perspective, as certain call types demand quick response times in the interest
of public safety. This must be considered in a context in which clearance rates for crimes, particularly
violent crimes, are declining nationally. At its January 25, 2023, Board Meeting, the Chair of the
Community Oversight Board (COB) requested that the Research Team prepare a report that compares
historical police response times with the historical clearance rates and caseloads of the Department,
split by offense category and unit, respectively. This approach attempts to explore several factors that
might be inflating police response times. At present, this report does not make any recommendations,
and is instead intended to provide COB members with context on this complex phenomenon.

Response Times

It’s clear that response times are a national issue, but they are a particular problem in Nashville. Data
analyst Jeff Asher conducted an analysis 1 of law enforcement agencies that publish Calls for Service data
with enough information to calculate response times, and found 1) that Nashville had the second largest
increase in response times from 2019-2022, and 2) the third longest overall response time in 2022:

                                                              Data per Jeff Asher1

1Asher is a nationally recognized data analyst with expertise in evaluating criminal justice data. He co-founded AH Datalytics, a company that
specializes in assisting communities and law enforcement agencies across the country use analytics. See: https://bit.ly/3lh0bKG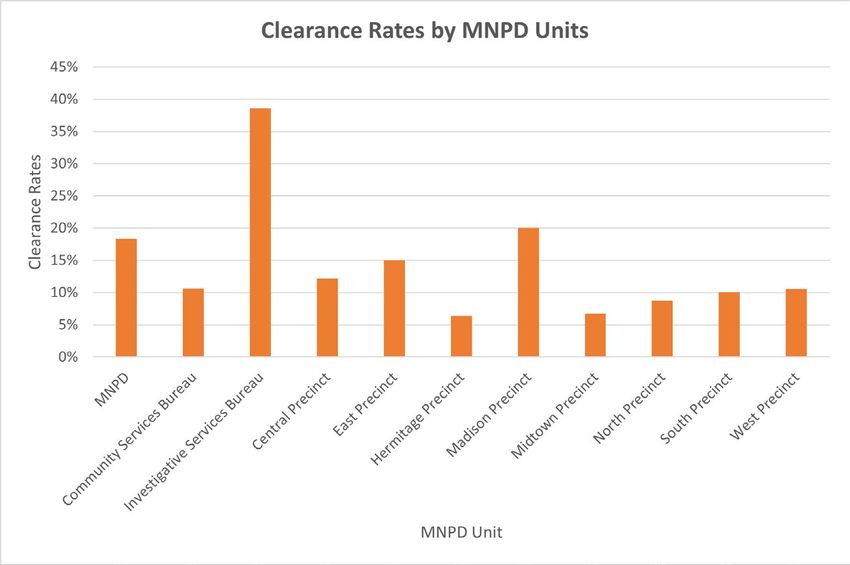
MNPD’s call response time for all call types has increased since 2018, though this effect is most dramatic
for routine and urgent calls as compared to emergency calls 2:

       •     Response time for emergency calls has increased from a low of 10.7 mins in 2020 to a high of
             15.0 in 2022.
       •     Response time for urgent calls has increased from a low of 35.5 mins in 2020 to a high of 64.2 in
             2022.
       •     Response time for routine calls has increased from a low of 66.3 mins in 2020 to 129.3 in 2022.

    Year       Average                   Average Response                 Average Response                Average Response
               Response Time             Time (Code 1 -                   Time (Code 2 -                  Time (Code 3 -
               (All Codes)               Routine)                         Urgent)                         Emergency)
    2018       44.9                      76.7                             37.3                            11.0
    2019       44.2                      73.2                             38.1                            11.1
    2020       40.3                      66.3                             35.5                            10.7
    2021       57.8                      98.6                             50.3                            12.5
    2022       73.3                      129.3                            64.2                            15.0

While officer travel time has increased slightly since 2020, the increase in overall call response time is
largely driven by a caller’s average time in queue. This increase could itself be driven both by slower
response times by EMS dispatch and/or by longer response times from MNPD officers available to
respond to a call:

2   All data on response times per MNPD’s data dashboard: https://www.nashville.gov/departments/police/data-dashboard/response-time

                                                                                                                                      2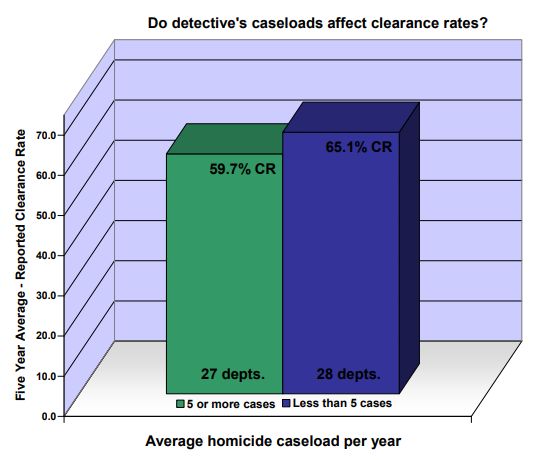
Year    Average Response Time       Average Time in Queue              Average Travel Time
         (All Codes)
 2018    44.9                        31.9                               13.0
 2019    44.2                        31.3                               12.9
 2020    40.3                        28.0                               12.3
 2021    57.8                        43.9                               13.9
 2022    73.3                        57.3                               16.1

Response times for all violent calls have seen increases over the last three years, though shootings have
seen the most dramatic increase in response times, predominantly from 2021-22:

                                                                                                        3
Year Holdup / Shooting Shots Person With Domestic Fight / Rape
Robbery Fired Weapon Disturbance Assault
2018 11.5 12.7 16.1 20.6 40.0 40.8 43.3
2019 12.9 10.3 17.3 21.2 42.1 41.3 44.2
2020 11.9 10.4 18.9 19.2 38.0 37.4 38.9
2021 18.1 12.1 24.2 28.7 52.3 58.2 57.6
2022 23.9 30.8 35.9 37.5 68.5 80.5 69.8
Response time for all traffic calls has increased, though response time for vehicles blocking the right of
way has increased the most dramatically, almost doubling from 2020 to 2022:
Year Vehicle Crash - Personal Injury Safety Hazard Vehicle Blocking Right of Way
2018 16.1 28.3 70.1
2019 15.1 28.1 68.4
2020 13.9 29.6 64.9
2021 16.6 35.3 98.1
2022 20.8 40.8 124.0
4Response time for all property calls has increased, though response time for thefts has increased the
most dramatically, nearly doubling from 2020 to 2022:
Year Fire Burglary – Burglary – Vehicle Crash – Theft
Non-Residence Residence Property Damage
2018 29.8 40.4 43.2 87.2
2019 15.0 29.9 43.6 43.9 83.7
2020 15.7 29.0 42.4 41.3 72.8
2021 18.6 43.0 61.4 57.8 112.6
2022 23.6 51.4 78.6 81.3 139.3
Calls for disorder or missing persons have all shown similar increases in response times:
5Year Person Person Suspicious Prowler Disorderly Criminal Missing
Screaming Indecently Person Person Vice Activity Person
Exposed
2018 32.7 35.5 37.4 42.6 44.8 51.7 64.9
2019 28.8 37.0 37.0 44.1 44.9 56.0 67.6
2020 37.7 35.5 35.5 39.3 40.9 48.9 56.5
2021 50.3 52.8 47.9 50.2 60.8 74.1 82.1
2022 55.2 64.7 57.6 69.0 75.1 93.3 108.5
While all non-criminal calls have seen an average increase in call response time, response times
requesting an officer for an investigation have increased the most steeply over the last several years.
Further, all calls for mental health and substance use have seen sharp increases in response times:
Year Corpse / Want Officer for Dangerous / Suicidal Intoxicated Mentally Ill Person
DOA Investigation Injured Animal Person Person
2018 12.3 52.6 54.1 24.4 26.0 26.8
2019 11.4 49.6 51.1 27.1 29.1 31.3
2020 11.6 44.9 49.4 21.9 27.9 27.2
2021 14.4 63.3 58.8 32.1 44.9 37.8
2022 16.7 82.5 60.3 37.3 46.8 43.0
6Clearance Rates 3
MNPD’s clearance rates are declining across all violent crime, reaching lows in 2021. This is not entirely
surprising, since crimes are often cleared the following calendar year and 2022 data has not yet been
released. MNPD’s clearance rates for all violent crimes are below, after which national rates are
integrated:
Year MNPD MNPD Rape MNPD Robbery MNPD Agg. MNPD All Violent
Homicide Clearance Clearance Rate Assault Clearance Crime Clearance
Clearance Rate Rate Rate Rate
2018 73.03 35.45 15.54 49.34 39.36
2019 61.18 57.97 15.53 45.45 38.46
2020 43.36 41.56 8.32 31.83 27.32
2021 39.39 24.5 13.83 38.32 32.8
MNPD’s clearance rates for homicides have roughly followed national clearance rates:
Year MNPD National
Homicide Homicide
Clearance Rate Clearance Rate
2018 73.03 62.3
2019 61.18 61.4
2020 43.36 49.8
2021 39.39 42.4
3 All clearance rate data from the FBI’s NCR, NIBRS datasets: https://www.fbi.gov/how-we-can-help-you/more-fbi-services-and-information/ucr
7MNPD has consistently had higher clearance rates for rape than the national average, though that gap
shrank in 2021:
Year MNPD Rape National Rape
Clearance Rate Clearance Rate
2018 35.45 33.4
2019 57.97 32.9
2020 41.56 23.5
2021 24.5 21.7
MNPD has consistently had lower clearance rates for aggravated assault than the national average,
though that gap shrank in 2021:
Year MNPD Agg. National Agg.
Assault Assault
Clearance Rate Clearance Rate
2018 49.34 52.5
2019 45.45 52.3
2020 31.83 44.4
2021 38.32 42.4
MNPD has consistently had lower clearance rates for robbery than the national average, though that
gap shrank in 2021 as national rates sharply declined and MNPD returned near their average:
Year MNPD Robbery National Robbery
Clearance Rate Clearance Rate
2018 15.54 30.4
2019 15.53 30.5
2020 8.32 30
2021 13.83 23.6
8Response Times and Clearance Rates
The level of aggregation of both response time and clearance rate data prevents meaningful statistical
comparison of one’s influence on the other. On aggregate and in general, however, MNPD’s response
times are increasing while clearance rates are decreasing. While there are myriad explanations for either
phenomenon, there is empirical evidence linking the two together. Research from Blanes i Vidal and
Tom Kirchmaier4 found that a 10% increase in police response time led to a nearly 5% decrease in the
likelihood of crime clearance. They suggest that this may occur due to quicker response times enabling
witness identification, evidence collection, and thus the greater chance of arrest.
This, however, flies in the face of a more traditional criminological theory that suggests that clearance is
not meaningfully impacted by response time unless police respond incredibly quickly (i.e., under one
minute from the crime occurring 5, which is an unreasonable expectation for even the most efficient
department). Other critics suggest that natural delays in notification, both in terms of an expedient 911
call and in terms of dispatch speed, are such that police response time is not a meaningful factor in
explaining clearance rates 6. To this point, data from MNPD shows that even if police were to be
informed seconds after a crime occurred, on average, an officer would spend 16 minutes traveling.
Perhaps the most obvious recourse suggested to longer response times is to hire more officers, a
suggestion that may make intuitive sense but is not wholly supported by empirical evidence. While
some research suggests that as the officer staffing rate of a police department increases, response time
generally decreases7, other research challenges whether this decrease matters. Research across 50 of
the largest US cities shows that there is no evidence that more officers have any impact on homicide
clearances 8, and that increasing police funding does not lead to material differences in clearance rates
for violent crimes such as homicide 9. More funding may thus not be the answer to solving more crimes,
especially because the willingness of witnesses to come forward (which itself is impacted by distrust in
the police, social disadvantage, and community engagement) is one of the biggest factors in clearing
crimes such as homicides9. This trust cannot be built simply with more officers.
These concerns must be altogether considered within the context of empirical critique of clearance
rates. Among other arguments, critics argue that clearance rates are a poor performance metric for
police efficacy in that they lead to an overemphasis on arrests without a corresponding emphasis on
solving crimes. Clearance rates must thus be further unpacked based on jurisdictional and incident
characteristics including police workload, firearm use, distant victim-offender relationship, race of victim
and offender, and more. Scholars have accordingly attempted to create a more comprehensive criminal
accountability metric that incorporates clearance rates, reported crimes, arrest rates, known crimes,
conviction rates, imprisonment rates, and resolution rates 10. All this to say, MNPD and any other police
department would do well to undertake a more comprehensive approach to crime resolution.
4 Blanes i Vidal, Jordi, and Tom Kirchmaier. "The effect of police response time on crime clearance rates." The Review of Economic Studies 85.2
(2018): 855-891.
5 Bayley, D. H. (1996), “Police for the Future", New York: Oxford University Press.
6 Sherman, L. W., and Eck, J. E. (2002), “Policing for Crime Prevention", in Evidence-Based Crime Prevention, London: Routledge.
7 Salimbene, Nicholas Andrew, and Yan Zhang. "An examination of organizational and community effects on police response time." Policing: An
International Journal (2020).
8 Chalfin, A., Hansen, B., Weisburst, E., & Williams, M. (2022). Police force size and civilian race. American Economic Review, 4(2), 139-158.
9 Bjerk, David. "Does greater police funding help catch more murderers?" Journal of Empirical Legal Studies 19.3 (2022): 528-559.
10 Baughman, Shima B. "How effective are police? The problem of clearance rates and criminal accountability." Ala. L. Rev. 72 (2020): 47-114.
9Caseloads
Another potential explanation for low clearance rates and long response times is investigative caseload.
Research has validated the commonsense notion that the odds of clearing a crime decrease as the
number of open cases for an investigator increases 11. A 2011 study using FBI data found that
departments where investigators handled five or more homicide cases per year had an average
clearance rate of 59.7%, compared to departments in which investigators handled less than five cases
per year, where investigators had a 65.1% clearance rate 12, providing further evidence to this point.
Interestingly, other research7 has demonstrated that the number of investigators is likely influenced by
police budgets to a greater degree than other positions within police departments. The implication of
this is that as police budgets are modified, departments are more likely to alter the number of
investigators as compared to other types of officers.
Graph per Keel12
To interrogate the question of investigative caseload and clearance in Nashville, the below section
attempts to quantify MNPD’s investigative caseload and clearance rates, based on information provided
to MNCO staff by Commander Carlos Lara. It is not necessarily a comprehensive outline of MNPD’s
investigative caseload and clearance rates, but rather an analysis of the Uniform Crime Reporting (UCR)
incidents/data and investigative staffing details provided by Commander Lara.
Within MNPD, there are two main bureaus that maintain investigative incident reports: the Community
Services Bureau (blue in Table 1 below), and Investigative Services Bureau (orange in Table 1). Table 1
outlines the number of investigative staff in the two bureaus by precinct and unit.
11 LoFaso, Charles A. "Solving homicides: The influence of neighborhood characteristics and investigator caseload." Criminal Justice Review 45.1
(2020): 84-103.
12 Keel, T. G. (2011). Detecting clues in homicide management: A homicide “best practices” research project. Federal Bureau of Investigations,
National Center for the Analysis of Violent Crime, Washington, DC.
10Table 1: MNPD Staff Structure
MNPD Investigative Staff Breakdown Active caseload was calculated using the
average (designated as “Average” in
Community Service Bureau
Table 2) of a range between two different
Central Precinct
combinations of variables from the “2021
Community Field Intelligence Team (CFIT) Unit 5
Part I UCR Incidents” dataset, designated
Investigations Unit 8 as “Range A” and “Range B” for the
East Precinct bottom and top of the range respectively
CFIT Unit 5 (see Table 2). “Range A” includes the
Investigations Unit 8 columns: ‘No Record in Case
Hermitage Precinct Management, Incident Not Cleared, Filed’
CFIT Unit 5 and ‘No Record in Case Management,
Investigations Unit 8 Incident Not Cleared, Other.’ “Range B”
Madison Precinct includes both prior columns, with the
CFIT Unit 5 addition of ‘Case Management Other.’
Investigations Unit 8 ‘Case Management Other’ includes cases
Midtown Hills Precinct that are considered active (open), but is
also more expansive, including cases that
CFIT Unit 5
are inactive, outside of MNPD’s control,
Investigations Unit 8
or closed. A range was thus necessary to
North Precinct
capture the relevant data from the ‘Case
CFIT Unit 5 Management Other’ column, while also
Investigations Unit 8 acknowledging that not all the data
South Precinct counts towards active caseloads. While a
CFIT Unit 5 range introduces some uncertainty, it is
Investigations Unit 8 the most accurate method we could
West Precinct accomplish given the data we had.
CFIT Unit 5
We then examined the average case load
Investigations Unit 8
(again see Table 2) using a range of
Investigative Services Bureau measures from the “Investigative Unit”
Criminal Investigations Division 52 dataset. The first section of Table 2
Interpersonal Crimes Branch 59 examines MNPD’s average case load per
Specialized Investigations Division 8 officer on a department-wide level. The
Specialized Investigations Division-Special 53 second section examines MNPD’s case
Traffic 13 load by bureau, specifically the
Violent Crimes Division 38 Community Services Bureau and the
Investigative Services Bureau. The third
section examines MNPD’s precincts, calculating the average caseload for the officers in the CFIT and
investigation units for each precinct. Data for this step comes from pairing the “Precinct CFIT” and
“Precinct Investigations” rows for each precinct.
11Table 2: Average Case Load (Across 2021)
Active Active Active Active
Cases Cases Investigative Caseload Caseload
(Range A) (Range B) Staff (Range A) (Range B) Average
MNPD 12023 13750 321 37.45 42.83 40.17
Community Services
Bureau 10418 11639 104 100.17 111.91 106.04
Investigative Services
Bureau 1605 2111 217 7.40 9.73 8.57
Central Precinct 1284 1306 13 98.77 100.46 99.62
East Precinct 1005 1788 13 77.31 114.46 95.89
Hermitage Precinct 1453 1796 14 103.79 128.29 116.04
Madison Precinct 740 854 13 56.92 65.69 61.31
Midtown Precinct 1868 1928 13 143.69 148.31 146.00
North Precinct 1074 1137 14 76.71 81.21 78.96
South Precinct 1187 1272 12 98.92 106.00 102.46
West Precinct 1807 1858 12 150.58 154.83 152.71
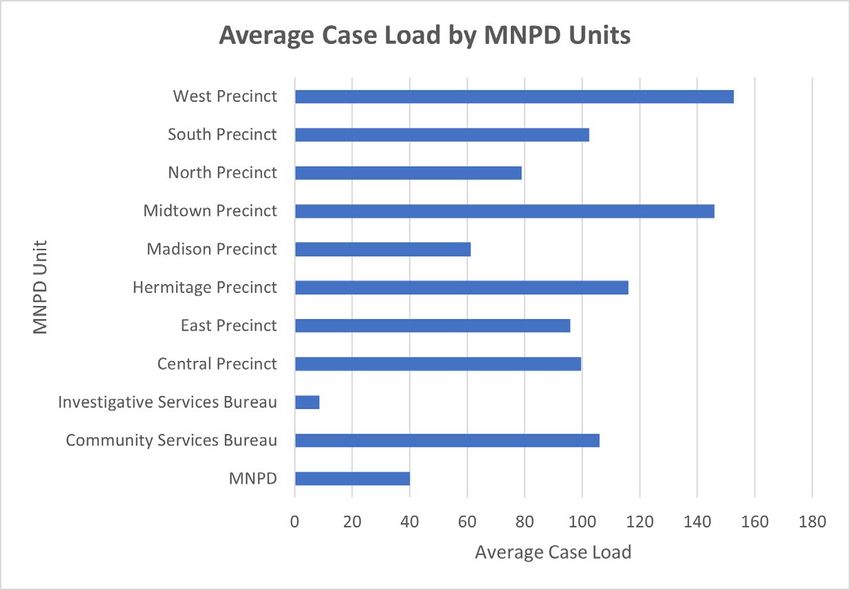
Based on the data above, MNPD’s average active case load per investigative officer was 40.17 active
cases per investigative officer in 2021. On the Bureau level, the average active was 106.04 active cases
per investigative officer in the Community Services Bureau and 8.57 active cases per investigative officer
in the Investigative Services Bureau. When broken down further by geographic precinct, the average
active case load per investigative officer was 99.62 in the Central Precinct, 95.89 in the East Precinct,
116.04 in the Hermitage Precinct, 61.31 in the Madison Precinct, 146.00 in the Midtown Precinct, 78.96
in the North Precinct, 102.46 in the South Precinct, and 152.71 in the West Precinct.
While the average active caseload at the departmental level should typically set the benchmark for the
average case load by unit, the initial breakdown of the averages on the Bureau level demonstrates a
12wide disparity between officers in precincts versus officers assigned to investigative services. The
disparate breakdown of averages extends further into the Community Services Bureau when broken
down by precinct. Notably, the Madison Precinct makes up the bottom of the range by having the
lowest average active caseload of 61.31 per officer, and the West Precinct has the highest average active
caseload of 152.71 per investigative officer.
Clearance rates were calculated using the FBI’s National Incident Based Reporting System (NIBRS)
method of calculating clearance rates and the “2021 Part I UCR Incidents” dataset. NIBRS defines
clearance rates as a percentage of total incidents, which is the national standard that MNPD follows for
calculating their clearance rates. To identify MNPD’s clearance rates, we summed the columns “No
Record in Case Management, Incident Cleared” and “Case management Cleared” and then divided their
sum by column “Total Reports.”
Table 3: Clearance Rates
Clearance
Cleared Cases Total Cases Rate
MNPD 6091 33186 18.35%
Community Services Bureau 2550 23960 10.64%
Investigative Services Bureau 3541 9181 38.57%
Central Precinct 297 2436 12.19%
East Precinct 374 2485 15.05%
Hermitage Precinct 242 3767 6.42%
Madison Precinct 491 2448 20.06%
Midtown Precinct 254 3755 6.76%
North Precinct 221 2535 8.72%
South Precinct 384 3811 10.08%
West Precinct 287 2723 10.54%
13MNPD’s average investigative clearance rate for the units and precincts given was 18.35% in 2021. At
the Bureau level, the average clearance rate is 10.64% in the Community Services Bureau versus a
38.57% clearance rate in the Investigative Services Bureau. When broken down further by geographic
precinct, the average clearance rates are 12.19% for the Central Precinct, 15.05% for the East Precinct,
6.42%, for the Hermitage Precinct, 20.06% for the Madison Precinct, 6.76% for the Midtown Precinct,
8.72% for the North Precinct, 10.08% for the South Precinct, and 10.54% for the West Precinct.
Similar to the average active caseloads per officer, MNPD’s clearance rates have a wide range of values.
Interestingly, clearance rates appear to be inversely proportional to active caseloads, as the units and
bureaus that have the lowest average case load per officer are also the ones with the higher clearance
rates. This phenomenon is most obvious in the breakdown of bureaus between the Community Services
Bureau and the Investigative Services Bureau and continues when examining the precincts as well. The
Madison Precinct, which had the lowest active case load per officer, also has the highest clearance rate.
Similarly, precincts that high higher than average caseloads, like the West Precinct, Midtown Precinct,
and Hermitage Precincts, all have lower than average clearance rates. Thus, the active case load officers
have likely impacts how successfully they can clear cases, reinforcing the findings of LoFaso11 and Keel12.
To investigate the potential relationship between clearance rates and average caseloads by MNPD
department, we used a scatter plot graph comparing average case load and clearance rate. A logarithmic
trendline with an R-squared value of 0.8992 was used to best capture the stark differences in average
caseloads. While the data set is not big enough to determine statistical significance, the trend line helps
visualize what the relationship between average caseloads and clearance rates look like. Based on the
downward curve of the trendline and the R-squared value of 0.8992, the average case load size of an
MNPD unit does appear to affect what the clearance rate for that unit will look like. Units that have
smaller average caseloads are likely to have higher clearance rates, and conversely units with larger
average caseloads are likely to have lower clearance rates.
14Based on the literature surrounding clearance rates, factors such as the type of crime, the person
reporting it, and the place it was reported in can all impact clearance rates. However, with the data we
currently have access to, we do not have the capability to explore how those variables may affect
clearance rates. Thus, further research will need to be conducted to determine if those factors have any
weight in affecting MNPD clearance rates.
Patrol Officers
Another related explanation for slow response times is a lack of patrol officers. In non-peer reviewed
research 13, the International City County Managers Association has suggested a ‘Rule of 60’ regarding
patrol officers. Simply put, the rule suggests that 1) 60% of the sworn officers in a department should be
dedicated to patrol staffing, and 2) no more than 60% of their time should be committed to calls for
service. If we assume that Field Training Officers (FTOs) count as patrol officers, MNPD has 511 patrol
officers at the time of writing. Their total sworn headcount is 1424 (not including 57 trainees), meaning
that they only have 36% of staff dedicated to patrol 14. While the Rule of 60 isn’t to be treated as an
absolute, such a big gap should raise a flag for the department.
The natural follow-up question is how MNPD compares to peer cities on this metric. This is a difficult
question to answer on an agency-by-agency basis since most departments don’t release this data
publicly. However, the DOJ recently released a report 15 that outlines the primary job responsibility of
full-time personnel in local police departments. For agencies that serve 100,000 or more residents, on
average 62.5% of sworn officers are dedicated to patrol. This reveals a huge disparity for MNPD and
provides evidence that the Rule of 60 has a basis of truth in modern policing.
While there have been numerous attempts to establish universally applicable staffing standards (for
example, one of the most popular suggestions was that departments should have two officers per
thousand residents), organizations like the International Association of Chiefs of Police (IACP) have
cautioned against 16 using such blanket metrics, calling them “totally inappropriate as a basis for staffing
decisions”. Instead of aiming to fit into predefined metrics such as these, MNCO believes it would be
valuable for MNPD to collaborate with an external organization such as the City Auditor or an external
consulting firm to conduct a workload/staffing analysis to better understand its patrol structure and
mechanisms to improve officer distribution. Such an endeavor should consider the civilianization of
some officer duties, which would free officers up to focus on patrol, investigations, and solving violent
crime.
An effective example of this approach has been accomplished elsewhere; in 2017, the Matrix Consulting
Group conducted a Workload/Staffing analysis 17 of the Kansas City Police Department. In that report,
they evaluated staffing allocation and deployment in each bureau of the department, its organizational
structure, and the management systems used to control operations as well as ensure that departmental
and community goals are met. Through the data, they were able to identify ‘patrol proactivity’ as an
important metric, which they defined as the percentage of patrol officers’ time in which they are on
duty, available, and not responding to calls for service. From this, they made specific recommendations,
13 https://icma.org/sites/default/files/305747_Analysis%20of%20Police%20Department%20Staffing%20_%20McCabe.pdf
14 Note that MNPD has an additional 12% of their staff dedicated to supervision of patrol (i.e., patrol sergeants and lieutenants).
15 https://bjs.ojp.gov/library/publications/local-police-departments-personnel-2020
16 https://www.theiacp.org/technical-assistance
17 https://www.kcmo.gov/Home/ShowDocument?id=2970
15including reallocating officers to patrol and reducing the functional areas in which sworn personnel were
performing functions a civilian could conduct, or managing civilians within those areas.
Conclusion
Per the Mayor’s FY23 Recommended Budget 18, MNPD was ‘On Track’ with its goal of a response time
below six minutes for Code 3 Emergency calls. It is unclear how the Mayor and/or MNPD came to this
conclusion given that their publicly available data outlines that the average response time to a Code 3
call was 10.7 minutes in 2020, 12.5 minutes in 2021, and 15.0 minutes in 2022. Further, per an
appendix 19 to that same FY23 budget, in FY21, the Mayor reports that average receive to arrive time for
an urgent call with emergency equipment was 10.9 minutes; the average receive to arrive time for an
urgent call without emergency equipment was 43.2 minutes; and the average routine call took 77.9
minutes from call receipt to arrival. It is clear from these numbers that there is some disconnect
regarding the performance metrics and benchmarks set for call response times.
Further exploring this discrepancy may provide satisfactory explanations for the phenomenon, but it’s
unlikely that MNPD’s response times are due to any one issue. The increase in response times is coupled
with a decrease in clearance rates and disparate caseloads across precincts, and while we cannot
definitively state that any of these phenomena are causal in the increasing response times, literature
demonstrates that there may be a connection between them all. It therefore behooves both MNPD and
other outside agencies to further consider and research how these various concerns interact and
influence one another.
With all this considered, MNCO urges further consideration of a) EMS call structure, b) performance
goals and the department’s achievement of such goals, c) MNPD officer’s system for call prioritization,
d) patrol officer staffing, e) a workload/staffing analysis, f) clearance rates across unit and precinct, and
g) community perception of whether their needs are being met by MNPD and the Department of
Emergency Communications (DEC).
18 Available at: https://bit.ly/3MPlDOX
19 Available at: https://bit.ly/3OdZ6wu
16You can also read


