Estancia la jolla hotel & spa
←
→
Page content transcription
If your browser does not render page correctly, please read the page content below

estancia la jolla hotel & spa

INVESTOR PRESENTATION FEBRUARY 2023

Forward-Looking Statements
This presentation contains forward-looking statements that are subject to risks and uncertainties. These
forward-looking statements include information about possible or assumed future results of Pebblebrook
Hotel Trust's (the “Company”) business, financial condition, liquidity, results of operations, plans and
objectives. These forward-looking statements are based on the Company's beliefs, assumptions,
estimates and expectations of future performance, taking into account information currently available
to the Company. These beliefs, assumptions, estimates and expectations can change as a result of
many possible events or factors, not all of which are known to the Company. If a change occurs, the
Company's business, prospects, financial condition, liquidity and results of operations may vary
materially from these forward-looking statements. These risks and uncertainties include, but are not
limited to, the state of the U.S. economy, supply and demand in the hotel industry and other factors as
are described in greater detail in the Company's filings with the Securities and Exchange Commission,
including, without limitation, the Company's Annual Report on Form 10-K for the year ended December
31, 2022. You should carefully consider these risks when you make an investment decision concerning
the Company's securities. You are cautioned not to place undue reliance on any forward-looking
statements. The Company assumes no obligation to update or revise any forward-looking statements,                  w boston
whether as a result of new information, future events or otherwise.
This presentation does not constitute, and may not be used in connection with, an offer or solicitation by
anyone.
The Company assumes no obligation to update or revise any of the information in this document.
The following presentation includes financial projections and forward-looking statements. These
projections and forward-looking statements are based on assumptions and estimates developed by the
Company and actual results may vary from the projections and such variations may be material. This
presentation includes estimates and the Company makes no representation as to the accuracy of
these estimates.    Additionally, this presentation should not be relied upon or regarded as a
representation by the Company, management or its employees that the forward-looking statements, or
beliefs, assumptions, estimates or expectations of future performance underlying them, will be
achieved.

Investor Inquiries:
Raymond D. Martz
Chief Financial Officer
(240) 507-1330
rmartz@pebblebrookhotels.com                                                                                 skamania lodge

                                                                                                                         2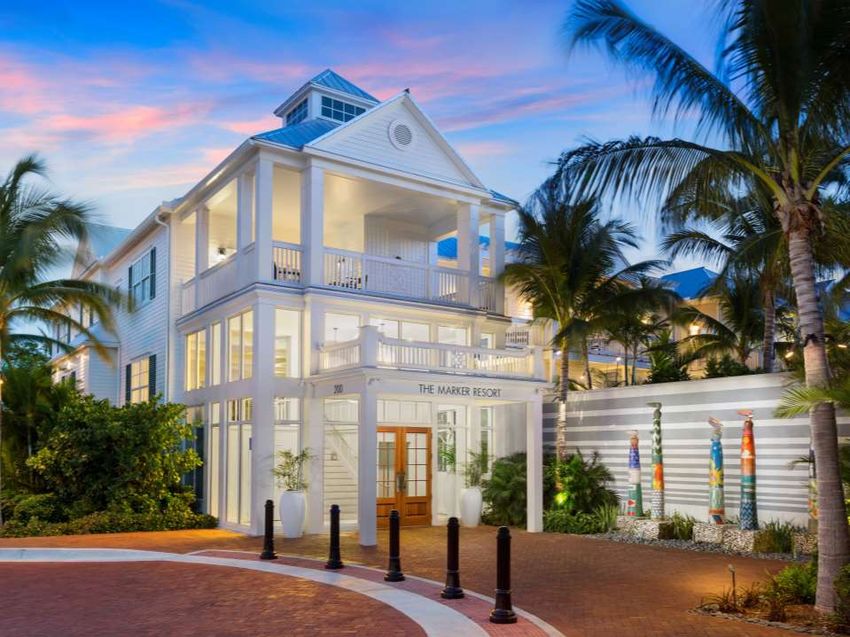
INVESTOR PRESENTATION FEBRUARY 2023

The Premier Lifestyle Lodging REIT
Pebblebrook Hotel Trust (NYSE: PEB) is a publicly traded real estate investment trust (“REIT”) and the largest
owner of urban and resort lifestyle hotels in the United States.

          Pebblebrook Overview

                                                                                                                        inn on fifth     newport harbor island resort

         51                                   15                             $40.25
                                                                               12

      Hotels and                       Urban and                                  Hotel
       Resorts                        Resort Markets                         Operating Partners

                                                                                                   the liberty, a luxury collection,   hotel colonnade coral gables,
                                                                                                                             boston             autograph collection

     $30.75                        $200M+                                   $40.25
                                                                            50%/50%

    NAV per Share                      2018-2023                                Business/Leisure
  Midpoint Estimate(1)               ROI Investments                             Customer Mix

                                                                                                      hotel zoe fisherman’s wharf           hotel zetta san francisco

                                                                                                                                                                        3
                 (1) Reflects management's current estimate for Net Asset Value per Share.
INVESTOR PRESENTATION FEBRUARY 2023

Powerful Mix of Unique Lifestyle Hotels and Resorts

                                                   February 2023 NAV Diversification % by Hotel Type

                44%                                                                 40%                                                  16%

            Urban Lifestyle                                        Unique Lifestyle Resorts                                      Urban Major Brand
         (32 hotels / 6,770 rooms)                                     (13 resorts / 3,089 rooms)                                 (6 hotels / 2,902 rooms)

         Bespoke and experiential                                        Unique lifestyle resort                                  More traditional branded
         destinations appealing to                                   experiences in many of the                                     hotel experiences in
       business and leisure travelers;                              top drive-to resort settings in                               desirable urban locations
      local, authentic, personalized                                the U.S. including Key West,                                including Boston, San Diego
         and well located in major                                  Naples (Florida), Jekyll Island                              and Chicago; focused on
       urban markets; comprised of                                       (Georgia), Hollywood                                     key U.S. gateway markets
        independent, soft-branded                                    (Florida), Newport (Rhode                                  with major brands including
           and iconic properties                                      Island), San Diego, Santa                                       Westin and Hyatt
        including the 8 hotels in the                                     Cruz and the Pacific
           Unofficial Z Collection                                             Northwest

                                                                                                                                                              4
                Note: Based on February 2023 NAV estimates; includes all hotels owned by the Company as of February 21, 2023.
INVESTOR PRESENTATION FEBRUARY 2023

Geographic and Customer Diversification
Resorts account for ~40% and urban hotels account for ~60% of the Company’s estimated NAV.

                                                                                                                                                          Guest Segmentation

                                                                                                                                                            30%
                                                                                                                                                                               45%

                                                                                                                                                              20%
                                                                                                                                                                          5%

                                                                                                                                                                  Leisure Transient
                                                                                                                                                               Business Transient
             = Urban Location
                                                                                                                                                               Leisure Group
                      = Resort Location                                                                                                                        Business Group

                                                                                    Top Markets (by % of NAV)
                41%

                                        16%
                                                               12%                    10%                     9%
                                                                                                                                      4%          4%               3%            1%

          Resorts/S. Florida          Boston               Los Angeles            San Francisco            San Diego           Washington, DC   Chicago        Portland        Seattle
 # of
 Hotels
                 14                      5                       9                      8                      4                      4           2                3             2

                                                                                                                                                                                         5
                               Note: Based on February 2023 NAV estimates; includes all hotels owned by the Company as of February 21, 2023.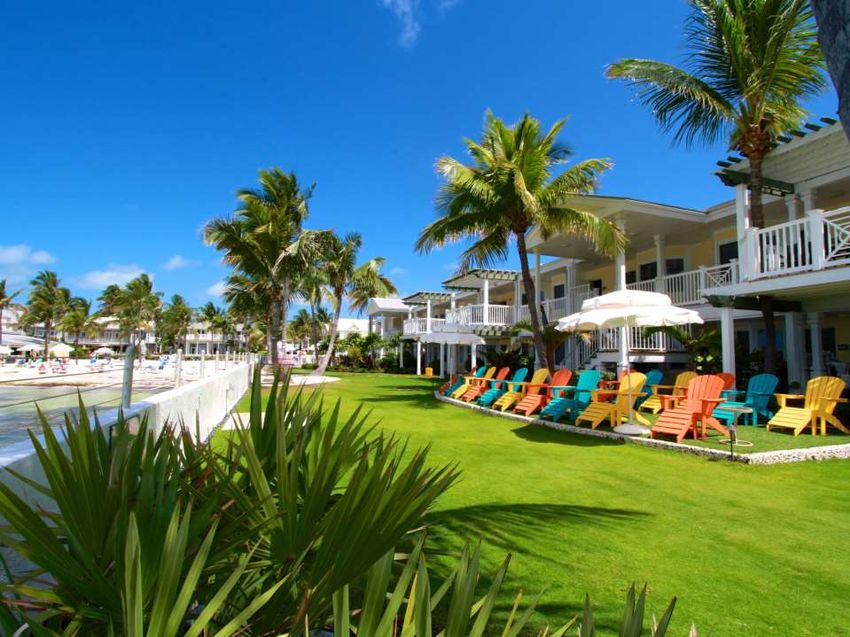
INVESTOR PRESENTATION FEBRUARY 2023

Reasons to Invest in Pebblebrook

                                      Proven leadership team

             Significant leisure focus with 13 resorts, targeting a more balanced
                      50/50 business/leisure customer mix through recent
                                       sales/acquisitions

              Substantial portfolio-wide EBITDA upside from capital investments
                              and operating efficiency initiatives

                     Unique (and overlooked) characteristics embedded in
                                independent lifestyle portfolio

                            Stock trading at a significant discount to NAV

                                                                                    6
Proven
Leadership
Team

                                             7

             margaritaville hollywood beach resort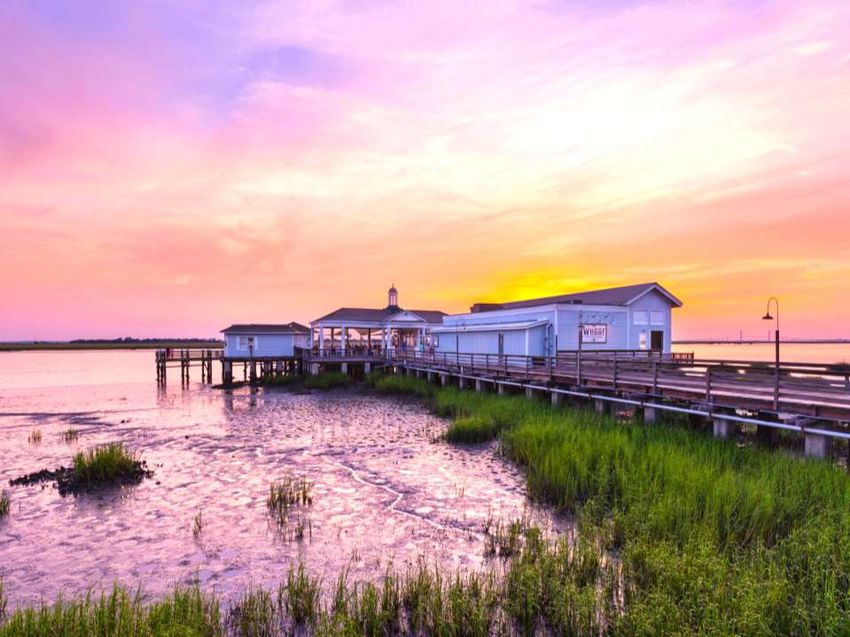
INVESTOR PRESENTATION FEBRUARY 2023

Proven Leadership Team
The Company has a leading hotel management team with deep industry experience and an excellent long-
term track record.

                     •   Founder of Pebblebrook Hotel Trust

   Jon E. Bortz      •   Founder, Former Chairman of the Board and Chief Executive Officer of LaSalle Hotel Properties (NYSE: LHO) from its IPO in 1998
                         through August 2009; Chairman of the Board of LHO from 2001 to 2009
     Chairman,       •   Founder and Former President of Jones Lang LaSalle's Hotel Investment Group
   President and
                     •   Chairman of American Hotel & Lodging Association (AHLA) in 2019; Chairman Emeritus in 2020; Officer and Executive Committee
  Chief Executive        member of AHLA; member of the NAREIT Board of Advisors; former board member of AHLA Foundation; former longtime board
      Officer            member of Federal Realty Investment Trust (NYSE: FRT)
                     •   Led transactions totaling over $14.8 billion in asset value, including overseeing 130 hotel acquisitions

  Raymond D.
                         Founder of Pebblebrook Hotel Trust
     Martz           •
                     •   Former Chief Financial Officer of Phillips Edison (NAQ: PECO) and Eagle Hospitality Properties (NYSE: EHP)
   Executive Vice
                     •   Former Treasurer at LaSalle Hotel Properties (NYSE: LHO)
    President and
   Chief Financial   •   Led over $15.9 billion of capital market transactions
       Officer

   Thomas C.
                         Former Managing Director of Americas for Jones Lang LaSalle Hotels
     Fisher          •
                     •   Executed over $17.4 billion in hotel transactions
   Executive Vice
                     •   Led hotel acquisitions totaling over $9.1 billion
    President and
  Chief Investment   •   Led hotel dispositions totaling over $2.9 billion
       Officer

                                                                                                                                                          8
Significant leisure focus with 13 resorts,
targeting a more balanced 50/50
business/leisure customer mix through
recent sales/acquisitions

                                                         9

                                     southernmost beach resort
INVESTOR PRESENTATION FEBRUARY 2023

Repositioned Resorts to Generate Significant Growth
Most of the Company's unique lifestyle resorts have recently been redeveloped and repositioned, generating
significant revenue and EBITDA growth by increasing overall quality, improving guest experiences with
expanded amenities, reconcepting food and beverage outlets, adding event venues and remerchandising
underutilized indoor and outdoor areas. All 13 of the Company's resorts have been or will soon be repositioned
up market, thus creating significant additional EBITDA growth in the next 3-4 years.

  $110M+ of Recent Capital Investments in Resorts                               Full-Year(1)                              2022            2019                Var

              Chaminade Resort & Spa                                            Occupancy                                63.6%           73.7%               (10%)

            LaPlaya Beach Resort & Club                                         ADR                                       $432             $278               56%

                 L'Auberge Del Mar                                              RevPAR                                    $275             $205               34%

             Paradise Point Resort & Spa                                        Total Revenue POR(2)                      $782             $546               43%

            San Diego Mission Bay Resort                                        Hotel EBITDA                            $185.6          $127.3                46%

             Southernmost Beach Resort                                          Hotel EBITDA Margin                      33.6%           28.7%         491 bps

          The Marker Key West Harbor Resort                                     Average Rate Index(3)                    112.3              95.9              16.5

$150M+ of Upcoming Capital Investments in Resorts                               Resort Upside

            Estancia La Jolla Hotel & Spa

               Jekyll Island Club Resort                                        For 2022, the Company’s resorts generated over
                                                                                $62M(4) in Hotel EBITDA above 2019 due to their
             Paradise Point Resort & Spa
                                                                                repositionings and enhanced guest amenities and
                  Skamania Lodge                                                experiences.

            Newport Harbor Island Resort                                                                                                                             jekyll island club resort

             Southernmost Beach Resort

                  Note: Dollars in millions, except for ADR, RevPAR and Total Revenue POR.
                  (1) LaPlaya Beach Resort & Club is excluded from Q4 for both 2022 and 2019 given the property’s closure due to Hurricane Ian.
                  (2) Reflects Total Revenue per occupied room.
                  (3) Based on STR performance.                                                                                                                                             10
                  (4) 2022 Resort achievement over 2019 reflects LaPlaya Beach Club & Resort’s actual achievement for Q1-Q3 and pre-hurricane Q4 forecast.
Substantial Portfolio-Wide EBITDA Upside
from Capital Investments and Operating
Efficiency Initiatives
11
le parc suite hotelINVESTOR PRESENTATION FEBRUARY 2023
Recent and Upcoming ROI Projects
The Company has a successful track record of investing capital into its properties to reposition them higher,
enhance the guest experience and remerchandise underutilized venues and open spaces. The Company's
renovations typically average 10%+ cash-on-cash returns on stabilization (3-4 years after completion).
Recent # of Properties Capital Invested Upcoming # of Properties Capital to be Invested
2018-2019 11 $112.8 2023 7 $99.0
2020 9 $69.5 2024 2 $65.0
2021 2 $19.2
2022 2 $25.6
Total 24 $227.1 Total 9 $164.0
mondrian los angeles solamar hotel
12
Note: Dollars in millions.INVESTOR PRESENTATION FEBRUARY 2023
Operating Efficiency Enhancements Implemented and
Starting to be Realized
• Since the pandemic, the Company has worked closely with its 12 hotel operating partners and technology
providers to develop more efficient property-level operating models; these initiatives include combining back-
of-house operations and executive leadership teams at hotels managed by the same operating partner,
utilizing enhanced technology, reducing the number of managers and carefully scrutinizing all costs
• In November 2020, the Company launched Curator Hotel & Resort Collection with several industry-leading
independent hotel management companies; Curator reduces operating costs for independent lifestyle hotels
through buying power, market knowledge, industry relationships and new technologies
Through these efforts, the Company believes that it has eliminated 100-200 bps of expenses from its portfolio,
generating $12M-$28M of annual savings, which should be achieved when the Company is closer to pre-
pandemic occupancy levels.
12 Leading Hotel Operating Partners
Noble House Hotels & Resorts Kimpton Hotels & Restaurants
Davidson Hotels & Resorts Sage Hospitality Group
Marriott International Benchmark Pyramid
HEI Hotels & Resorts sbe/Ennismore
Viceroy Hotels & Resorts SH Hotels & Resorts
Highgate Springboard Hospitality
revere hotel boston common
Note: $12M-$28M of annual savings includes a $3M reduction for resort-related margin optimization upside; 100-200 bps savings on the Company's entire portfolio would result in $15M-$30M of 13
annual savings.INVESTOR PRESENTATION FEBRUARY 2023
Curator Hotel & Resort Collection
Curator is a distinct collection of hand-selected small brands and independent lifestyle hotels and resorts
worldwide founded by Pebblebrook and several industry-leading independent hotel operators. As of
December 31, 2022, Curator had 97 member hotels and 100 programs with preferred vendor partners, providing
Curator hotels with preferred pricing, enhanced operating terms and early access to new technologies.
What is Curator?
• A first-of-its-kind owner-centric hotel platform that serves independent lifestyle owners and operators and
allows independent lifestyle hotels and resorts to associate with other similar experiential properties
• Curator reduces the operating costs for lifestyle hotels through buying power, market knowledge, industry
relationships and early access to new property technologies
• Curator was created by an independent hotel owner, for independent hotel owners and operators
• Curator provides best-in-class operating agreements, services, and technologies
hotel zena washington dc
14Unique (and Overlooked)
Characteristics Embedded in
Independent Lifestyle Portfolio
15
the nines, a luxury collection hotel, portlandcurator hotel & resort collection member – asbury ocean club hotel
skamania lodge glamping units – rendering
16
unofficial z collection member – hotel zetta san francisco the club at laplaya beach resortINVESTOR PRESENTATION FEBRUARY 2023
Significant Value Embedded Within Hotels and Resorts
The Company's unique collection of largely independent properties has many embedded and frequently
overlooked and underappreciated valuation benefits and future potential value creation opportunities.
Overlooked and Underappreciated Valuation Benefits
30+ hotels can be sold unencumbered by brand (unencumbered properties
historically transact for 10%-20% higher multiples); 40+ hotels can be sold
Unencumbered hotels deliver premium valuations
unencumbered by management (unencumbered properties historically
transact for 5%-10% higher multiples)
~280,000 square feet of prime retail space, currently generating approximately
Significant prime retail space $12.7M in annualized rental income but still with significant vacancies to be
leased
~18.3M of EBITDA generated by parking in 2019 (equating to ~$1,440 of EBITDA
Meaningful parking revenue adds to non-room revenue
per key)
~$2.5M to $3.5M per year of net club membership non-refundable initiation
Sizeable club membership revenue contributes to profitability
revenues (amortized over 12 years due to GAAP but paid in cash upfront)
~$1.6M of EBITDA per year generated by billboards at Hotel Ziggy, Mondrian Los
Considerable billboard/media income across our portfolio
Angeles and W Boston
300+ acres of underutilized/developable land at Skamania Lodge, Chaminade
Future opportunities with underutilized land
Resort & Spa, L'Auberge Del Mar, Inn on Fifth and Newport Harbor Island Resort
Potential future monetization of the Unofficial Z Collection, which consists of 8
Unofficial Z Collection monetization
urban lifestyle hotels with 1,569 guestrooms
Potential future monetization of Curator Hotel & Resort Collection, which
Curator Hotel & Resort Collection monetization
currently consists of 100 member hotels and is growing
Future Potential Value Creation Opportunities
Potential addition of guest amenity fees at 10 urban hotels, which can generate
~$8M of additional EBITDA per year over 2019; some of which have recently
Additional guest amenity fees
been approved and are in the process of being implemented, others are
currently awaiting approval
New redevelopments Investing capital in hotel redevelopments
17EBITDA Upside Potential
18
l’auberge del marINVESTOR PRESENTATION FEBRUARY 2023
Significant EBITDA Upside to be Achieved
Within the next two to three years, the Company expects to achieve significant EBITDA upside from prior, current
and upcoming ROI capital investments, optimized hotel operations and redeveloped and repositioned resorts.
EBITDA Upside of
~$108M ($0.85/Share)
$19M
$0.15/Share $573M
$27M
$0.21/Share
$62M
$0.49/Share
$465M
(1) (2) (3)
2019A 2022 Resort EBITDA 10% ROI 100-200 bps Portfolio 2019 EBITDA
Actuals Over 2019 on ROI Projects Optimization With Upside
Note: Dollars in millions.
(1) Based on 2019 operating results; includes all hotels owned by the Company as of February 21, 2023.
(2) 2022 Resort achievement over 2019 reflects LaPlaya Beach Club & Resort’s actual achievement for Q1-Q3 and pre-hurricane Q4 forecast.
(3) $19M of annual savings includes a $3M reduction for resort-related margin optimization upside; 100-200 bps savings on the Company's entire portfolio would result in approximately $22M of 19
annual savings.Stock Trading at a
Significant Discount to NAV
20
hotel monaco washington dcINVESTOR PRESENTATION FEBRUARY 2023
Currently Trading at a Significant Discount to NAV
The Company continues to evaluate its NAV as transaction and capital markets change. The Company's NAV
and cap rates are a result of its estimated value of each individual property. Today, the Company's public
market valuation represents an approximate 45% to 54% discount to the Company’s recently updated private
market valuation based on individual valuations for each of its properties.
Hotel NOI 2019 Cap Rate Hotel NOI 2022 Cap Rate Estimated Value
2019 High Low 2022 High Low Mid/Key High Mid Low
(1)
Resorts / S. Florida $110.7 4.2% 3.7% $167.1 6.4% 5.6% $860 $3,001 $2,792 $2,613
Boston 73.4 7.0% 6.5% 70.5 6.7% 6.2% 556 1,133 1,092 1,052
Los Angeles 48.3 5.9% 5.4% 34.7 4.2% 3.9% 476 894 850 816
San Francisco 64.1 9.6% 9.2% 6.4 1.0% 0.9% 406 700 681 670
San Diego 37.4 6.1% 5.6% 30.4 5.0% 4.6% 488 668 640 614
Washington DC 19.4 6.3% 5.8% 8.1 2.6% 2.4% 461 332 319 306
Portland 18.0 8.9% 8.4% 7.8 3.8% 3.6% 320 215 210 202
Chicago 14.9 7.7% 7.2% 9.2 4.8% 4.5% 181 207 200 193
Seattle 7.3 7.7% 7.2% 2.3 2.4% 2.3% 312 102 98 95
Club/Retail Space(2) 13.3 9.2% 8.8% 11.5 7.9% 7.5% N/A 152 147 145
Total Portfolio $406.8 6.1% 5.5% $348.0 5.2% 4.7% $551 $7,404 $7,029 $6,706
Private Valuation Public Valuation Comparison to Public
Low High Mid Mid Low High Mid
Enterprise Value $6,706 $7,404 $7,029 Enterprise Value $5,106
Net Debt(3) (1,610) (1,610) (1,610) Net Debt(3) (1,610)
Convertible Notes(4) (750) (750) (750) Convertible Notes(4) (750)
Preferred Equity (793) (793) (793) Preferred Equity (793)
NAV $3,553 $4,251 $3,876 Equity Market Cap $1,953
Shares Outstanding 126.0 126.0 126.0 Shares Outstanding 126.0 (45%) (54%) (50%)
NAV Per Share $28.00 $33.50 $30.75 Share Price $15.50 ($12.50) ($18.00) ($15.25)
Note: Dollars in millions, except estimated value per key, which is in thousands; differences due to rounding; includes all hotels owned by the Company as of February 21, 2023.
(1) 2022 Resort achievement over 2019 reflects LaPlaya Beach Club & Resort’s actual achievement for Q1-Q3 and pre-hurricane Q4 forecast.
(2) Includes the private LaPlaya Beach & Golf Club and ~206,000 square feet of retail space at Hotel Chicago Downtown, Hotel Zephyr Fisherman's Wharf and The Westin Michigan Avenue.
(3) Net Debt is net of cash, cash equivalents and liquid securities assumed as of December 31, 2022. 21
(4) Assumes convertible notes are settled with cash.Balance Sheet
and Liquidity
22
viceroy washington dcINVESTOR PRESENTATION FEBRUARY 2023
Balance Sheet and Liquidity
• As of December 31, 2022, the Company had estimated total liquidity of $689.7 million, which included cash on
hand of $52.3 million with $637.4 million available on the Company's credit facility.
• The Company completed a $2.0 billion refinancing in October 2022, increasing the capacity of its unsecured
credit facility to $650 million and expanding the maturities of all its term loans and credit facilities while
maintaining its pre-pandemic pricing grid.
• With the completion of the Company's most recent amendments, the Company has no significant loan
maturities until October 2024; 91% of the Company’s outstanding debt is unsecured.
• The Company's balance sheet with staggered maturities, high percentage of fixed rates, and low weighted
average cost of debt reduces risk, provides flexibility to pursue investments, acquisitions, redevelopments and
renovations, and allows access to a lower cost of capital.
(1)
Debt and Convertible Notes Maturity Schedule Weighted % of
Debt Amount
Interest Rate Total Debt
Fixed $1,149.5 3.4% 48%
Convertible Notes 750.0 1.8% 31%
Floating 501.5 6.4% 21%
(3)
Total / Wtd. Avg $2,401.0 3.5% 100%
$750
(2) % of
$622 Debt Type Amount
Total Debt
Unsecured Bank Debt $1,380.0 58%
$462 $460 Convertible Notes 750.0 31%
Secured Property Debt 221.0 9%
Unsecured Notes 50.0 2%
Redeemable
Preferred Equity Amount Yield
$59 Starting
$48
Series E $110.0 6.375% Redeemable
Series F 150.0 6.300% Redeemable
2023 2024 2025 2026 2027 2028
Series G 230.0 6.375% May 2026
Series H 225.0 5.700% Jul 2026
Bank Term Loans Mortgage Debt (2)
(3) Series Z 77.6 6.000% May 2027
Unsecured Notes Convertible Notes Total / Wtd. Avg $792.6 6.132%
(1) Debt balances shown in millions; current as of December 31, 2022.
(2) Maturity date of May 2024 assumes Pebblebrook chooses to exercise its two one-year options to extend debt maturity of the mortgage loan on Margaritaville Hollywood Beach Resort.
(3) The Convertible Notes have an initial conversion rate in December 2026 of 39.2549 per $1,000 principal amount of the Notes (equivalent to a conversion price of approximately $25.47 per 23
common share of the Company and a conversion premium of approximately 35.0% based on the closing price of $18.87 per common share on the date of issuance).INVESTOR PRESENTATION FEBRUARY 2023
Balance Sheet and Liquidity, Continued
A snapshot of the Company's credit statistics demonstrates a strong balance sheet and a reasonable leverage
level given its size and profile. Floating Fixed % Fixed of Total
Debt Debt at Year-End
Debt to Asset Value Comparison 2023 $599 $1,802 75%
$7.0B 2024 899 1,502 63%
$551K/Key 2025 1,102 1,299 54%
$5.5B 2026 2,342 59 2%
$431K/ Key $5.1B
$400K/Key 2027 2,342 59 2%
$3.2B 2028 2,401 - -
$250K/Key
Convertible Notes $0.8B
Preferred Equity $0.8B
Debt $1.7B
(2)
Estimated Gross Net Book Value Public Enterprise Debt, Pfd Equity
(1) (3)
Asset Value Value and Converts
2019 Q4 2022
Debt/EBITDA Ratio 4.7x 5.7x
Debt/EBITDA Ratio
(Assuming Convertible Notes N/A 3.9x
Settled With Equity)
Fixed Charge Ratio 2.9x 2.3x
Debt/Net Book Value 37% 43%
Debt to Gross Asset Value % 29% 34%
Secured Property Debt % of Total Debt 0% 9%
Liquidity $535M $690M(4) chamberlain west hollywood hotel
(1) Based on $30.75 per share and assumptions detailed on slide 21.
(2) Represents GAAP defined investment in hotel properties, net of accumulated depreciation and amortized right-of-use assets.
(3) Based on $15.50 per share and assumptions detailed on slide 21. 24
(4) Reflects liquidity as of December 31, 2022.Environmental, Social
and Governance
(ESG) Highlights
25
paradise point resort & spaINVESTOR PRESENTATION FEBRUARY 2023
Reductions in Water, Energy and Waste Intensity
As we concluded our fourth year of formalized corporate ESG programming, we committed to long-term
environmental targets for Pebblebrook, including a 35% reduction target for GHG emissions intensity by 2030. We
remain committed to environmental protection, awareness, and the reduction of greenhouse gas emissions. We
issued our annual ESG report in early November 2022.
Water Highlights(1) Energy Highlights(1) Waste Highlights(1)
89% of properties have low flow or water- 98% of properties have digital 91% of properties have implemented at
conserving showerheads thermostats least one measure to improve waste
management over the past four years
85% of properties have undertaken at
85% of properties have low flow toilets least one energy conservation measure
in the past four years 87% of properties have recycling
available in at least one common area
85% of properties have installed low flow 74% of properties have installed
aerators to conserve water occupancy sensors for reducing 76% of properties have eliminated plastic
heating/cooling when guestrooms are straws from the property
unoccupied
81% of properties have implemented at
least one measure to improve water
72% of properties have installed LED 51% of properties compost food waste
efficiency over the past four years
interior light bulbs property-wide
71% of properties use native or drought
tolerant landscaping to reduce irrigation
needs Newly Stated Emissions Goal
53% of properties have a smart irrigation In Pebblebrook’s recently published ESG report, we announced that we are targeting to
system and/or are equipped with reduce our GHG emissions intensity by 35% by 2030.
automatic sprinkler systems with moisture
sensors to prevent watering during or 10% of our annual cash bonus is tied to a number of ESG initiatives we’ve committed to
after rain in 2022.
26
(1) All metrics represent year-end 2021 figures.Appendix
27
the marker key west harbor island resortINVESTOR PRESENTATION FEBRUARY 2023
2023 Capital Investment Highlights
Our outlook for capital investments is on a project-by-project basis depending on various factors such as scope,
hotel demand, market recovery pace and supply chain lead times.
Hotel Amount Scope Timing
Phase one of a multi-phase master plan, which, when
complete, will add further variety to accommodations,
Skamania Lodge $11.0 Q1 2022 – Q3 2023
amenity and meeting space offerings (i.e. new tree
houses, glamping units, a pavilion, etc.)
Comprehensive redevelopment and renovation,
Hilton San Diego
$25.0 including expanded outdoor bar/dining/event space Q3 2022 – Q2 2023
Gaslamp Quarter
highlighting California's casual modern elegance
Comprehensive transformation bringing southern luxury
Jekyll Island Club Resort $20.0 to $22.0 Q3 2022 – Q2 2023
to a historic and iconic resort
Comprehensive guestroom renovation, including all
case goods, soft goods and bathrooms, completing
Viceroy Santa Monica Hotel $9.0 Q4 2022 – Q1 2023
the two-phase redevelopment restoring this luxury
iconic lifestyle hotel
Solamar Hotel Comprehensive redevelopment and repositioning,
(conversion to which, when relaunched, will open as Margaritaville
$27.0 Q4 2022 – Q2 2023
Margaritaville Hotel San Diego Hotel San Diego Gaslamp Quarter, a lifestyle hotel
Gaslamp Quarter) featuring the Margaritaville offerings and state of mind
Comprehensive guestroom, lobby, spa, pool and
Estancia La Jolla Hotel & Spa $20.0 to $25.0 indoor and outdoor venue renovation and Q4 2022 – Q2 2024
repositioning
Significant redevelopment and upgrading of 50
guestrooms and suites, elevating the guestrooms,
Southernmost Beach Resort $11.0 Q3 2023 – Q4 2023
public spaces and exteriors to a more contemporary,
coastal, luxurious design
Forecasted Total Portfolio 2023 Capital Investments = $145.0 to $155.0
28
Note: Dollars in millions.Skamania Lodge (Renderings)
29Margaritaville Hotel San Diego Gaslamp Quarter (Renderings)
30Hilton San Diego Gaslamp Quarter (Renderings)
31Jekyll Island Club Resort (Renderings)
32Viceroy Santa Monica
33INVESTOR PRESENTATION FEBRUARY 2023
Historical Hotel EBITDA
2022
Portfolio / Hotel 2010 2011 2012 2013 2014 2015 2016 2017 2018 2019 2020 2021 2022
per Key
Unique Lifestyle Resorts
LaPlaya Naples(1) $5.7 $7.6 $8.7 $10.7 $12.4 $15.7 $16.2 $11.8 $16.5 $17.7 $14.0 $27.4 $24.8 $131.2
Inn on Fifth N/A N/A N/A N/A N/A N/A N/A N/A N/A 5.1 4.2 9.7 11.9 100.0
Southernmost 9.0 10.4 10.8 14.1 17.6 19.9 21.1 17.9 19.3 21.4 13.1 24.4 24.2 82.6
Marker Key West N/A N/A N/A N/A N/A 4.8 5.8 4.6 5.6 6.0 3.1 7.9 7.9 82.3
L'Auberge Del Mar 4.6 5.4 5.6 7.7 8.1 9.9 9.3 9.4 9.5 7.3 2.7 8.5 9.0 74.4
Margaritaville N/A N/A N/A N/A N/A N/A N/A N/A N/A 17.8 0.4 22.1 24.5 66.4
Newport N/A N/A N/A N/A N/A N/A N/A N/A N/A 7.4 4.2 13.9 13.1 51.0
Estancia La Jolla N/A N/A N/A N/A N/A N/A N/A N/A N/A 8.1 (0.3) 4.6 10.6 50.5
Skamania Lodge 4.4 4.8 5.2 6.0 6.8 7.7 8.1 9.0 9.5 10.3 1.2 7.7 12.3 47.3
Chaminade 3.3 3.6 3.7 4.3 4.7 5.0 4.8 5.2 5.4 4.4 (1.1) 3.3 7.3 46.8
Paradise Point 8.3 11.8 13.7 14.8 16.1 16.7 14.7 16.8 17.5 15.3 4.6 14.1 20.5 44.4
Jekyll Island N/A N/A N/A N/A N/A N/A N/A N/A N/A 5.0 2.7 8.7 7.4 37.0
Mission Bay Resort 4.4 4.7 5.2 5.5 7.0 7.9 8.3 8.8 8.1 5.5 (4.2) 6.9 9.5 26.6
Resorts Total $39.7 $48.3 $52.9 $63.1 $72.7 $87.6 $88.3 $83.5 $91.4 $131.3 $44.6 $159.2 $183.0 $59.2
Note: Dollars in millions, except Hotel EBITDA per Key, which is in thousands. These historical Hotel EBITDA results include available information for all of the hotels the Company owned or had
an ownership interest in as of February 21, 2023. These historical operating results include periods prior to the Company's ownership of the hotels. The information above does not reflect the
Company's corporate general and administrative expense, interest expense, property acquisition costs, depreciation and amortization, taxes and other expenses.
(1) LaPlaya Beach Resort & Club’s 2022 Hotel EBITDA reflects the actuals achieved in 2022, which were impacted by Hurricane Ian in late September. The resort’s Hotel EBITDA for 2022 would 34
have been approximately $35.4 million, incorporating the actual achievement for Q1-Q3 and the pre-hurricane Q4 forecast.INVESTOR PRESENTATION FEBRUARY 2023
Historical Hotel EBITDA, Continued
2022
Portfolio / Hotel 2010 2011 2012 2013 2014 2015 2016 2017 2018 2019 2020 2021 2022
per Key
Boston Urban
Liberty $6.1 $9.6 $13.3 $15.8 $17.2 $18.2 $18.5 $19.0 $21.4 $21.2 $0.3 $10.5 $21.1 $70.8
Revere(1) 3.3 6.1 5.7 9.2 11.7 13.3 12.2 12.6 12.4 11.8 (6.1) 2.8 15.7 44.1
Westin Copley 21.3 23.5 24.4 25.8 28.7 32.7 33.3 31.5 28.5 32.9 (4.4) 3.0 30.7 38.2
W Boston 3.8 4.4 5.8 6.2 8.1 9.6 9.3 9.2 7.9 8.1 (2.6) 2.4 7.2 30.3
Hyatt Regency 6.2 6.7 7.3 7.7 9.3 11.1 10.8 10.8 10.7 10.1 (2.2) 1.6 5.6 20.7
Boston Total $40.7 $50.3 $56.5 $64.7 $75.0 $84.9 $84.1 $83.1 $80.9 $84.1 ($15.0) $20.3 $80.3 $40.9
Miami Urban
Colonnade $1.9 $2.1 $1.8 $3.1 $3.4 $3.6 $3.9 $4.0 $4.5 $4.1 ($0.3) $3.0 $4.8 $30.6
Miami Total $1.9 $2.1 $1.8 $3.1 $3.4 $3.6 $3.9 $4.0 $4.5 $4.1 ($0.3) $3.0 $4.8 $30.6
San Diego Urban
Westin Gaslamp $8.4 $8.2 $9.7 $11.2 $12.7 $14.6 $16.9 $16.0 $14.4 $14.2 ($1.3) $2.2 $12.7 $28.2
Embassy Suites 7.6 8.2 8.8 8.9 9.5 11.3 11.3 11.1 11.7 10.4 (0.2) 4.5 9.1 26.7
Solamar 5.2 6.3 6.5 6.3 6.5 7.4 7.7 7.3 7.3 7.0 (0.4) 2.1 6.2 26.4
Hilton Gaslamp 7.6 8.5 8.8 8.9 9.5 10.5 10.9 11.1 11.6 10.5 (0.4) 0.6 7.1 24.8
San Diego Total $28.8 $31.2 $33.8 $35.3 $38.2 $43.8 $46.8 $45.5 $45.0 $42.1 ($2.3) $9.4 $35.1 $26.8
Note: Dollars in millions, except Hotel EBITDA per Key, which is in thousands. These historical Hotel EBITDA results include available information for all of the hotels the Company owned or had
an ownership interest in as of February 21, 2023. These historical operating results include periods prior to the Company's ownership of the hotels. The information above does not reflect the
Company's corporate general and administrative expense, interest expense, property acquisition costs, depreciation and amortization, taxes and other expenses.
(1) The parking garage at Revere Hotel Boston Common was sold on June 23, 2017. The historical results for Revere Hotel Boston Common have been adjusted to reflect the estimated impact 35
of excluding the parking-related income.INVESTOR PRESENTATION FEBRUARY 2023
Historical Hotel EBITDA, Continued
2022
Portfolio / Hotel 2010 2011 2012 2013 2014 2015 2016 2017 2018 2019 2020 2021 2022
per Key
Los Angeles Urban
Le Parc $4.2 $4.5 $4.7 $5.3 $5.6 $6.1 $7.0 $6.1 $6.1 $5.8 ($0.1) $2.8 $5.5 $35.7
Viceroy 3.0 5.8 6.9 7.6 8.2 8.4 7.8 7.0 6.6 6.2 (2.9) 1.8 5.4 32.0
Chamberlain 1.0 3.4 3.8 4.1 4.8 4.8 5.2 4.4 3.1 3.7 (0.2) 1.2 3.5 30.4
Montrose 3.9 4.3 4.2 5.5 5.9 5.9 6.5 5.9 3.9 4.7 0.3 1.0 3.6 27.1
W Los Angeles 5.6 6.9 8.0 8.7 8.9 9.5 12.3 11.5 10.2 8.4 (2.0) 0.7 6.8 22.9
Delfina 5.3 6.8 6.9 8.0 9.9 11.7 13.8 13.4 12.7 11.2 (0.8) 2.2 7.0 22.6
Mondrian 7.9 8.9 7.4 8.2 11.0 12.2 12.6 11.8 8.6 7.6 (2.0) 2.1 5.0 21.2
Palomar 2.3 2.9 3.9 3.8 4.5 4.2 6.2 4.0 7.4 5.7 (4.2) (1.2) 3.6 13.6
Ziggy 1.9 2.2 2.2 2.0 1.5 0.9 2.8 2.8 2.8 2.8 0.0 1.1 1.1 10.2
Los Angeles Total $35.1 $45.7 $48.0 $53.2 $60.3 $63.7 $74.2 $66.9 $61.4 $56.1 ($11.9) $11.7 $41.5 $23.2
Portland Urban
Nines $6.2 $8.0 $8.9 $10.8 $12.8 $15.2 $15.6 $15.8 $15.6 $13.0 ($0.6) $3.8 $8.0 $24.2
Heathman 1.5 1.6 1.9 2.4 3.0 5.7 4.4 4.3 3.4 4.2 (0.9) 0.4 1.2 7.9
Zags 2.7 3.3 3.9 4.5 5.6 6.5 6.7 5.4 3.8 3.3 (1.0) (0.6) 0.4 2.3
Portland Total $10.4 $12.9 $14.7 $17.7 $21.4 $27.4 $26.7 $25.5 $22.8 $20.5 ($2.5) $3.6 $9.6 $14.6
Wash DC Urban
George $4.2 $4.6 $4.1 $4.1 $4.3 $5.2 $5.7 $6.3 $5.7 $5.3 ($0.5) $0.0 $3.7 $26.6
Monaco DC 5.5 6.9 7.6 7.9 7.9 8.1 8.1 9.9 8.6 7.9 (1.4) (0.5) 4.7 25.5
Viceroy DC 3.3 3.6 3.4 3.2 3.2 3.0 3.6 5.8 5.5 4.9 (2.3) (1.3) 1.1 6.2
Zena 4.0 4.6 3.8 4.3 5.2 5.8 6.1 6.4 5.1 3.8 (2.3) (2.7) 0.6 3.1
Wash DC Total $17.0 $19.7 $18.9 $19.5 $20.6 $22.1 $23.5 $28.4 $24.9 $21.9 ($6.5) ($4.5) $10.1 $14.6
Note: Dollars in millions, except Hotel EBITDA per Key, which is in thousands. These historical Hotel EBITDA results include available information for all of the hotels the Company owned or had
an ownership interest in as of February 21, 2023. These historical operating results include periods prior to the Company's ownership of the hotels. The information above does not reflect the 36
Company's corporate general and administrative expense, interest expense, property acquisition costs, depreciation and amortization, taxes and other expenses.INVESTOR PRESENTATION FEBRUARY 2023
Historical Hotel EBITDA, Continued
2022
Portfolio / Hotel 2010 2011 2012 2013 2014 2015 2016 2017 2018 2019 2020 2021 2022
Per Key
Chicago Urban
Hotel Chicago $5.5 $5.3 $7.3 $8.4 $8.5 $10.4 $12.4 $12.3 $12.6 $12.2 ($1.4) $0.6 $7.4 $20.9
Westin Mich Ave 14.7 15.8 16.7 16.0 18.0 19.4 17.9 13.1 12.0 9.9 (9.5) (3.3) 6.5 8.6
Chicago Total $20.2 $21.1 $24.0 $24.4 $26.5 $29.8 $30.3 $25.4 $24.6 $22.1 ($10.9) ($2.7) $13.9 $12.6
Seattle Urban
Monaco Seattle $2.2 $2.9 $3.4 $5.2 $6.2 $6.7 $6.1 $6.1 $6.4 $5.6 ($1.7) ($0.6) $2.1 $11.1
Vintage Seattle 1.8 2.2 2.4 2.7 2.6 3.5 3.4 3.5 3.5 3.0 (1.5) (0.6) 1.0 8.0
Seattle Total $4.0 $5.1 $5.8 $7.9 $8.8 $10.2 $9.5 $9.6 $9.9 $8.6 ($3.2) ($1.2) $3.1 $9.9
San Fran Urban
Argonaut $5.2 $6.5 $8.5 $10.2 $11.8 $13.0 $13.0 $11.7 $12.9 $14.6 ($1.5) $1.5 $7.1 $28.2
Harbor Court 2.7 4.0 3.7 4.9 5.8 6.1 5.6 3.9 4.3 5.6 (0.3) (1.0) 2.0 15.3
Zephyr 7.3 8.7 11.2 12.1 12.1 12.6 16.2 13.1 13.7 16.8 (1.1) 0.5 4.9 13.6
Zetta N/A N/A N/A 2.8 5.4 6.2 5.6 5.5 6.0 6.0 (0.3) (1.4) 1.4 12.1
Zoe N/A N/A 5.2 6.6 7.9 8.2 7.8 3.6 7.7 8.9 (1.5) (1.7) 1.3 5.9
Zelos 1.3 3.0 3.8 4.6 6.2 7.3 5.9 7.2 6.9 8.4 (2.5) (4.6) (0.1) (0.5)
Zeppelin N/A 2.3 2.7 3.4 4.0 4.0 3.3 6.3 7.5 7.7 (1.2) (1.6) (1.2) (6.1)
1 Hotel 4.0 6.0 7.4 7.3 8.6 11.0 10.3 9.8 8.0 7.5 (4.0) (4.9) (2.9) (14.5)
San Fran Total $20.5 $30.5 $42.5 $51.9 $61.8 $68.4 $67.7 $61.1 $67.0 $75.5 ($12.4) ($13.2) $12.5 $7.4
Urban Total $178.6 $218.6 $246.0 $277.7 $316.0 $353.9 $366.7 $349.5 $341.0 $335.0 ($65.0) $26.4 $210.9 $21.8
Total Portfolio $218.3 $266.9 $298.9 $340.8 $388.7 $441.5 $455.0 $433.0 $432.4 $466.3 ($20.4) $185.6 $393.9 $30.9
Note: Dollars in millions, except Hotel EBITDA per Key, which is in thousands. These historical Hotel EBITDA results include available information for all of the hotels the Company owned or had
an ownership interest in as of February 21, 2023. These historical operating results include periods prior to the Company's ownership of the hotels. The information above does not reflect the 37
Company's corporate general and administrative expense, interest expense, property acquisition costs, depreciation and amortization, taxes and other expenses.jekyll island club resort
You can also read