Source Rock Royalties - Corporate Presentation Q2 2022 - TSXV: SRR - SRR.WT - Capital Event Management Ltd.
←
→
Page content transcription
If your browser does not render page correctly, please read the page content below
Source                   NO CAPITAL COSTS
                         NO LIABILITIES
Rock                     HIGH NETBACK
Royalties
Corporate Presentation
Q2 2022

TSXV: SRR - SRR.WT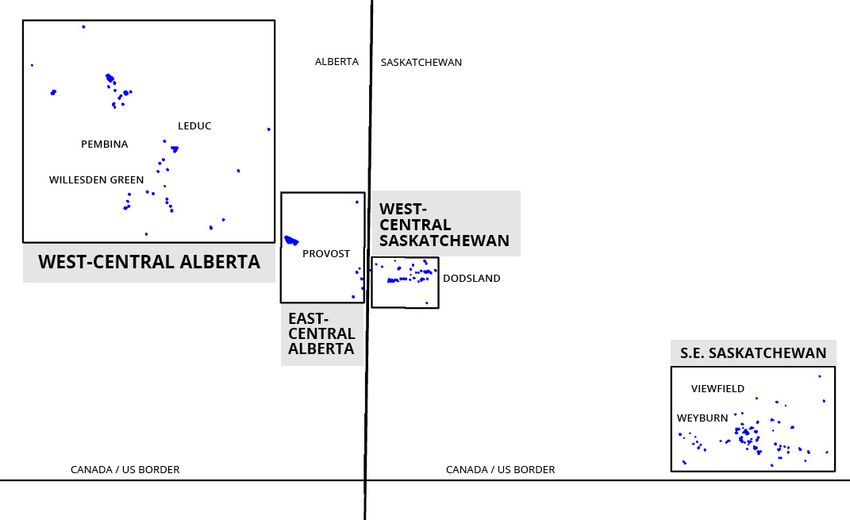
Corporate Overview
The only publicly listed pure-play junior oil and gas royalty company
in Canada...positioned to accelerate growth

                   CAPITAL STRUCTURE                                                                                                    CORPORATE HIGHLIGHTS

                                                                                                                 » 9.5% owned by management & directors
     Common Shares                                44,896,645                                                     » 21% owned by CN Rail Pension Fund
                                                                                                                 » $14.5 MM working capital ($0.32 / share) (May 2022)
                                                                                                                 » NO DEBT
                                                   7,667,050
           Warrants
                                                   (@ $1.25)

                                                                                                                » Q4 2021 record revenue = $1.247 MM            ($0.042 / share)

                                                                                                                » Q4 2021 record adjusted EBITDA1 = $1.103 MM   ($0.037 / share)
         Stock Options                             2,490,000
                                                                                                                » Q4 2021 record funds from ops1 = $1.021 MM    ($0.035 / share)

                                                                                                                » Q4 2021 operating netback 1 = $72.13

    Exp. 2022 to 2025                           $0.40 - $1.00                                                   » Q4 2021 corporate netback 1 = $66.75

                                                                                                                » Q4 2021 payout ratio1 = 43%

         Fully Diluted                            55,053,695

            Notes:
            (1) T
                 his is a non-GAAP financial measure or non-GAAP ratio. Refer to the disclosure under the heading “Non-GAAP Measures” for more information
Page 2          on each non-GAAP financial measure or ratio.
Management & Directors Well-rounded
capital markets and
A diverse group of professionals that have an extended deal-flow team
history with the business model
MANAGEMENT TEAM INDEPENDENT DIRECTORS
Unique on-the-
ground industry
Brad Docherty, LL.B., B.A.* Dean Potter, P. Geo +
relationships
Founder, President, C.E.O. & Director (Chairman) Burgess Creek Exp., DPX Inc., Elkhorn Resources,
» B.D. Corporate Services: Executive Consultant Medora Resources
» Capitalize Consulting: Business Advisor
Shaun Thiessen, Land + t
» Gowling Lafleur Henderson LLP:
Astara Energy, Astra Oil, PrairieSky (PSK.t), Encana (ECA.t)
Corporate Finance & Securities Lawyer
Technical expertise
Jordan Kevol, Geologist t
= asset evaluation
Sean Clausen, CPA CA Blackspur Oil, Petro Uno Resources, Reece Energy Exp.
back-stop
Chief Financial Officer
Scott Rideout, Land t
» True North Solutions: VP Finance Headwater Exploration (HWX.t), Baytex Energy (BTE.t),
» CanElson Drilling: Corporate Controller Raging River Exp. (RRX.t), Surge Energy (SGY.t)
» Tarpon Energy Services: Director of Finance
» Precision Drilling (PD.t): Divisional Controller Gary McMurren, P. Eng * +
Southern Energy (SOU.v), Gulf Pine Energy, Athabasca Oil Vested and
Lucas Tomei, LL.B., B.Sc. (ATH.t), Galleon Energy, Talisman Energy committed to
Corporate Secretary near-term growth
John Bell, C.A.* t and long-term
» Dentons Canada LLP: sustainability
WCSB Blockchain, Tidewater Midstream (TWM.t), Artisan
Corporate Finance & Securities Lawyer
Energy, Cirrus Energy, Zapata Energy, Collins Barrow
Brody Loster, P. Geo
Vault 44.01, Baytex Energy (BTE.t), Raging River Exp.
(RRX.t), Wildstream Exp.,Wave Energy
Page 3 * Audit Committee t Corporate Governance and Compensation Committee + Reserves CommitteeSource Rock Royalties History
Established portfolio of high netback royalty interests and an 8+ year
track record of executing on a balanced growth and yield business model Track-record
of completing
royalty acquisitions
» Equity financings completed @ $0.80-$1.30 » IPO completed on the TSXV @ $0.90 per Unit
» Numerous royalty acquisitions closed » Unit includes 2 year 1/2 warrant @ $1.25 Track-record of
» Dividends declared in 26 of 28 quarters = $8.43 MM » $12.82 MM in net proceeds raised positive funds from
» Q1 2022 dividend paid = $0.015 / share operations
2013 - 2020 2021 2022
Track-record of
paying a dividend
to shareholders
» $1.33 MM of acquisitions
» Quarterly production in Q4 - 166 boe/d
(90% oil & NGLs)
» Record quarterly revenue in Q4 - $1.25 MM
» $1.77 MM in dividends declared including
Q4 Return of Capital
» 24 gross wells drilled on royalty lands
Page 4Balanced Growth & Yield Strategy
Providing income to shareholders for 8+ years while achieving revenue Dividends paid
growth, asset diversification and upside drilling exposure in each of the
last 8+ years
= $10.87 MM
2021 record funds
WTI Price
from operations
= $3.7 MM
($0.126 / share)
Dividends
$0.06 $0.06 $0.06 $0.06 $0.06 $0.06 $0.02 $0.06*
Declared
(per share)
2021 Payout
Ratio = 40%
Source: https://www.macrotrends.net/2516/wti-crude-oil-prices-10-year-daily-chart
*Includes the Q4 2021 Return of Capital paid in Jan 2022
Per Share: 2019 2020 2021
Funds from Operations1 ($) 0.086 0.036 0.126
Notes:
Page 5 (1) This is a non-GAAP financial measure. Refer to the disclosure under the heading “Non-GAAP Measures” for more information.Q4 2021 Results: Sensitivity Analysis
Pro forma IPO dividend fully funded by current operations
Funds from
operations per
* Q4 2021 - 166 boe/d (90% oil & NGLs) share growth +
* $0.015/share quarterly dividend (43% payout) a sustainable
* Before any new aquisitions
dividend
$1,400
Q4 2021
Revenue, G&A, Funds from Operations & Dividends (000’s)
$1,200
Minor G&A
increases required
$1,000 as growth is
achieved
$800
Pro forma IPO
Dividend
$600
Per share leverage
Q4 2021 to a higher oil price
Dividend
$400 and increased
drilling activity
$200
$0
$70 Cdn/boe $81.50 Cdn/boe $90 Cdn/boe
Realized Price Realized Price Realized Price
G&A Funds from Operations1 Cash Taxes
Page 6 Notes:
(1) This is a non-GAAP financial measure. Refer to the disclosure under the heading “Non-GAAP Measures” for more information.A Strategic Approach to Oil & Gas Production
Passive nature of interests allows for a sustainable and scalable business No cost exposure
model with exposure to upside development at no additional cost = insulation from
industry inflation
Top-line revenue Target key areas
with little or with strong
no deductions operators
exposure
Target proven
Minimal Development and
Interest long-life reserves
management cost optimization upside
requirements in land at no cost
Maximize exposure
No exposure to to ‘free’ upside
abandonment,
environmental &
reclamation costs
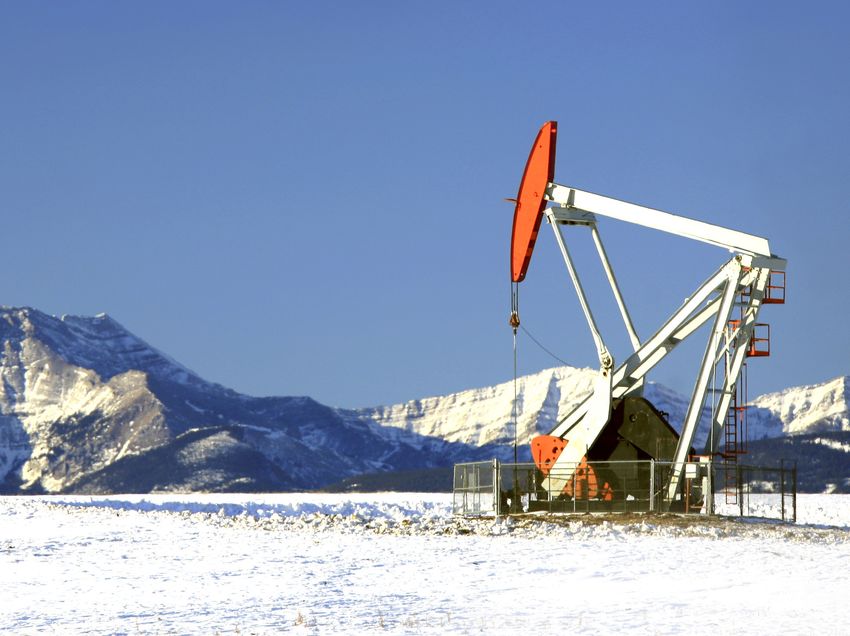
Page 7Royalty Asset Overview ~75,000 gross acres of
royalty lands
Diversified platform of light oil focused royalties across
Saskatchewan & Alberta with well positioned royalty payors
Base production from
volume royalty
160 - 170 boe/d
(90% oil and NGLs)
24 gross wells drilled
in 2021
99% of 2021 royalty revenue was paid by...
» Longshore Resources » Whitecap Resources
» Anova Resources » Vermilion Energy
» Tundra Oil & Gas » Saturn Oil & Gas
» Crescent Point Energy » Summerland Energy
» CNRL » Teine Energy
» Bonavista Energy » Triland Energy
» ROK Resources » InPlay Oil
» Ridgeback Resources » Surge Energy
Page 8Oil & Gas Royalty Acquisition Landscape
Numerous paths available for growth and asset diversification
ROYALTY PARTNERSHIPS
» “GORR” is no longer a 4-letter word → acceptance is evident in recent transactions
» Off balance sheet capital that is attached to the mineral leases (“interest in land”)
Royalty » Non-dilutive and passive capital without post-transaction review obligations
Capital » Mutually beneficial arrangements with both parties vested to see profitable asset development
» Fairly unavailable for junior/mid-cap producers → very dilutive if it is
Equity » Despite recent commodity price strength valuations are near historical lows
» Lenders are broadly backing away from junior/mid-cap Canadian oil and gas producers
Debt
» Junior/mid-cap producers have become debt averse - several guiding to a goal of $0 debt
» Constant review of facilities is burdensome on junior/mid-cap producers (strict covenants)
» Relationships between lenders and junior/mid-cap producers are strained (interests not aligned)
» “DEBT” is the new 4-letter word in Canadian oil & gas
EXISTING ROYALTIES FEE TITLE & MINERAL INTERESTS
» No database = barrier to entry » Industry relationships = partners for land development
» 8+ years of boots on the ground = royalty intel » ‘Land fund capital’ is a proven strategy
» Niche relationships = embedded deal-flow » Pursue targeted mineral acquisitions to farm-out
» Many royalties are commingled in non-royalty platforms » Layer in highly prospective undeveloped land as cash flow scales
Page 9ESG Strategies
A business model that by its very nature supports ESG policies and practices
Environmental Social/Sustainability
» All royalty properties are in Canada = stringent regulations » Provide financial support to local causes
and industry leadership in technology innovation
» Maintain a low-cost operating platform to ensure long-term
» No field operations = no exposure to well abandonment or sustainability and allow for a portion of funds from operations
facility de-commissioning liabilities or reclamation obligations to contribute to environmental and social initiatives
» Align ourselves with competent operators that are strong » Manage business risk by avoiding the use of leverage and
minimizing ongoing financial obligations
stewards of environmental policies and best practices
» Royalty Payors are committed to operate in accordance with Governance
good oilfield practices and in compliance with all laws
» Maintain a large Board of almost entirely Independent
Directors to maximize expertise, minimize conflicts of interest
and ensure the highest ethical standards
» Almost entirely independent Committees to oversee audit &
reserves activities and to set management compensation
» Regularly evaluate Board gender and skill-set diversification
Page 10APPENDIX
Royalty Asset Information
Page 11SE Sask Light Oil GORR’s
Light oil GORR’s in an active fairway with well-positioned operators
and royalty & mineral interest consolidation opportunities 2021 royalty
production
= ~50 boe/d
VIEWFIELD
Key operators
include Whitecap,
Vermilion, Anova,
Crescent Point,
WEYBURN Tundra & Saturn
STEELMAN
16 gross Frobisher
wells drilled
in 2021 - drilling
ongoing
CANADA / U.S. BORDER
» Base production with identified upside drilling locations
» Approximately 20,000 gross acres of royalty lands
» Looking to expand assets in this fairway → royalty option in place with a private SE Sask operator
» Region provides insulation from any Alberta / W. Sask pricing differential issues due to selling at Cromer, MB
Page 12Hamilton Lake Unit Viking Light Oil Royalty
Light oil royalty exposure with leverage to higher oil prices
Provides base light
oil production
Volume Royalty
» Covered by Hamilton Lake
Unit and Viking lands of
Longshore Resources at
Consort and Esther
» 95 bbl/d in 2022
Well capitalized
private equity
» 20% per year decline backed operator
2023 – 2034
PROVOST
» 16,800 “accumulated
barrels” from 2020 shut-in
» Conversion to 0.50% GORR
» $10.9 MM received from the PVR for July 2015 to March 2022
or $500,000 buy-out at end Reserves exposure
of term provides ongoing
upside with higher
oil prices
Page 13West-Central Alberta & Saskatchewan GORR’s
Base production with development drilling and undeveloped land exposure
WEST-CENTRAL SASKATCHEWAN Various GORR’s in
~55,000 gross acres
of lands
Lands are in
areas with
active industry
DODSLAND
development
WEST-CENTRAL ALBERTA
» Primary development in the Viking Certain lands
and Mannville formations recently moved to
stronger hands
» Certain wellbores remain shut-in
following recent ownership transfers
LEDUC
» Multi-zone development potential in
PEMBINA
west-central Alberta
» Periodic development drilling
WILLESDEN GREEN ongoing in west-central
Saskatchewan
Page 14Cautionary Statements and Advisories
The information contained in this presentation does not purport to be all-inclusive or to contain all information that expenditures; the Company’s future income tax expense; the regulatory framework governing royalties, taxes and
readers may require. Readers are encouraged to conduct their own analysis and reviews of Source Rock Royalties environmental matters in the jurisdictions in which the Company conducts its business and any other jurisdictions in
Ltd. (the “Company”) and of the information contained in this presentation. Without limitation, readers should which the Company may conduct its business in the future; the absence of any material litigation or claims against the
consider the advice of their financial, legal, accounting, tax and other advisors and such other factors they consider Company; the recoverability of the Company’s reserves; future cash flows from production meeting the expectations
appropriate in investigating and analyzing the Company. stated in this presentation; geological and engineering estimates in respect of the Company’s reserves; the intentions
of the Board with respect to the executive compensation plans and corporate governance programs described
Forward-Looking Statements herein; the impact of competition on the Company; the Company’s ability to obtain qualified staff in a timely and cost-
Certain statements contained in this presentation constitute forward-looking statements. These statements relate efficient manner; and the Company’s ability to obtain financing on acceptable terms.
to future events or the Company’s future performance. All statements other than statements of historical fact are Actual results could differ materially from those anticipated in these forward-looking statements as a result of the
forward-looking statements. The use of any of the words “anticipate”, “plan”, “contemplate”, “continue”, “estimate”, risk factors set forth below and included elsewhere in this presentation, including: volatility in market prices for
“expect”, “intend”, “propose”, “might”, “may”, “will”, “shall”, “project”, “should”, “could”, “would”, “believe”, “predict”, crude oil and natural gas; risks related to the exploration, development and production of oil and natural reserves;
“forecast”, “pursue”, “potential” and “capable” and similar expressions, or the negatives thereof, are intended to risks relating to the Company’s dividend policy, including any changes thereto such as a decrease or elimination of
identify forward-looking statements. These statements involve known and unknown risks, uncertainties and other the payment of dividends by the Company as a result of a Board determination or restrictions under applicable
factors that may cause actual results or events to differ materially from those anticipated in such forward-looking agreements or corporate laws; the Company’s royalty lands not being developed by third parties in the manner
statements. No assurance can be given that these expectations will prove to be correct and such forward-looking anticipated by the Company; failure by counterparties to make payments or perform their operational or other
statements included in this presentation should not be unduly relied upon. These statements speak only as of the obligations to the Company in compliance with the terms of contractual arrangements between the Company and
date of this presentation. In addition, this presentation may contain forward-looking statements and forward-looking such counterparties; the Company’s status and stage of development; general economic, market and business
information attributed to third party industry sources. conditions; risks of health epidemics, pandemics and similar outbreaks, including COVID-19, which may have
In particular, this presentation contains forward-looking statements pertaining to the following: the estimated sustained material adverse effects on the Company’s business, financial position, results of operations and cash flows;
production and decline rates from the Company’s assets; the Company’s expectations regarding commodity prices; current global financial conditions, including fluctuations in interest rates, foreign exchange rates and stock market
expectations regarding the Company’s cash tax amounts due; supply and demand fundamentals for crude oil and volatility; competition for, among other things, capital and the acquisition of royalties; risks related to the environment
natural gas; the cash available for the payment of dividends; the Company’s dividend policy, including the sustainability and changing environmental laws in relation to the operations conducted on the Company’s royalty lands; climate
of dividend payments and the amount and timing of dividend payments; the timing for receipt of regulatory change risks, including the effects of unusual weather and natural catastrophes; actions by governmental authorities,
approvals; the financial strength of the Company’s royalty payors; expectations regarding the possibility that the including changes in government regulation and taxation; geological, technical, drilling and completions, processing
Company’s ongoing working relationships will lead to future royalty acquisition opportunities; expectations regarding and handling issues (including deductions from the Company’s royalty share of production) associated with crude
drilling activity to be undertaken by operators in areas in which the Company owns royalties and the resulting level of oil and natural gas development activities by third parties; failure of third parties’ reviews, reports and projections
anticipated production; the Company’s growth strategy, including through acquisitions; expectations with respect to to be accurate; the availability of capital on acceptable terms; political risks; changes in tax or environmental laws
future opportunities; expectations with respect to future funds from operations and other financial results, including or royalty or incentive programs relating to the oil and natural gas industry; changes to royalty or tax regimes; the
expected production and revenue from the PVR and the proportion that revenue from the PVR constitutes of total failure of the Company or the holders of certain licenses or leases to meet specific requirements of such licenses or
revenue; the long-term impact of COVID-19 on the Company’s business, financial position, results of operations and leases; claims made or legal actions brought against the Company in respect of the Company’s properties or assets;
cash flows; the estimated quantity and value of the Company’s proved and probable reserves; estimates of future aboriginal claims; unforeseen title defects; risks arising from future acquisition activities; potential conflicts of interest;
interest and foreign exchange rates; the development of undeveloped reserves and the expected timing thereof; the potential for management estimates and assumptions to be inaccurate; risks associated with establishing and
expectations that the Company’s competitive advantages will yield successful execution of its business strategy; the maintaining systems of internal controls; risks related to the reliance on historical financial information, including
potential for production disruption and constraints; industry conditions pertaining to the oil and gas industry; the that historical financial information does not reflect the added costs that the Company expects to incur as a public
Company’s treatment under governmental regulatory regimes and tax laws; and the Company’s future general and entity; volatility in the market price of the Company’s common shares or warrants; the effect that the issuance of
administrative expenses (“G&A”). additional securities by the Company could have on the market price of the Company’s common shares or warrants;
uncertainties inherent in estimating quantities of oil and natural gas reserves; and discretion in the use of proceeds
With respect to forward-looking statements and forward-looking information contained herein, assumptions
of the Company’s working capital.
have been made regarding, among other things: future crude oil and natural gas prices; the Company’s future
production levels; the ability of the working interest owners in the Company’s royalty lands to maintain or increase In addition, information and statements in this presentation relating to “reserves” are deemed to be forward-looking
production and reserves from these properties; the ability of the working interest owners in the Company’s royalty information and statements, as they involve the implied assessment, based on certain estimates and assumptions,
lands to successfully market their respective crude oil and natural gas products; the ability of the Company to that the reserves described exist in the quantities predicted or estimated, and that the reserves described can
enforce contractual provisions in order to receive payments in respect of its royalty lands; the willingness and be profitably produced in the future. Readers are cautioned that the foregoing list of risk factors should not be
financial capability of the working interest owners in the Company’s royalty lands to continue to develop and invest construed as exhaustive.
additional capital in the Company’s royalty lands and to obtain financing on acceptable terms, or at all, to fund capital
Page 15Cautionary Statements and Advisories (Continued)
The forward-looking statements included in this presentation are expressly qualified by this cautionary statement by Source Rock to assess the cash generating and operating performance of its royalties against prior periods and to
and are made as of the date of this presentation. The Company does not undertake any obligation to publicly update assess the costs efficiency of its operating platform as it relates to production volumes.
or revise any forward-looking statements except as required by applicable securities laws.
“Corporate netback” is calculated as funds from operations divided by cumulative production volumes for the period.
Certain statements included in this presentation may be considered “financial outlook” or “future-oriented financial Corporate netback is used by Source Rock to better analyze the financial performance of its royalties against prior
information” (“FOFI”) for purposes of applicable securities laws, all of which are subject to the same assumptions, periods and to assess the cost efficiency of its overall corporate platform as it relates to production volumes.
risk factors, limitations and qualifications as set forth in the above paragraphs. The actual results of operations
of the Company and the resulting financial results will likely vary from the amounts set forth in this presentation Oil and Gas Information Presentation Advisories
and such variation may be material. The Company and its management believe that the FOFI has been prepared on Source Rock has adopted the standard of 6 mcf:1 bbl when converting natural gas to oil equivalent. Boes may be
a reasonable basis, reflecting management’s best estimates and judgements. However, because this information misleading, particularly if used in isolation. A boe conversion ratio of 6 mcf:1 bbl is based on an energy equivalency
is subjective and subject to numerous risks, it should not be relied on as necessarily indicative of future results. conversion method primarily applicable at the burner tip and does not represent a value equivalency at the wellhead.
FOFI contained in this presentation was made as of the date of this presentation and was provided for the Given the value ratio based on the current price of crude oil as compared to natural gas is significantly different from
purpose of providing further information about the Company’s anticipated future business operations. Readers the energy equivalency of 6 mcf: 1 bbl, utilizing a conversion ratio of 6 mcf: 1 bbl may be misleading as an indication
are cautioned that the FOFI contained in this presentation should not be used for purposes other than for which of value.
it is disclosed herein.
Information Regarding Public Issuer Counterparties
Non-GAAP Measures & Ratios
Certain information contained in this presentation relating to the Company’s public issuer counterparties and the
This presentation contains references to “Adjusted EBITDA” and “funds from operations” which are non-GAAP nature of their respective businesses is taken from and based solely upon information published by such issuers. The
financial measures and the terms “payout ratio”, “operating netback” and “corporate netback” which are non-GAAP Company has not independently verified the accuracy or completeness of any such information.
ratios. These financial measures and ratios do not have a standardized prescribed meaning under Canadian GAAP
and therefore are referred to as non-GAAP financial measures. The non-GAAP financial measures and ratios used by Presentation of Market and Industry Data
Source Rock may not be comparable to similar measures used by other companies.
Certain market, independent third-party and industry data contained in this presentation is based upon information
“Adjusted EBITDA” is used by management to analyze Source Rock’s profitability based on its principal business from government or other independent industry publications and reports or based on estimates derived from
activities prior to how these activities are financed, how assets are depreciated, amortized and impaired, and how such publications and reports. Government and industry publications and reports generally indicate that they
the results are taxed. Additionally, amounts are removed relating to share-based compensation expense, the sale have obtained their information from sources believed to be reliable, but the Company has not conducted its
of assets, fair value adjustments on financial assets and liabilities, other non-cash items and certain non-standard own independent verification of such information. While the Company believes this data to be reliable, market
expenses, as Source Rock does not deem these to relate to the performance of its principal business. Adjusted and industry data is subject to variations and cannot be verified with complete certainty due to limits on the
EBITDA is not intended to represent net profit (or loss) as calculated in accordance with IFRS. availability and reliability of raw data, the voluntary nature of the data gathering process and other limitations and
uncertainties inherent in any statistical survey. The Company has not independently verified any of the data from
“Funds from operations” is defined as cash flows from operating activities before the change in non-cash working
independent third-party sources referred to in this presentation or ascertained the underlying assumptions relied
capital. Funds from operations, as presented, is not intended to represent operating cash flow or operating profits
upon by such sources.
for the period nor should it be viewed as an alternative to net income or other measures of financial performance
calculated in accordance with GAAP. Source Rock considers funds from operations to be a key measure of operating
performance as it demonstrates Source Rock’s ability to generate the necessary funds to fund operations, pay
dividends and repay debt, if applicable. Source Rock believes that such a measure provides a useful assessment of
Source Rock’s operations on a continuing basis by eliminating certain non-cash charges. It is also used by research
analysts to value and compare oil and gas companies, and it is frequently included in their published research when
providing investment recommendations. Funds from operations per share is calculated based on the weighted
average number of shares outstanding consistent with the calculation of net income per share.
“Payout ratio” is calculated as the aggregate of cash dividends paid in a period divided by funds from operations
realized in such period. Source Rock considers payout ratio to be a key measure to assess Source Rock’s ability to
fund operations, acquisition opportunities, dividend payments, cash taxes and debt repayments, if applicable.
“Operating netback” represents the cash margin for products sold. Operating netback is calculated as revenue minus
cash administrative expenses divided by cumulative production volumes for the period. Operating netback is used
Page 16You can also read