Management Quality and Carbon Performance of Energy Companies: September 2020 Update - Simon Dietz, Alexa Beaucamp, Dan Gardiner, Nikolaus ...
←
→
Page content transcription
If your browser does not render page correctly, please read the page content below

Management Quality and
Carbon Performance of Energy
Companies: September 2020
Update

Simon Dietz, Alexa Beaucamp, Dan Gardiner, Nikolaus Hastreiter, Valentin
Jahn, Michal Nachmany, Jolien Noels, Saskia Straub, Rory Sullivan and
Dongmiao Zhang

2

    Research Funding Partners

                 We would like to thank our Research Funding Partners for their ongoing support of TPI
                        and their enabling the research behind this report and its publication
3

    About TPI and this report
    TPI is a global initiative led by Asset Owners and supported by Asset
    Managers. Established in January 2017, TPI now has over 80 supporters
    with c. $21 trillion of combined Assets Under Management and Advice.*

    Using publicly disclosed data, TPI assesses the progress that companies are
    making on the transition to a low-carbon economy, supporting efforts to
    mitigate climate change:

    • In line with the recommendations of TCFD;

    • Providing data for the Climate Action 100+ initiative.

    All TPI data are published via an open-access online tool:
    www.transitionpathwayinitiative.org.

    This slide set presents our latest assessment of the energy sector, including
    coal mining companies, electricity utilities, and oil and gas producers and
    distribution companies.

    *September 2020
4

    Key messages
    This is TPI’s 2020 assessment of the energy sector, comprising 163 companies in coal mining, electricity, and oil and gas production and distribution. We
    have expanded our coverage from 135 companies in 2019 by adding new companies to the database and including oil and gas distribution in this report
    for the first time.

    Energy companies’ average Management Quality score is 2.7, which is just 0.1 points better than last year. The sector remains slow in implementing
    new operational and strategic carbon management practices. Within the sector, coal mining lags far behind electricity, and oil and gas, although the big
    diversified mining companies with coal businesses stand out as leaders within the coal sector.

    We see more progress on setting emissions targets and consequently on Carbon Performance. The share of companies aligned with Below 2°C has
    increased from 12% to 18%. Clearly there remains a long way to go, however. Electricity utilities continue to lead the way on Carbon Performance. No
    oil and gas company can yet claim to be aligned with 2°C or Below 2°C, although European oil and gas producers are showing leadership and getting
    closer.

    2020 has been an extraordinary year for the world. Nonetheless we do not see an obvious imprint from Covid19 in our data. We received a high
    response rate from companies to our request for feedback, we do not see any negative trends in Management Quality or Carbon Performance that are
    obviously attributable to Covid19, and the share of companies disclosing emissions data in 2020 for FY2019 has actually increased relative to 2019
    disclosures of FY2018 emissions.
5

    Contents

    1.   The state of the energy transition: overview of
         results
    2.   Sector focus: coal mining
    3.   Sector focus: electricity utilities (including a
         special feature on US companies)
    4.   Sector focus: oil and gas
    5.   About TPI: further information about the
         initiative and methodology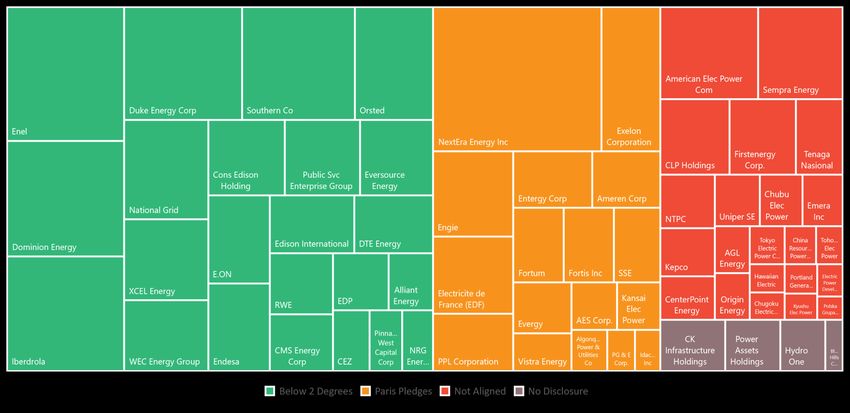
1. The state of the energy transition:
         overview of results
7

    TPI coverage of the energy industry
    This latest TPI report updates and expands our assessment of energy
    companies. We now cover 163 public companies in four energy
    sectors: coal mining, electricity, oil and gas production, and oil and
    gas distribution.                                                        Sector                     Companies assessed   Companies assessed
                                                                                                        on Management        on Carbon
    We last assessed the energy sector in September 2019, covering 135
                                                                                                        Quality              Performance
    companies. For this report, we include 22 new companies in coal,
    electricity and O&G production. We also include O&G distribution in      Coal mining                35                   6
    this report for the first time.                                          Electricity utilities      68                   66
    We class 6 of the coal miners as diversified miners. These companies     O&G production and 61                           53
    can be assessed on Carbon Performance. We published a Discussion         distribution
    Paper on Carbon Performance assessment in the diversified mining         Total                      163*                 125
    sector in May and will provide updated analysis of the whole
    diversified mining sector in our report on Industrials/Materials in
    early 2021. Pure play coal miners are not assessed on Carbon             * One company appears in two sectors
    Performance.
8

                                                                                                                          Companies’ Management Quality ratings may not always reflect their most up-to-date

    Management Quality level                                                                                              disclosures. TPI updates its assessments once a year.

    Level 0                                        Level 1                                       Level 2                                     Level 3                                      Level 4
    Unaware                                        Awareness                                     Building capacity                           Integrating into operational                 Strategic assessment
                                                                                                                                             decision making

                                                                                                                                                                                         50 Companies: 30%
                                                                                                                                            51 Companies: 31%                            6 Coal Mining Companies
                                                                                                                                                                                         (of which 3 are 4*)
                                                                                                34 Companies: 21%                           6 Coal Mining Companies
                                                                                                7 Coal Mining Companies                     24 Electricity Utilities                     28 Electricity Utilities
                                                                                                                                                                                         (of which 1 is 4*)
                                                   26 Companies: 16%                            8 Electricity Utilities                     21 Oil & Gas Companies
    3 Companies: 2%                               13 Coal Mining Companies                      19 Oil & Gas Companies                                                                   16 Oil & Gas Companies
    3 Coal Mining Companies                       8 Electricity Utilities                                                                                                                (of which 6 are 4*)

                                                  5 Oil & Gas Companies
    One company (JXTG, now ENEOS) is counted twice, since it operates in two different energy sectors
9

    Management Quality level
    Energy companies’ average Management Quality score is now 2.7,
    which is a slight improvement of 0.1 points on last year. The sector
    remains on the cusp of integrating climate change into operational
    decision making (TPI Level 3). Doing so requires both disclosure of
    operational GHG emissions and setting emissions targets, so the
    average company is at the stage of putting these two measures in
    place.

    Further inspection of the data (also see below on trends) shows that
    the average score of the new companies is 2.2, whereas the average
    score of the companies that were also assessed last year is 2.8. Thus
    the addition of new companies slightly masks progress being made, but
    not by much – energy companies remain slow in implementing new
    operational and strategic carbon management practices.

    Within the sector, electricity utilities’ average score is 3, oil and gas
    companies average 2.8, but coal miners only average 2.0. Coal mining
    remains one of the worst performing sectors in the TPI database.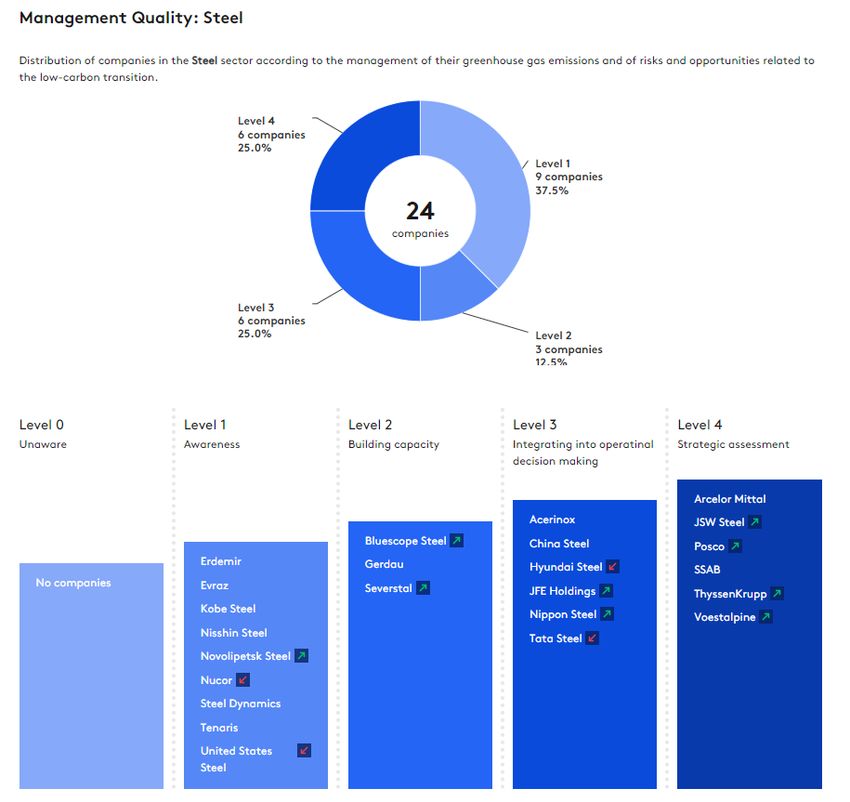
10

     Level 4* companies
                                                                4* companies     Sector
                                                                Anglo American   Coal (diversified)
     TPI awards Level 4* to companies that satisfy all
     Management Quality criteria. Depending on the sector,      BHP              Coal (diversified)
     this amounts to 18 or 19. The difference between a
                                                                Vale             Coal (diversified)
     plain vanilla Level 4 company and a Level 4* company is
     up to six additional indicators satisfied.                 Terna            Electricity

     Although there are 50 (30% of) energy companies on         BP               O&G production
     Level 4, there are only 10 on Level 4*. This underlines    Eni              O&G production
     that the vast majority of companies still have further
     carbon management practices to implement,                  Equinor          O&G production
     particularly those associated with strategic assessment.   Galp Energia     O&G production
                                                                Hess             O&G production
                                                                Total            O&G production
11
Trends in
0 1 2 3 4
Management Quality
We have trend data on 141 energy companies, which have now been
assessed by TPI at least twice. For some companies, we now have 4
2 18 21 30 37
years of Management Quality data, which can be downloaded from
our online tool.
2
Most companies (108) stay on the same level as they occupied last 2
year. This includes 37 companies that had already reached Level 4.
4
More companies (20) have moved up at least one level than have
moved down (13). 4
8
Eight companies have moved up from Level 3 to 4. A number of these
1
companies have begun to have their operational GHG emissions
2
verified, and/or can now demonstrate support for climate action.
10
Ten companies have moved down from Level 4 to 3. The single
biggest explanatory factor is a failure to continue disclosing
involvement in trade associations that are active in climate lobbying.
One company operating in two sectors (JXTG, now ENEOS) is counted once12 0% 10% 20% 30% 40% 50% 60% 70% 80% 90% 100%
L0|1. Acknowledge?
Management Quality: L1|2. Recognises as risk/opportunity?
indicator by indicator L1|3. Policy commitment to act?
L2|4. Emissions targets?
Most energy companies implement the basic carbon L2|5. Disclosed Scope 1&2 emissions?
management practices. 94% now have a policy commitment L3|6. Board responsibility?
to act on climate change, for instance. Fewer take the more
L3|7. Quantitative emissions targets?
advanced steps. Only 9% ensure consistency between their
L3|8. Disclosed any Scope 3 emissions?
climate change policies and the positions taken by trade
L3|9. Had operational emissions verified?
associations of which they are a member, for instance.
L3|10. Support domestic and intl. mitigation?
We see this general pattern repeatedly, both within the
L3|11.Disclosed trade association involvement?
energy sector and across the wider TPI database.
L3|12. Process to manage climate risks?
The energy sector is at or above average on most L3|13. Disclosed use of product emissions?
Management Quality indicators, driven by electricity utilities,
L4|14. Long-term emissions targets
but dragged down by coal miners. Limited disclosure of Scope
L4|15. Incorporated climate change into exec. rem.?
3 emissions from use of sold products by coal miners and
L4|16. Climate risks/opportunities in strategy?
O&G companies (Q13) is of continued concern.
L4|17. Undertakes climate scenario planning?
L4|18. Discloses an internal price of carbon?
L4|19. Consistency between company and trade assocs.?13
Carbon Performance: alignment with 8; 7%
the Paris Agreement benchmarks 23; 18%
This year’s Carbon Performance assessment in energy covers 125 companies,
including electricity utilities with a significant generation business, O&G
producers (not distribution companies), and diversified miners with a coal
business (not pure play coal mining companies).
We find that 37% of companies are aligned with at least the Paris
Pledges/NDCs in 2050, with 18% aligned with the most ambitious Below 2°C 24; 19%
benchmark.
This is an improvement on last year, when only 28% of energy companies
were aligned with at least the Paris Pledges/NDCs and only 12% were aligned 70; 56%
with Below 2°C. Some of the improvement comes, however, from taking a
longer-term perspective by extending our analysis horizon from 2030 to
2050. In doing so, some of the same companies that are not aligned in 2030
become aligned by 2050.
Not aligned Paris Pledges Below 2 Degrees No Disclosure14 100%
Carbon Performance: sector 90%
5
breakdown 23 2
80%
Breaking the Carbon Performance data down by sector, alignment with the Paris
climate goals is strongest in the electricity sector, followed by the diversified
70%
mining companies with a coal business, with the least alignment in O&G.
The share of electricity utilities aligned with at least the Paris Pledges/NDCs has 60%
increased from just under 49% to 61%. The 23 utilities that are aligned with
17
Below 2°C in 2050 all have a net zero or absolute zero emissions target (see our 50% 44
sector focus on electricity below for further comments on this).
40%
Although alignment is weakest in O&G, this sector is witnessing rapid change,
with several European companies announcing new long-term emissions targets. 4
30%
Consequently the number of companies aligned with the Paris Pledges/NDCs has
risen from 1 to 5. Although no O&G producer is yet aligned with 2°C or Below 22
20%
2°C, the leading companies are getting closer. See our recent briefing paper on
Carbon Performance of European Integrated Oil and Gas Companies
10%
4 4
0%
Electricity Utilities Oil & Gas Diversified Mining
No Disclosure Not aligned Paris Pledges Below 2 Degrees15
Climate science dictates that the pathway
matters, not just the end point
Increases in global temperature depend on cumulative CO2
emissions. This means the path to net zero matters, not just
the end point (i.e. reaching net zero).
Above we looked at whether companies will be aligned by
the time 2050 arrives, or are already aligned with 2050
climate goals. But the transition matters and many
companies plan to back-load their efforts. If companies are
above the benchmarks now, then they need to be below
the benchmarks later in order to stay within a Below 2°C or
2°C carbon budget.
Investors need to be aware of this and look at companies’
whole transition pathways, which are available on TPI’s
online tool.2. Sector focus: coal mining
17

                                                                                  Companies’ Management Quality ratings may not always reflect their most up-to-date

     Management Quality level                                                     disclosures. TPI updates its assessments once a year.

      Level 0                     Level 1                     Level 2                                    Level 3                                      Level 4
      Unaware                     Awareness                   Building capacity                          Integrating into operational                 Strategic assessment
                                                                                                         decision making

                                                                                                                                                     6 Companies: 17%
                                                                                                        6 Companies: 17%                             Anglo American (Coal Mining)
                                                                                                                                                     BHP (Coal Mining)
                                                                                                        African Rainbow Minerals
                                                                                                                                                     Vale (Coal Mining)
                                                                                                        Banpu
                                                              7 companies: 20%                          Glencore (Coal Mining)
                                                                                                                                                     Exxaro Resources
                                                              China Shenhua Energy                      Eneos (Coal Mining)
                                  13 companies: 37%                                                                                                  Mitsubishi Corp
                                                              Coronado Global Resources                 South32 (Coal Mining)
                                                                                                                                                     Teck Resources
      3 companies: 9%             Adani Enterprises           Jastrzebska Spolka Weglowa                Sumitomo Corp
                                  ANTAM                       Mitsui & Co (Coal Mining)
      Adaro Energy                Astra International         Semirara Mining and Power
      Jardine Matheson Holdings   Bukit Asam                  Washington H. Soul Pattinson
      Shougang Fushan Resources   Bumi                        Whitehaven Coal
                                  China Coal
                                  Coal India
                                  Consol Energy
                                  DMCI Holdings
                                  Inner Mongolia Yitai Coal
                                  New Hope
                                  Nippon Coke & Engineering
                                  Yanzhou Coal Mining
18
Trends in
Management Quality 0 1 2 3 4
Coal mining companies average Management Quality score is just 2.0,
putting the average company in this sector at the point of “Building 2 2
8 2 5
capacity” (Level 2). Coal mining remains one of the worst performing
of all sectors in the TPI database and has not significantly improved its
1
average score since last year when it stood at 1.9.
We have trend data on 26 out of the 35 companies assessed. Of 3
those 26: 19 companies stay on the same level as last year, including
the 5 that had already reached Level 4 last year; 4 companies have
moved up at least one level; 3 companies have moved down from
Level 4 to Level 3.
3
Twelve companies have been added to the coal mining sector this
year, some of which have been previously assessed by TPI in other
sectors (e.g. Eneos). The average score of these twelve companies is
just 1.9, slightly dragging down the sector average.19 0% 10% 20% 30% 40% 50% 60% 70% 80% 90% 100%
L0|1. Acknowledge?
Management Quality: L1|2. Recognises as risk/opportunity?
indicator by indicator L1|3. Policy commitment to act?
L2|4. Emissions targets?
L2|5. Disclosed Scope 1&2 emissions?
As one of the worst performing TPI sectors,
L3|6. Board responsibility?
unsurprisingly coal mining companies fare worse than
L3|7. Quantitative emissions targets?
average on almost all of the Management Quality
L3|8. Disclosed any Scope 3 emissions?
indicators.
L3|9. Had operational emissions verified?
There is one exception: does the company ensure
L3|10. Support domestic and intl. mitigation?
consistency between its climate change policy and the
L3|11.Disclosed trade association involvement?
positions taken by trade associations of which it is a
member? (Q19) As a whole, very few TPI companies L3|12. Process to manage climate risks?
satisfy this indicator, but 11% of coal miners do. This is L3|13. Disclosed use of product emissions?
attributable to a small number of diversified mining L4|14. Long-term emissions targets
companies. In general, the diversified mining L4|15. Incorporated climate change into exec. rem.?
companies with coal businesses perform much better
L4|16. Climate risks/opportunities in strategy?
on Management Quality than the pure play coal
L4|17. Undertakes climate scenario planning?
miners.
L4|18. Discloses an internal price of carbon?
L4|19. Consistency between company and trade assocs.?20
Alignment of diversified miners with a coal business, scaled by
market cap.3. Sector focus: electricity utilities
22
Companies’ Management Quality ratings may not always reflect their most up-to-date
Management Quality level disclosures. TPI updates its assessments once a year.
Level 0 Level 1 Level 2 Level 3 Level 4
Unaware Awareness Building capacity Integrating into operational Strategic assessment
decision making
28 Companies: 41%
Terna
24 Companies: 35%
AES
Algonquin Power & Utilities Co
AGL Energy
Alliant Energy
American Electric Power
Ameren
8 Companies: 12% CEZ
CLP
CMS Energy
Chubu Electric Power
CenterPoint Energy Dominion Energy
8 Companies: 12% Edison International
Chugoku
Con Edison
E.ON
Evergy EDF
DTE Energy
Black Hills Corp Fortis EDP
0 Companies: 0% China Resources Power Hawaiian Electric
Duke Energy
Electric Power Development
Eversource Energy
CK Infrastructure NextEra Energy Emera Inc
Firstenergy
Kyushu Elec Power NTPC Endesa
Hydro One
PGE Vistra Energy Enel
Idacorp Inc
Power Assets Engie
Kansai Elec Power
Portland General Electric Entergy
KEPCO
Tenaga Nasional Exelon
Origin Energy
Fortum
PG&E
Iberdrola
PPL
National Grid
RWE
NRG Energy
Sempra Energy
Orsted
Southern Company
Pinnacle West Capital
Tohoku Elec Power
Public Service Enterprise Group
WEC Energy Group
Red Electrica
XCEL Energy
SSE
TEPCO
Uniper23
Trends in 0 1 2 3 4
Management Quality
6 5 14 21
Electricity utilities’ average Management Quality score is 3,
corresponding to Level 3, “integrating climate change into 1
operational decision making”. The electricity sector is 1
consistently the top or joint-top performing TPI sector on
3
Management Quality.
5
Of the 60 electricity utilities for which we have trend data, 46
remain at the same level as their last assessment, including
21 utilities that had already reached Level 4. A total of 10
companies have moved up at least one level and 4 have 1
moved down at least one level.
324 0% 10% 20% 30% 40% 50% 60% 70% 80% 90% 100%
Management Quality: L0|1. Acknowledge?
L1|2. Recognises as risk/opportunity?
indicator by indicator L1|3. Policy commitment to act?
L2|4. Emissions targets?
Electricity utilities perform above average on most individual L2|5. Disclosed Scope 1&2 emissions?
Management Quality indicators. All companies in this sector L3|6. Board responsibility?
acknowledge climate change as as a significant issue for the
L3|7. Quantitative emissions targets?
business (Q1) and nearly all of them have a policy commitment to
L3|8. Disclosed any Scope 3 emissions?
act on climate change (Q3).
L3|9. Had operational emissions verified?
Performance is particularly strong relative to other sectors on L3|10. Support domestic and intl. mitigation?
emissions reduction targets (i.e. Q4, which tests for the existence
L3|11.Disclosed trade association involvement?
of a target, even qualitative, Q7, which tests for quantitative
L3|12. Process to manage climate risks?
targets, and Q14, which tests for quantitative, long-term targets,
L3|13. Disclosed use of product emissions?
defined as at least 5 years in duration).
L4|14. Long-term emissions targets
The electricity sector is heavily regulated with regards to its
L4|15. Incorporated climate change into exec. rem.?
emissions in some regions (e.g. the EU) and this likely explains
strategy?
L4|16. Climate risks/opportunities in strategy?
some of the results we see.
L4|17. Undertakes climate scenario planning?
L4|18. Discloses an internal price of carbon?
L4|19. Consistency between company and
and trade
trade assocs.?
assocs.?25
2050
Carbon Performance: alignment with the 4; 6%
Paris Agreement benchmarks 23; 35%
We see comparatively strong and improving Carbon Performance in the electricity sector. 57% of 22; 33%
companies assessed are aligned with at least the Paris Pledges/NDCs in 2030 and that share rises
to 61% in 2050, as some utilities with mid-century net/absolute zero emissions targets come into
alignment. In comparison, 49% of companies were judged to be aligned with at least the Paris
Pledges/NDCs in 2030 when we assessed them last year. The shares of companies without suitable
17; 26%
disclosure or who are yet to align with any of the benchmarks have also decreased marginally.
2030
Two methodological issues are important to note when interpreting these results: 4; 6%
1. By 2050, there is no difference between what it takes to be aligned with 2°C and with Below 18; 27%
2°C in the electricity sector, which explains why we don’t see any utilities in the former
category;
24; 37%
2. By 2050, IEA benchmark scenario emissions from electricity in fact go negative. Strictly 2; 3%
speaking, absolute/net zero targets are not enough in the electricity sector and instead utilities
would need to target negative emissions. However, for now TPI considers absolute/net zero in
2050 as aligned with Below 2°C. 18; 27%
No Disclosure Not Aligned Paris Pledges
2 Degrees Below 2 Degrees26
Alignment of electricity utilities, scaled by market cap.27
Special feature on US
electric utilities
The US elections in November 2020 are a key decision
point on climate action, with the Democratic and
Republican parties offering very different visions of
the United States’ energy future and its contribution
to the Paris climate goals. In the run up, we have
singled out US electric utilities for analysis.28
Management Quality of US electric utilities
Level 0 Level 1 Level 2 Level 3 Level 4
Unaware Awareness Building capacity Integrating into operational Strategic assessment
decision making
US electric utilities average Management Quality score is 3,
which is the same as the sector’s worldwide average. There 9 Companies: 29%
are fewer Level 1 companies, but about the same proportion AES
on Levels 3 and 4. There are no Level 4* utilities in the US. 14 Companies: 45%
American Electric Power
Alliant Energy CMS Energy
Ameren Dominion Energy
6 Companies: 19% Con Edison Entergy
DTE Energy Exelon
CenterPoint Energy
2 Companies: 6% Duke Energy NRG Energy
Edison International
Eversource Energy Pinnacle West Capital
Black Hills Corp Evergy
0 Companies: 0% Firstenergy Public Service Enterprise Group
Portland General Electric Hawaiian Electric
Idacorp Inc
NextEra Energy
PG&E
Vistra Energy
PPL
Sempra Energy
Southern Company
WEC Energy Group
XCEL Energy
Companies’ Management Quality ratings may not always reflect their most up-to-date disclosures. TPI updates its assessments once a year.29 0% 10% 20% 30% 40% 50% 60% 70% 80% 90% 100%
US electric utilities: Management L0|1. Acknowledge?
Quality indicator by indicator L1|2. Recognises as risk/opportunity?
L1|3. Policy commitment to act?
L2|4. Emissions targets?
Here we disaggregate the Management Quality data for US electric L2|5. Disclosed Scope 1&2 emissions?
utilities by indicator and we compare the results with the average for all
L3|6. Board responsibility?
electric utilities in the TPI database (the black vertical marks on each bar).
L3|7. Quantitative emissions targets?
Outside the US, TPI covers 37 utilities, most of which are in Europe and
L3|8. Disclosed any Scope 3 emissions?
Asia (in roughly equal proportions).
L3|9. Had operational emissions verified?
Overall, US electric utilities underperform relative to the sector average on
L3|10. Support domestic and intl. mitigation?
most individual indicators, but they are at or above average on Q1-Q3,
L3|11.Disclosed trade association involvement?
which explains why their average Management Quality score matches the
L3|12. Process to manage climate risks?
global sector’s.
L3|13. Disclosed use of product emissions?
They underperform most notably on verifying operational emissions (Q9),
L4|14. Long-term emissions targets
although emissions are typically reported to the US Environmental
L4|15. Incorporated climate change into exec. rem.?
Protection Agency (EPA). In addition, no US utility can currently
L4|16. Climate risks/opportunities in strategy?
demonstrate it ensures consistency between its climate change policy and
the positions taken by trade associations of which it is a member (Q19). L4|17. Undertakes climate scenario planning?
L4|18. Discloses an internal price of carbon?
L4|19. Consistency between company and trade assocs.?30
2050
1; 3%
Carbon Performance of US 7; 23%
electric utilities 12; 39%
On Carbon Performance, we test the alignment of US
utilities against US-specific benchmarks, which we
obtain from the IEA’s regional projections in its Energy
Technology Perspectives report. 11; 35%
Our analysis reveals that many US utilities are 2030
targeting alignment with the country’s erstwhile Paris 1; 3%
Agreement pledge/NDC and its extrapolation by IEA 7; 23%
to 2050. In other words, most US utilities are aligned
with moderate decarbonisation. However, only 40%
are aligned with Below 2°C in 2050.
17; 55%
6; 19%
No Disclosure Not Aligned Paris Pledges Below 2 Degrees31
10 largest US electricity utilities by market cap against US
benchmarks
1.1
Paris Pledges (US)
2 Degrees (US)
Below 2 Degrees (US)
Emissions intensity of electricity generation (tCO2e/MWh)
0.9 American Electric Power
Dominion Energy
Duke Energy
Exelon
0.7 NextEra Energy
Southern Company
WEC Energy Group
XCEL Energy
0.5
Con Edison
Sempra Energy
0.3
0.1
2013 2018 2023 2028 2033 2038 2043 2048
-0.14. Sector focus:
oil & gas33
Companies’ Management Quality ratings may not always reflect their most up-to-date
Management Quality level disclosures. TPI updates its assessments once a year.
Level 0 Level 1 Level 2 Level 3 Level 4
Unaware Awareness Building capacity Integrating into operational Strategic assessment
decision making
16 companies: 26%
BP
21 companies: 34% Eni
Apache
19 companies: 31% Canadian Natural Resources
Equinor
Galp Energia
Cabot Oil & Gas Cenovus Energy Hess
5 companies: 8% Cheniere Energy Chevron Total
Formosa Petrochemical CNOOC China Petroleum & Chemical
0 companies: 0% Oil & Natural Gas Concho Resources Devon Energy Centrica
Petrochina Diamondback Energy Ecopetrol ConocoPhillips
Reliance Industries Enbridge Exxon Mobil INPEX CORPORATION
TATNEFT EOG Resources Gazprom Naturgy Energy
HollyFrontier Imperial Oil Occidental Petroleum
Lukoil Eneos (Oil & Gas) OMV
Marathon Oil Kinder Morgan Petrobras
Marathon Petroleum Neste Repsol
Noble Energy NovaTek Royal Dutch Shell
Oil Search PTT Sasol (Oil & Gas)
Ovintiv Rosneft Oil
Phillips 66 Santos
Pioneer Natural Resource SK Innovation
Saudi Aramco Suncor Energy
Targa Resources TC Energy
Valero Energy Woodside Petroleum34
Trends in 0 1 2 3 4
Management Quality
combined 4 14 14 11
Oil and gas companies’ average Management Quality score is 1
2.8, up from 2.7 in 2019 and 2.4 in 2018. Thus we are
witnessing slow but steady progress in the sector. 1
1
The 7 O&G distribution companies included in this report 3
average 2.9. Centrica and Naturgy Energy are on Level 4, Kinder
Morgan and TC Energy are on Level 3, and Enbridge, Cheniere
and Targa Resources are on Level 2.
We have trend data on 56 companies, of which 43 stay on the
1
same level as their last assessment, 6 companies have moved
1
up at least one level and 7 companies have moved down at
5
least one level.35 0% 10% 20% 30% 40% 50% 60% 70% 80% 90% 100%
Management Quality: L0|1. Acknowledge?
L1|2. Recognises as risk/opportunity?
indicator by indicator L1|3. Policy commitment to act?
L2|4. Emissions targets?
The O&G sector is close to the TPI all-company average on L2|5. Disclosed Scope 1&2 emissions?
Management Quality and accordingly O&G companies perform L3|6. Board responsibility?
better than average on some indicators and worse than average on L3|7. Quantitative emissions targets?
others.
L3|8. Disclosed any Scope 3 emissions?
Relatively strong performance on a cluster of indicators may reflect L3|9. Had operational emissions verified?
a growing recognition in the sector of the significant risks (and L3|10. Support domestic and intl. mitigation?
opportunities) presented by the low-carbon transition: Q2, explicitly L3|11.Disclosed trade association
association involvement?
involvement?
recognising climate change as a relevant risk and/or opportunity for
L3|12. Process to manage climate risks?
the business; Q6, nominating a board member or board committee
L3|13. Disclosed use of product emissions?
with explicit responsibility for climate change; Q17, undertaking
L4|14. Long-term emissions targets
climate scenario planning.
L4|15. Incorporated climate change into exec. rem.?
Disclosing emissions (Q5, Q8 and Q13), verification of those
L4|16. Climate risks/opportunities in strategy?
emissions (Q9) and emissions reduction targets (Q4, Q7 and Q14)
L4|17. Undertakes climate scenario planning?
remain weak points.
L4|18. Discloses an internal price of carbon?
L4|19. Consistency between company and trade assocs.?36
Carbon Performance: alignment with the Below 2 No
Paris
Paris Agreement benchmarks Pledges; 5;
9%
Degrees; 0;
0%
Disclosure;
4; 8%
We assess Carbon Performance for 53 O&G producers using our methodology that is based on
the emissions intensity of energy supply. This methodology is not applicable to O&G distribution
companies.
As we explained in last year’s report, aligning with the Paris Agreement goals is a major challenge
for the O&G sector and requires companies to address not only their operational emissions (e.g.
from methane flaring and refining), but also their downstream, Scope 3 emissions from use of
sold products.
Consequently the share of companies aligned with the benchmarks is very low overall. Five
companies are aligned with the Paris Pledges/NDCs, up from just 1 last year. However, a broad
sweep of the sector hides some of the progress being made by the leaders. In the last 6-12
months, a number of European companies have announced new, long-term emissions reduction
commitments, some of which bring the companies in question close to aligning with 2°C. This was
discussed in our recent briefing paper on Carbon Performance of European Integrated Oil and Gas
Companies (May 2020). Here we include new data. Not Aligned;
44; 83%
Non-disclosure in O&G has decreased by 50% since last year.37
Alignment of O&G producers, scaled by market cap.5. About TPI: further
information about the initiative
and methodology39
TPI strategic
relationships
The Grantham Research Institute on Climate Change and the
Environment, a research centre at the London School of
Economics and Political Science (LSE), is TPI’s academic partner. It
has developed the assessment framework, provides company
assessments, and hosts the online tool.
FTSE Russell is TPI’s data partner. FTSE Russell is a leading global
provider of benchmarking, analytics solutions and indices.
The Principles for Responsible Investment (PRI) manages and
provides supporter coordination to TPI. PRI is an international
network of investors implementing the six Principles for
Responsible Investment.40
TPI Governance
TPI Co-Chairs
TPI Steering Committee41
Our Supporters42
TPI design principles
Disclosure-based: Company assessments are based only on
publicly available information
Accessible and easy to use: Outputs are designed to be useful
to Asset Owners and Asset Managers, especially with limited
resources to assess climate change
Not seeking to add unnecessarily to the reporting burden:
Aligned with existing initiatives and disclosure frameworks,
such as CDP and TCFD
Corporate level: Pitched at a high level of aggregation43
Overview of the TPI
Tool
TPI’s company assessments are divided into 2 parts:
1. Management Quality covers companies’
management/governance of greenhouse gas emissions and the
risks and opportunities arising from the low-carbon transition;
2. Carbon Performance assessment involves quantitative
benchmarking of companies’ emissions pathways against the
international targets and national pledges made as part of the
2015 UN Paris Agreement, for example limiting global warming
to below 2°C.
Both of these assessments are based on company disclosures.44
Management Quality
Level 0 Level 1 Level 2 Level 3 Level 4
Unaware Awareness Building capacity Integrating into operational Strategic assessment
decision making
Company has set long-term quantitative
targets (>5 years) for reducing its GHG
TPI’s Management Quality framework is based on 19 indicators, each of emissions
which tests whether a company has implemented a particular carbon Company has nominated a board Company has incorporated climate change
management practice. These 19 indicators are used to map companies on member/committee with explicit
responsibility for oversight of the climate
performance into executive remuneration
to 5 levels/steps. The data are provided by FTSE Russell. See our latest change policy
Methodology and Indicators Report, version 3.0, for more detail. Company has set quantitative targets for Company has incorporated climate change
reducing its GHG emissions risks and opportunities in its strategy
Company has set GHG emission reduction Company reports on its Scope 3 GHG Company undertakes climate scenario
targets emissions planning
Company recognises climate change as a Company has published info. on its Company has had its operational GHG Company discloses an internal carbon
relevant risk/opportunity for the business operational GHG emissions emissions data verified price
Company does not recognise climate Company has a policy (or equivalent) Company supports domestic & Company ensures consistency between its
change as a significant issue for the commitment to action on climate change international efforts to mitigate climate climate change policy and position of
business change trade associations of which it is a member
Company discloses membership and
involvement in trade associations engaged
on climate
Company has a process to manage
climate-related risks
Company discloses Scope 3 GHG emissions
from use of sold products (selected sectors
only)45
Carbon Performance
TPI’s Carbon Performance assessment tests the alignment of
company targets with the UN Paris Agreement goals.*
We use 3 benchmark scenarios for each sector, which in the
Carbon Intensity
energy sector are:
1. Paris Pledges, consistent with emissions reductions
pledged by countries as part of the Paris Agreement (i.e.
NDCs; note these are insufficient to limit global warming to
2°C or below);
2. 2 Degrees, consistent with the overall aim of the Paris
Agreement, albeit at the low end of the range of ambition;
3. Below 2 Degrees, consistent with a more ambitious
interpretation of the Paris Agreement’s overall aim. Company A is not aligned with any of the benchmarks
Benchmarking is sector-specific and based on emissions intensity Company B is eventually aligned with the Paris Pledges, but neither 2C/ nor Below 2C
(e.g. tonnes of CO2 per MWh electricity generated). See TPI Company C is aligned with all Paris benchmarks, including Below 2C
website for further details. *We use the Sectoral Decarbonization approach (SDA), which was created by CDP, WWF & WRI in 2015
& is also used by the Science Based Targets Initiative.46
Reducing TPI’s Carbon Performance data to a single indicator of
alignment with the Paris Agreement
Our Carbon Performance data cover multiple years. How can they
be used to answer the simple question: is a company aligned with
the Paris goals?
To do this, we compare a company’s emissions intensity in the last
year for which we have data with the benchmarks at the end of the
horizon. For energy companies, we look out to 2050, so for
example:
• Company with a 2050 target – the company’s projected 2050
emissions intensity is compared with the benchmark emissions
intensities in 2050;
• Company with no target – the company’s historical emissions
intensity is compared with the benchmark emissions intensities
in 2050 (i.e. a comparison of where the company is now with
where it would need to be in 2050).47
Reflections on the benchmarks
TPI’s Below 2°C benchmark is based on the IEA’s B2DS scenario from its Energy Technology Perspectives report. For this TPI report, we use the 2017 edition of ETP. The 2020 edition has
just been published and the data will be released soon, enabling us to incorporate the new scenarios in future reports. Preliminary analysis indicates, however, that there is little
difference between the ETP editions’ energy sector emissions intensities, so our conclusions are not expected to change.
A question we are often asked is how our Below 2°C benchmark relates to the goal of limiting warming to 1.5°C. This is a complicated issue, because defining a 1.5°C scenario is affected
by a number of variables, including:
• The probability of keeping temperatures below 1.5°C (e.g. 50%, 66%). No 1.5°C scenario can guarantee keeping temperatures below that level, due to climate system uncertainties.
Some scenarios also allow temporary overshoot of 1.5°C, others not.
• Temperatures depend on cumulative CO2 emissions, resulting in a ‘carbon budget’ for 1.5°C. But this carbon budget does not just depend on emissions before 2050, it depends on
emissions after 2050 and higher emissions earlier could be offset by negative emissions later.
According to IEA, the B2DS scenario underpinning our Below 2°C benchmark has cumulative CO2 emissions of 750GtCO2 between 2015 and 2100. According to IPCC, the 1.5°C carbon
budget from 2015 to 2100 is 443GtCO2 (66% chance) or 503GtCO2 (50% chance), a range that is well below the IEA scenario. However, recently IEA has argued that if there are large
negative emissions after 2050, the IEA’s most ambitious scenarios could be 1.5°C compatible. In particular, IEA has argued that there is potential for more than 250GtCO 2 negative
emissions after 2050. This would bring B2DS cumulative emission down to c. 500GtCO 2. Overall, it is possible our Below 2°C is compatible with 1.5°C, but it is not a conservative scenario,
and it would presumably lead to temporary overshoot of 1.5°C.48
Disclaimer
1. Data and information published in this report and on the TPI website is intended principally for investor use 4. Subject to paragraph 3 above, none of the data or information on the website is permitted to be used in
but, before any such use, you should read the TPI website terms and conditions to ensure you are connection with the creation, development, exploitation, calculation, dissemination, distribution or
complying with some basic requirements which are designed to safeguard the TPI whilst allowing sensible publication of financial indices or analytics products or datasets (including any scoring, indicator, metric or
and open use of TPI data. References in these terms and conditions to “data” or “information” on the model relating to environmental, climate, carbon, sustainability or other similar considerations) or financial
website shall include the carbon performance data, the management quality indicators or scores, and all products (being exchange traded funds, mutual funds, undertakings collective investment in transferable
related information. securities (UCITS), collective investment schemes, separate managed accounts, listed futures and listed
options); and you are prohibited from using any data or information on the website in any of such ways and
2. By accessing the data and information published on this website, you acknowledge that you understand and
from permitting or purporting to permit any such use.
agree to these website terms and conditions. In particular, please read paragraphs 4 and 5 below which
details certain data use restrictions. 5. Notwithstanding any other provision of these website terms and conditions, none of the data or
information on the website may be reproduced or made available by you to any other person except that
3. The data and information provided by the TPI can be used by you in a variety of ways – such as to inform
you may reproduce an insubstantial amount of the data or information on the website for the uses
your investment research, your corporate engagement and proxy-voting, to analyse your portfolios and
permitted above.
publish the outcomes to demonstrate to your stakeholders your delivery of climate policy objectives and to
support the TPI in its initiative. However, you must make your own decisions on how to use TPI data as the 6. The data and information on the website may not be used in any way other than as permitted above. If you
TPI cannot guarantee the accuracy of any data made available, the data and information on the website is would like to use any such data or information in a manner that is not permitted above, you will need TPI’s
not intended to constitute or form the basis of any advice (investment, professional or otherwise), and the written permission. In this regard, please email all inquiries to tpi@unpri.org.
TPI does not accept any liability for any claim or loss arising from any use of, or reliance on, the data or
information. Furthermore, the TPI does not impose any obligations on supporting organisations to use TPI
data in any particular way. It is for individual organisations to determine the most appropriate ways in
which TPI can be helpful to their internal processes.You can also read