Enercom: The Oil and Gas Conference - August 16-18, 2021

Page created by Willie Shelton
 
CONTINUE READING
Enercom: The Oil and Gas Conference - August 16-18, 2021
Enercom: The Oil and
Gas Conference
August 16-18, 2021
Enercom: The Oil and Gas Conference - August 16-18, 2021
Preliminary Matters

      Various statements contained in this presentation, including those that express a belief, expectation or intention, as well as those that are not statements of historical fact, are forward-looking
      statements. These forward-looking statements may include projections and estimates concerning the timing and success of specific projects and our future revenues, income and capital spending.
      Our forward-looking statements are generally accompanied by words such as “estimate,” “project,” “predict,” “believe,” “expect,” “anticipate,” “potential,” “plan,” “goal,” “will” or other words that
      convey the uncertainty of future events or outcomes. The forward-looking statements in this presentation speak only as of the date of this presentation; we disclaim any obligation to update these
      statements unless required by law, and we caution you not to rely on them unduly. We have based these forward-looking statements on our current expectations and assumptions about future events.
      While our management considers these expectations and assumptions to be reasonable, they are inherently subject to significant business, economic, competitive, regulatory and other risks,
      contingencies and uncertainties, most of which are difficult to predict and many of which are beyond our control. These and other important factors, including those discussed under “Risk Factors”
      and “Management’s Discussion and Analysis of Financial Condition and Results of Operations” included in the Company’s filings with the Securities and Exchange Commission, including the
      Company’s Annual Report on Form 10-K, may cause our actual results, performance or achievements to differ materially from any future results, performance or achievements expressed or implied
      by these forward-looking statements. These risks, contingencies and uncertainties include, but are not limited to, the following:

      •   inability to predict the duration or magnitude of the effects of the COVID-19 pandemic on our business, operations, and financial condition and when or if worldwide oil demand will stabilize and
          begin to improve;
      •   decline in or substantial volatility of crude oil and natural gas commodity prices
      •   a sustained decrease in domestic spending by the oil and natural gas exploration and production industry;
      •   fluctuation of our operating results and volatility of our industry;
      •   inability to maintain or increase pricing of our contract drilling services, or early termination of any term contract for which early termination compensation is not paid;
      •   our backlog of term contracts declining rapidly;
      •   the loss of any of our customers, financial distress or management changes of potential customers or failure to obtain contract renewals and additional customer contracts for our drilling services;
      •   overcapacity and competition in our industry;
      •   an increase in interest rates and deterioration in the credit markets;
      •   our inability to comply with the financial and other covenants in debt agreements that we may enter into as a result of reduced revenues and financial performance;
      •   unanticipated costs, delays and other difficulties in executing our long-term growth strategy;
      •   the loss of key management personnel;
      •   new technology that may cause our drilling methods or equipment to become less competitive;
      •   labor costs or shortages of skilled workers;
      •   the loss of or interruption in operations of one or more key vendors;
      •   the effect of operating hazards and severe weather on our rigs, facilities, business, operations and financial results, and limitations on our insurance coverage;
      •   increased regulation of drilling in unconventional formations;
      •   the incurrence of significant costs and liabilities in the future resulting from our failure to comply with new or existing environmental regulations or an accidental release of hazardous substances
          into the environment; and
      •   the potential failure by us to establish and maintain effective internal control over financial reporting.

      All forward-looking statements are necessarily only estimates of future results, and there can be no assurance that actual results will not differ materially from expectations, and, therefore, you are
      cautioned not to place undue reliance on such statements. Any forward-looking statements are qualified in their entirety by reference to the factors discussed throughout this presentation and in the
      Company’s filings with the Securities and Exchange Commission, including the Company’s Annual Report on Form 10-K. Further, any forward-looking statement speaks only as of the date of this
      presentation, and we undertake no obligation to update any forward-looking statement to reflect events or circumstances after the date on which the statement is made or to reflect the occurrence of
      unanticipated events.

      Adjusted Net Income or Loss, EBITDA and adjusted EBITDA are supplemental non-GAAP financial measures that are used by management and external users of the Company’s financial statements,
      such as industry analysts, investors, lenders and rating agencies. The Company’s management believes adjusted Net Income or Loss, EBITDA and adjusted EBITDA are useful because such
      measures allow the Company and its stockholders to more effectively evaluate its operating performance and compare the results of its operations from period to period and against its peers without
      regard to its financing methods or capital structure. See non-GAAP financial measures at the end of this presentation for a full reconciliation of Net Income or Loss to adjusted Net Income or Loss,
      EBITDA and adjusted EBITDA.

                                                                                                                                                                                                        2
Enercom: The Oil and Gas Conference - August 16-18, 2021
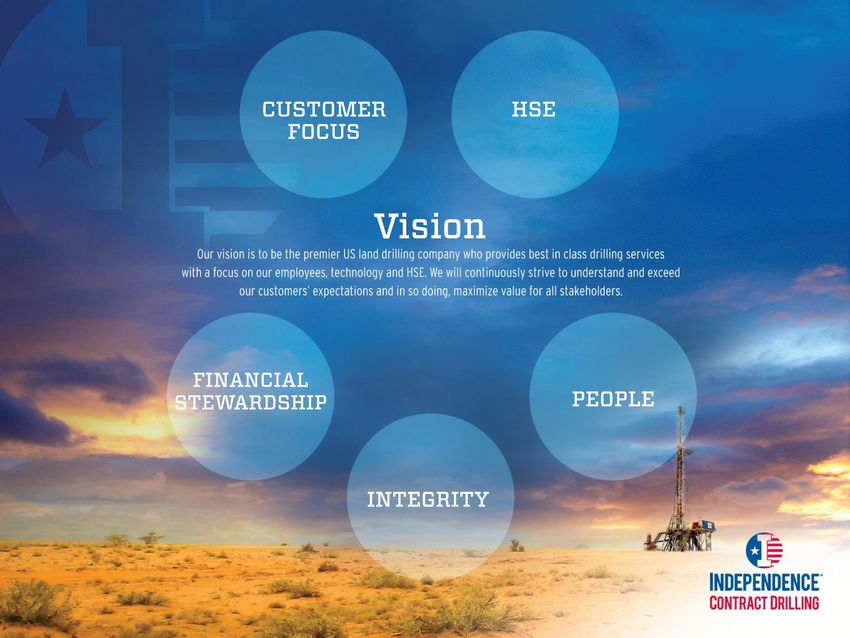
Highest Asset Quality
                                                 100% Super Spec -
                                                    Pad Optimal
                                                 Marketed Fleet with
                                                  Best Geographic
      Fleet 100% Dual-Fuel                             Focus
      Enabled / Electric Hi-                                                        Geographic Locations
         Line Capable:                                                             Focused on Most Prolific
        Substantial GHG                                                              Oil and Natural Gas
           Reduction /                                                               Producing Regions
           Elimination

                                              Land Drilling’s Only
Poised for Significant                     Publicly-Traded, Pure-Play,
                                           Pad-Optimal, Super-Spec,                         Customer Focused and
Free Cash Flow Yields
                                                  Growth Story                               Proven Operational
                                                                                                 Excellence

                         Market Share Gains
                         Driven By 300 Series                      Improving Dayrates &
                           Rigs and Overall                         Utilization Driven by
                         Market Consolidation                      Market Fundamentals

                                                                                                                   3
Enercom: The Oil and Gas Conference - August 16-18, 2021
Introduction: NYSE: ICD

  Sectors only publicly-traded, pure-play, pad-optimal, super-spec, drilling contractor
  focused solely on North America’s most attractive oil and natural gas basins
                            •   Marketed fleet comprised entirely of pad-optimal, super-spec rigs
    Best-in-Class Asset     •   Established presence in oil rich Permian and Eagle Ford plays
   Quality and Geographic   •   Leading presence in natural gas rich Haynesville and East TX regions
            Focus           •   Increasing market penetration of 300 Series rigs
                            •   All rigs software-optimization-capable

    High Quality Customer
                            • #1 ranked land contract driller for service and professionalism by Energy Point
      Base Supported by
                              Research past three years: 2019, 2020 and 2021
       Industry Leading
                            • Established relationships with publics and well-capitalized private operators
    Customer Service and    • Industry leading and scalable safety, maintenance and financial systems
          Operations

                            • Steadily increasing utilization and spot dayrates as market recovers from COVID-19
    Returns & Free Cash       impacts drives potential for significant free cash flow generation and yields
      Flow Generation       • Increasing market penetration of 300 Series rigs
                            • Scalable cost structure for organic growth / M&A opportunities

                            •   Marketed fleet 100% dual-fuel and hi-line power capable
                            •   Omni-directional walking reduces operational footprints and environmental impacts
         ESG Focus          •   Increasingly diverse workforce: over 25% from under-represented groups
                            •   Shareholder alignment: executive comp substantially at-risk/ performance based
                            •   Leading presence in natural-gas-rich Haynesville and East TX regions

                                                                                                                4
ICD Operations Strategically Focused on the Most Prolific Oil and
Natural Gas Producing Regions in the United States
14 “300” Series ShaleDriller Rigs(1)
◼         1,500 – 2,000 HP drawworks; 25K+ racking / 1M lb.
          hook with only modest capex

◼         Three pump / four engine capable; drilling
          optimization software capable                                                                                   Oklahoma
                                                                                                                                     Arkansas
◼         Targeting developing market niche for larger                                         New Mexico
          diameter casing strings and extreme laterals

◼         Dual-Fuel enabled / Hi-Line Electric Power Capable

◼         Hi-torque top drive                                                                                          Texas

17 “200” Series ShaleDriller Rigs                                                                                                      Louisiana

◼         1,500 HP drawworks; 20K+ racking / 750K lb. hook

◼         Three pump / four engine capable; drilling                                                 ICD owned or
          optimization software capable                                                              leased location

◼         Dual-Fuel / Hi-Line Electric Power Capable                                                 ICD Operating
                                                                                                     Area
1 “100” Series ShaleDriller Rig

◼         1,000 HP drawworks
                                                                                                    ICD CURRENT ACTIVE
◼         Three pump / four engine capable; drilling
          optimization software capable
                                                                                                  MARKETED FLEET: 24 RIGS
                                                                                                AVERAGE RIG AGE: 6.55 YEARS(2)
◼         Dual-Fuel enabled / Hi-Line Electric Power Capable
    (1)    Includes two 200 Series rigs scheduled for conversion (aggregate capex < $1M)
    (2)    Based upon date of first well spud following rig construction or material upgrade                                                       5
Maximizing Returns By Strategically Marketing ICD Fleet Across
Target Markets

                                           Oklahoma

                                                                 Arkansas
            New Mexico

                                   Texas

                                                                     Louisiana

Permian – Delaware
      Basin
 300 Series Target
      Market                                                                     Haynesville/ETX
                                                                                 300 Series Target
               Permian – Midland                                                      Market
                                                       Eagle Ford/STX
                    Basin
                                                      200 Series Target
               200 Series Target
                                                           Market
                    Market

                                                                                               6
Geographic Mix And Customer Relationships

       Current ICD Operating Rigs By Basin                                            Strong Customer Base
                                                                                        Recent ICD Customers

           STX/ Eagle
             Ford
               3

                                                                       Haynesville/
 Permian                                                                  ETX
                                                                                                   1
    8                                                                      4

                         Permian
                            7                                                             2

 (1)   Occidental Petroleum Corporation via Anadarko Petroleum acquisition
 (2)   ConocoPhillips via Concho Reources acqusition
                                                                                                               7
Since Beginning of Pandemic Recovery ICD Fleet Utilization Growth
Substantially Outperforming Overall Market

                      CUMULATIVE PERCENTAGE INCREASE IN RIG COUNT SINCE
                                      PANDEMIC TROUGH
  400%

  350%

  300%

  250%

  200%

  150%

  100%

   50%

     0%
                      Q3'20              Q4'20         Q1'21           Q2'21          Current

                          US Land Rig Count % Growth      ICD Operating Rig Count % Growth

  Source: BHI Rig Count                                                                         8
300 Series Rigs Leading Acceleration in Fleet Utilization

             ICD Total Working Rigs                                                 ICD 300 Series Rigs
25                                                                        •   Rigs meeting these specs command
                                                                              highest dayrates when matched with
                                                                              customers requiring such specification

20                                                                            -   14 total 300 Series rigs in ICD fleet. Expect
                                                                                  these rigs to represent majority of future rig
                                                                                  reactivations and growing % of ICD’s overall
                                                             ICD Total
                                                                                  operating fleet
                                                             300 Series
15                                                             Fleet
                                                                              -   Target operating fleet composition: 50% 300
                                                                                  Series / 50% 200 Series

                                                                          •   Target customers requiring larger racking
10                                                                            capacity, hookload, high-torque drill pipe:
                                                                              predominantly Delaware Basin and
                                                                              Haynesville

 5                                                                        •   Minimal excess capacity for rigs meeting
                                                                              300 Series specification

                                                                          •   Acquired by ICD in 4Q’18 SideWinder
 0                                                                            Merger – current recovery represents first
     Precovid   3Q'21   4Q'21      1Q'21   2Q'21   Current
      (1Q'20)                                                                 opportunity for ICD to market and place
     Working ICD 300 Series Rigs    Total ICD Working Rigs                    these rigs with customers in an improving
                                                                              rig count environment

                                                                                                                            9
ICD Performance Meeting and Exceeding Customer Expectations

                           ICD has been the #1 ranked U.S. Land
                           Driller for Service and Professionalism
                           for the past three years by Energy
                           Point Research’s independent
                           customer survey

                           Independence Contract Drilling was
                           one of only three land drillers
                           recognized in 2021 by Energy Point
                           Research in the Overall Total
                           Satisfaction category of its customer
                           survey.

                                                                     10
Defining a Pad-Optimal Super-Spec Rig

  Omni-Directional Walking

  1500 HP Drawworks

  High-Pressure Mud Systems (7500 psi)

  Fast Moving

  AC Programmable

  Fleet must have flexibility to provide
  differing equipment packages to meet                                      Total U.S. Pad-Optimal Super-Spec Supply: ̴ 620
  particular requirements of E&Ps’                                                              Rigs(1)
  drilling programs
  •       Three pump / four engine: 100% of ICD                                     170 Upgradeable
                                                                                         Rigs(2)
          marketed fleet
  •       High-Torque top drive: 50% of ICD marketed
          fleet
  •       Enhanced racking (25K ft) and hookload (1M lb)
          capable: 50% of ICD marketed fleet                                                                                                                450 Pad
                                                                                                                                                          Optimal Rigs
  •       Drilling optimization software capable: 100% of
          marketed fleet
  •       Dual-fuel / Electric Hi-line capable : 100% of
          marketed fleet

      (1) Source: Enverus and Company estimates. Includes AC, 1500HP+, 750000lb+ Hookload. Excludes rigs not operating since 2018 and rigs owned by non-operating entities
      (2) 1500HP AC Rigs with skidding systems upgradeable to omnidirectional walking. Capex estimated at $5M+ per rig.
                                                                                                                                                                             11
Drivers for Expected Improvements in Pad-Optimal Utilization / Dayrates

•   Accelerating rig count with improving fundamentals

•   Rapidly normalizing demand for oil

•   Constructive U.S. natural gas supply / demand fundamentals

•   Rapidly decreasing drilled-but-uncompleted (DUC) inventories

•   Pad Optimal market share consolidating within few players with ICD
    utilization growth outpacing overall market

•   U.S. land pad optimal, super-spec fleet approaching 80% utilization

                                                                      12
U.S. Land Rig Count has Trailed Commodity Price Recovery but is
Expected to Accelerate Quickly

                                     U.S. Average Land Rig Count vs WTI
 1,200                                                                                                                                                      80

                                                                                                                                                            70
 1,000                                                                                                                                                           Current WTI Price(1)

                                                                                                                                                            60

   800
                                                                                                                                                            50

                                                                                                                                                                   2022 Average
   600                                                                                                                                                      40     U.S. Land Rig
                                                                                                                                                                  Count Estimates
                                                                                                                                                                    Avg: 548(2)
                                                                                                                                                            30
   400

                                                                                                                                                            20

   200
                                                                                                                                                            10

     0                                                                                                                                                      0
           Q1'17

                   Q2'17

                           Q3'17

                                   Q4'17

                                           Q1'18

                                                   Q2'18

                                                           Q3'18

                                                                   Q4'18

                                                                           Q1'19

                                                                                   Q2'19

                                                                                           Q3'19

                                                                                                    Q4'19

                                                                                                            Q1'20

                                                                                                                    Q2'20

                                                                                                                            Q3'20

                                                                                                                                    Q4'20

                                                                                                                                            Q1'21

                                                                                                                                                    Q2'21
                                           Avg US Land Rig Count                                   Avg WTI Price

Source:Baker Hughes, EIA
(1) As of August 10, 2021                                                                                                                                                       13
(2) Average Estimates per JP Morgan Morgan Stanley, Wells Fargo, Evercore, Spears, Rystadt, Simmons
Rapidly Normalizing Demand for Oil

                         Quarterly Worldwide Oil Demand as a % of 2019 Demand

                                                                                                       Demand expected to reach
                                                                                                         2019 levels by Q3’22
                                   Trough
                                  demand:
 100%                          (17%) vs 2019
                               daily average
  98%

  96%

  94%

  92%

  90%

  88%

  86%

  84%

  82%

  80%
            2019       Q1'20       Q2'20       Q3'20   Q4'20   Q1'21   Q2'21   Q3'21   Q4'21   Q1'22    Q2'22    Q3'22    Q4'22

 Source: EIA Short-Term Energy Outlook                                                                                            14
Decreasing DUC Inventories Should Drive Incremental Drilling Activity

                              U.S. Drilled-But-Uncompleted Well (DUC) Inventory Compared to
                                                 Completed Wells Over Time
                         10,000

                                                                                                                                                                                                                                                                                                                                                                                                                            2,000

                          9,000                                                                                                                                                                                                                                                                                                                                                                                             1,800

                                                                                                                                                                                                                                                                                                                                                                                                                            1,600
       DUC Inventories

                                                                                                                                                                                                                                                                                                                                                                                                                                    Completed Wells
                          8,000
                                                                                                                                                                                                                                                                                                                                                                                                                            1,400

                          7,000                                                                                                                                                                                                                                                                                                                                                                                             1,200

                                                                                                                                                                                                                                                                                                                                                                                                                            1,000

                          6,000
                                                                                                                                                                                                                                                                                                                                                                                                                            800

                                                                                                                                                                                                                                                                                                                                                                                                                            600
                          5,000
                                                                                                                                                                                                                                                                                                                                                                                                                            400

                          4,000                                                                                                                                                                                                                                                                                                                                                                                             200

                                                                                                                                                                                                                                                                                                                                                                               Feb-21
                                                                                                                                                                                                                                                                                                                                                                                        Mar-21
                                           Feb-18
                                                    Mar-18

                                                                                                                                                       Feb-19
                                                                                                                                                                Mar-19

                                                                                                                                                                                                                                                                   Feb-20
                                                                                                                                                                                                                                                                            Mar-20
                                  Jan-18

                                                                      May-18
                                                                               Jun-18

                                                                                                                                              Jan-19

                                                                                                                                                                                  May-19
                                                                                                                                                                                           Jun-19

                                                                                                                                                                                                                                                          Jan-20

                                                                                                                                                                                                                                                                                              May-20
                                                                                                                                                                                                                                                                                                       Jun-20

                                                                                                                                                                                                                                                                                                                                                                      Jan-21

                                                                                                                                                                                                                                                                                                                                                                                                          May-21
                                                                                                                                                                                                                                                                                                                                                                                                                   Jun-21
                                                             Apr-18

                                                                                                                   Oct-18

                                                                                                                                                                         Apr-19

                                                                                                                                                                                                                               Oct-19

                                                                                                                                                                                                                                                                                     Apr-20

                                                                                                                                                                                                                                                                                                                                           Oct-20

                                                                                                                                                                                                                                                                                                                                                                                                 Apr-21
                                                                                        Jul-18

                                                                                                                            Nov-18
                                                                                                                                     Dec-18
                                                                                                 Aug-18
                                                                                                          Sep-18

                                                                                                                                                                                                    Jul-19

                                                                                                                                                                                                                                        Nov-19
                                                                                                                                                                                                                                                 Dec-19
                                                                                                                                                                                                             Aug-19
                                                                                                                                                                                                                      Sep-19

                                                                                                                                                                                                                                                                                                                Jul-20

                                                                                                                                                                                                                                                                                                                                                    Nov-20
                                                                                                                                                                                                                                                                                                                                                             Dec-20
                                                                                                                                                                                                                                                                                                                         Aug-20
                                                                                                                                                                                                                                                                                                                                  Sep-20
                                                                  Duc Inventory                                                                                               Completed Wells (Spuds, Completions, DUCs)

  Source: EIA                                                                                                                                                                                                                                                                                                                                                                                                                                         15
Consolidating Pad Optimal Super-Spec Market

                 2018                                                                                                           2021
   Total Industry Operating Rigs in                                                                               Total Industry Operating Rigs in
 ICD Primary Target Mkts: TX, NM, LA                                                                           ICD Primary Target Mkts: TX, NM, LA

                  12%                                                                                                            10%
                                                                                                                    ICD                 24%
                                              34%

               54%                                                                                                                66%

                                                                     Legacy Rigs(1)
                                                                     Pad Optimal: Top Public Contractors(2)
                                                                     Pad Optimal: Other Contractors

 (1) SCR, Mechanical and AC below 1500hp
 (2): HP, PTEN, NBR, PDS, ESI, ICD; includes PTEN planned acquisition of Pioneer Energy Services; Includes upgradeable AC rigs                16
 Source: Enverus as of 6/30/18 and 8/4/21
Total U.S. Pad Optimal Fleet Utilization Approaching 80% in an
Improving Market Should Drive Incremental Dayrate Increases

     500
                                                                                                                                                                     Drivers for increasing rig count
     450
                                                                                                                                                                     and improving U.S. pad-optimal
                                                                                                    Estimated Pad                                                    super-spec fleet utilization and
                                                                                                   Optimal Supply(1)                                                 dayrates include:
     400

                                                                                                                                                                     •   Strong oil and natural gas
     350                                                                                                                                                                 commodity price environment
                        80% Utilization
                        Estimated Pad
     300                 Optimal Fleet                                                                                                                               •   Substantially declining DUC
                                                                                                                                                                         inventories
     250
                                                                                                                                                                     •   2022 E&P Capex Budgets reset
                                                                                                                                                                         higher based upon current
     200
                                                 Pad Optimal
                                                                                                                                                                         commodity price environment
                                                  Operating
     150                                          Rigs: U.S.                                                                                                         •   Increasing size and complexity of
                                                   Land (2)
                                                                                                                                                                         well pads and depth and length of
     100                                                                                                                                                                 well laterals

       50                                                                                                                                                            •   Increasing rig reactivation costs
                                                                                                                                                                         (minimal idle pad optimal – super-
                                                                                                                                                                         spec rigs that have not been
        0   1   2   3    4   5   6   7   8   9   10   11   12   13   14   15   16   17   18   19    20   21   22   23   24   25   26   27   28   29   30   31   32

                                                                                                                                                                         stacked less than 18 months)
       12/31/18                                                                                                                                            8/1/21
  (1)   AC, walking, 1500HP+, 750,000lb hookload +, 3 pumps (7500psi) /4 engines; excludes rigs stacked as of FYE 2018, skidding rigs and rigs held by non-operating entities
  (2)8/16/2021
        Source: Enverus and Company estimates                                                                                                                                                          17
ESG and Sustainability Focused

                                    • 100% of ICD marketed rigs are dual-fuel enabled and high-line capable, permitting
                                      substantial reduction and elimination of GHG emissions at the wellsite from rig
                                      operations
          Environment               • 100% of ICD rigs utilize omni-directional walking systems that enable large-scale pad
  ICD operations substantially        operations which substantially reduces environmental footprints at the wellsite
  reduce GHG emissions and          • 100% of ICD rigs utilize energy-efficient LED lighting and/or crown lighting which
 environmental footprints at the      substantially reduces energy use and “dark sky” environmental impacts
           wellsite                 • ICD is a leading provider of contract drilling services in the natural gas producing regions
                                      located in ETX/Haynesville areas which are expected to become increasingly relevant
                                      as energy transition efforts continue to develop and accelerate

                                    • ICD utilizes leading safety management and training systems. 100% of ICD employees
                Social                completed social, ethics and compliance training in 2020
ICD believes our people are our     • ICD is committed to a culture of diversity and inclusion - over 25% of ICD’s workforce is
      greatest resource and           currently comprised of historically underrepresented groups(1)
continuously focuses on creating    • ICD provides industry leading health and welfare benefits focused on employee well-
a culture where employee safety,      being
   opportunity, well-being and
                                    • ICD actively participates in community outreach programs in regions where we operate
    development is prioritized

                                    • Board level oversight of ESG goal setting, performance and outreach
          Governance                • 100% of ICD 2021 Executive LTIP compensation substantially at-risk and performance-
      ICD’s Board prioritizes         based, and thus closely aligned with shareholder interests
 shareholder alignment and ESG      • Executive compensation structures include safety, environmental and other ESG goals
     initiatives that benefit all     and metrics
stakeholders and the environment

 (1) As of Aug 1, 2021
                                                                                                                           18
ICD ShaleDriller Rigs Substantially Reduce and Eliminate GHG
Emissions at the Wellsite

   Utilizing natural gas rather      Similar to an electric car,      In 2019, ICD converted all of
   than diesel substantially         utilizing the electric grid to   its rigs from fluorescent
   reduces GHG emissions.            power a rig’s engines            lighting to LED lighting and
   ICD customers routinely use       substantially eliminates         is in process of converting
   field natural gas to power        GHG emissions at the             all of its rigs from traditional
   our rigs, providing even          wellsite. All ICD rigs are       lighting to crown lighting
   more significant positive         capable of running on Hi-        systems. LED and crown
   impacts on the environment.       Line Electric Power. ICD         lighting systems
   The first rig ICD built in 2012   began operating rigs on Hi-      substantially reduce energy
   was equipped with Dual-           Line Electric power in 2019      use and eliminate light
   Fuel engines and today            and continually markets this     pollution, in particular in
   100% of ICD’s marketed            option to its customers          environmentally sensitive
   fleet is equipped with Dual-      where operational                areas where “dark sky”
   Fuel capabilities.                infrastructure permits           environmental issues exist.

       Dual Fuel                        Hi-Line Electric                  LED/CROWN
       Equipped                         Power Capable                      LIGHTING
   100% of ICD’s Rigs                 100% of ICD’s Rigs               100% of ICD’s Rigs

                                                                                                         19
Drivers Towards Returns / Free Cash Flow Through Oil and Gas Cycle

                                             • Since pandemic trough in Aug ‘20, ICD rig count has increased 400% compared to
                                               overall rig count increase of 100%(1).
           Improving Fleet                   • ICD rig count poised to increase with further increases in overall US rig count
             Utilization                       weighted to ICD target markets and pad optimal / super spec rigs
                                             • ICD expects continued market penetration and increased utilization of its 300
                                               Series rigs
                                             • In response to post-pandemic recovery, spot dayrates are steadily rising
                                             • Increasing 300 Series market penetration expected to drive sequential dayrate
                                               improvements
        Increasing Dayrate                   • Short-term contract structures allow ICD to steadily reprice contracts into an
            Momentum                           improving dayrate environment, driving sequential improvements in revenue-per-
                                               day statistics
                                             • U.S. pad-optimal fleet utilization expected to approach 80% with continuing
                                               improvements in U.S. rig count during the remainder of 2021 and during 2022
                                             • Costs to operate a rig do not fluctuate meaningfully with increases in dayrates -
                                               dayrate improvements fall directly to bottom line driving incremental margins and
    Scalable Cost Structure
                                               cash flows
      Drives Substantial
                                             • Increasing rig utilization drives operating efficiencies expected to result in steady
    Improvements in Cash                       improvements in cost-per-day metrics
             Flows                           • Scalable SG&A cost structure: minimal increases in SG&A as operating fleet and
                                               revenues increase as COVID-19 pandemic recovery continues

 (1) Baker Hughes as of 8.14.20 and 8.6.21                                                                                             20
ICD Margins Already Expanding in Market Recovery

                                                                                                         In a continuing market recovery and
                                                                                                         improving rig count environment,
$22,000                                                                                                  the following factors are expected
                                                                                                         to positively impact ICD revenues,
                                                                                                         costs, and margin per day
$20,000                                                                                                  compared to Pre-COVID periods:

                                                                                                         •   300 Series rig pricing and
$18,000
                                                                                                             differentiation

                                                                                                         •   Efficiency improvements made in
$16,000
                                                                                                             2018 and 2019 following
                                                                                               Margin        Sidewinder Merger(1) and in
                                                                                               Per Day
$14,000
                                                                                                             response to COVID expected to be
                                                                                                             fully realized and drive additional
                                                                                                             cost savings
$12,000
                                                                                                         •
               4Q'18

                            FYE'19

                                        FYE'20

                                                     1Q'21

                                                                 2Q'21

                                                                              3Q'21 Forecast

                                                                                                             Cost savings from economies of
                                                                                                             scale

                                                                                                         •   Current short term contract
                                                                                                             structures permit steady repricing
                       Revenue Per Day                 Cost Per Day                                          of contracts into an improving
                                                                                                             market

     (1)   Sidewinder Merger closed 10/1/2018
     (2)   Guide: Represents Company forecasts provided on 2Q’21 Earnings Conference Call held 8/4/21
                                                                                                                                              21
Closing

   Improving and                           Expanding 300 Series
                       100% Super-Spec      Market Penetration
 Constructive Market
                       Pad Optimal Fleet     and Overall Fleet
   Fundamentals
                                                Utilization

 100% Fleet Carbon
                       Expanding Margins
 Reducing Enabled

                                               Free
                                            Cash Flow
                                           Growth/Yields

                                                            22
23
Corporate Snapshot

                              Capitalization(1)                                                                   Financial Liquidity
                               ($ millions, except share price)                                                              $ millions

     Share Price as of 8/12/21                                           $3.18                                                                June 30, 2021
     Shares Outstanding                                                       7.2            Cash                                                       $6.0
         Equity Value                                                    $22.9               Undrawn Revolver
                                                                                             Capacity                                                   11.3
     Term Loan                                                           132.8
                                                                                             Undrawn
     Revolver Outstanding                                                         -          Committed
                                                                                             Accordion                                                  15.0
     PPP Loan          Outstanding(2)                                       10.0
                                                                                             Undrawn Equity
     Capital Leases                                                           6.8            Line of Credit                                               3.1

         Total Debt                                                    $149.6                Total Liquidity                                         $35.4
                                                                                                 $133 million term loan                        Revolving line of credit
     Cash                                                                     6.0            •    Matures October 2023                    •   $40M total capacity
                                                                                             •    No amortization                         •   Borrowing base tied to eligible
                                                                                             •    Additional committed $15                    accounts receivable – as
         Net Debt                                                      $143.6                     million delayed-draw                        incremental rigs reactivate,
                                                                                                  accordion                                   borrowing base increases
                                                                                             •    Minimal financial                       •   Matures October 2023
     Enterprise Value                                                  $166.5                     covenants                               •   Minimal financial covenants
                                                                                             •    Pre-payable at any time

                                                                                                        PPP Loan
                                                                                             •    Forgiveness application
                                                                                                  filed 2Q’21

 ¹   Financial data other than share price as of 6/30/21. Shares outstanding as of 8/1/21.
 ²   PPP applicaton for forgiveness filed 2Q’21                                                                                                                           24
Consolidated Balance Sheet

                             25
Consolidated Statement of Operations

                                       26
Non-GAAP Financial Measures

 Adjusted net income and loss, EBITDA and adjusted EBITDA are supplemental non-GAAP financial measure that are used by
 management and external users of our financial statements, such as industry analysts, investors, lenders and rating
 agencies. In addition, adjusted EBITDA is consistent with how EBITDA is calculated under our revolving credit facility for
 purposes of determining our compliance with various financial covenants. We define “EBITDA” as earnings (or loss) before
 interest, taxes, depreciation, and amortization, and we define “adjusted EBITDA” as EBITDA before stock-based
 compensation, non-cash asset impairments, gains or losses on disposition of assets, and other non-recurring items added
 back to, or subtracted from, net income for purposes of calculating EBITDA under our revolving credit facility. Neither
 adjusted net income or loss, EBITDA or adjusted EBITDA is a measure of net income as determined by U.S. generally
 accepted accounting principles (“GAAP”).

 Management believes adjusted net income and loss, EBITDA and adjusted EBITDA are useful because they allow our
 stockholders to more effectively evaluate our operating performance and compliance with various financial covenants under
 our revolving credit facility and compare the results of our operations from period to period and against our peers without
 regard to our financing methods or capital structure or non-recurring, non-cash transactions. We exclude the items listed
 above from net income (loss) in calculating adjusted net loss, EBITDA and adjusted EBITDA because these amounts can vary
 substantially from company to company within our industry depending upon accounting methods and book values of assets,
 capital structures and the method by which the assets were acquired. None of adjusted net loss, EBITDA or adjusted EBITDA
 should be considered an alternative to, or more meaningful than, net income (loss), the most closely comparable financial
 measure calculated in accordance with GAAP or as an indicator of our operating performance or liquidity. Certain items
 excluded from adjusted net loss, EBITDA and adjusted EBITDA are significant components in understanding and assessing a
 company’s financial performance, such as a company’s return of assets, cost of capital and tax structure. Our presentation of
 adjusted net loss, EBITDA and adjusted EBITDA should not be construed as an inference that our results will be unaffected
 by unusual or non-recurring items. Our computations of adjusted net income (loss), EBITDA and adjusted EBITDA may not
 be comparable to other similarly titled measures of other companies.

 The table on the following page present a reconciliation of net loss to adjusted net income (loss), EBITDA and adjusted
 EBITDA.

                                                                                                                           27
Non-GAAP Financial Measures

 Reconciliation of Net Loss to Adjusted Net Income (Loss):

 Reconciliation of Net Loss to EBITDA and Adjusted EBITDA:

             See footnote explanations on following page.

                                                             28
Non-GAAP Financial Measures

                              29
Non-GAAP Financial Measures

    See footnote explanations on following page.

                                                   30
Non-GAAP Financial Measures

                              31
32
You can also read