Establishing percentiles for blood pressure based on absolute height for children and adolescents
←
→
Page content transcription
If your browser does not render page correctly, please read the page content below
Cossio-Bolaños et al. BMC Pediatrics   (2021) 21:26
https://doi.org/10.1186/s12887-020-02489-9

 RESEARCH ARTICLE                                                                                                                                      Open Access

Establishing percentiles for blood pressure
based on absolute height for children and
adolescents
Marco Cossio-Bolaños1, Rubén Vidal-Espinoza2, Felipe Castelli Correia de Campos3, José Sulla-Torres4,
Wilbert Cossio-Bolaños5, Cynthia Lee Andruske6, Camilo Urra Albornoz7 and Rossana Gómez Campos1*

  Abstract
  Background: Evaluating blood pressure (BP) is one element for diagnosing and preventing disease in student
  populations. The objectives of this research were to (a) identify the range of height for measuring BP adjusted for
  student populations and (b) propose percentiles for evaluating BP based on height.
  Methods: A cross-sectional study was carried out with 3,013 students. Weight, height, and diastolic (DBP) and
  systolic (SBP) blood pressure were evaluated. Body Mass Index (BMI) was calculated. Height ranges of 5 and 10 cm
  were generated.
  Results: R2 values for height ranges of 5 cm consisted of [normotensive: DBP (R2 = 10 to 13%) and SBP (R2 = 14 to
  20%), and for hypertensive: DBP (R2 = 0.07 to 15%) and for SBP (R2 = 29 to 32%)]. For height ranges of 10 cm, values
  included: [normotensive: DBP (R2 = 10 to 15%), and SBP (R2 = 15 to 21%) and for hypertensive: DBP (R2 = 0.07 to
  16%) and SBP (R2 = 29 to 35%)]. For 5 cm height ranges, diferences occurred between both sexes for DBP (in 5
  height ranges from 123 to 148 cm and 158 to 168 cm) and for the SBP (in 6 height ranges from 128 to 148 cm and
  from 158 to 168 cm). In the 10 cm categories, diferences appeared in DBP (from 138 to 148 cm) and in the SBP
  (from 158 to 168 cm).
  Conclusions: Height is a determinant for evaluating blood pressure, and height ranges of 10 cm are more suitable
  for children and adolescents. The proposed percentiles based on height ranges allowed assessment of the DBP and
  SBP suggest their use in epidemiological and educational contexts.
  Keywords: Blood pressure, Percentiles, Height, Children, Adolescentes

Background                                                                                examination, but also for prevention in medical exami-
Evaluation of blood pressure (BP) and the prevention of                                   nations [3].
hypertension in children and adolescents has become a                                       Identifying children with high blood pressure is diffi-
priority worldwide [1]. Thus, until a few years ago, their                                cult to establish. This is especially the case since deter-
inclusion in clinical practice during physical examina-                                   mining factors exist, such as age, sex, ethnicity, specific
tions was unusual [2]. Actually, it is widely known that                                  racial height groups [4, 5], socioeconomic conditions,
evaluating BP in children and adolescent populations                                      and lifestyle [6], among other factors.
was an important component, not only for the pediatric                                      In this sense, a number of simple and easy to use tools
                                                                                          have emerged in clinical practice for detecting high BP
* Correspondence: rossaunicamp@gmail.com                                                  in children and adolescents [7]. Generally, these are
1
 Universidad Católica del Maule, Av San Miguel 3605, Talca, Chile                         based fundamentally on percentile tables [8].
Full list of author information is available at the end of the article

                                           © The Author(s). 2021 Open Access This article is licensed under a Creative Commons Attribution 4.0 International License,
                                           which permits use, sharing, adaptation, distribution and reproduction in any medium or format, as long as you give
                                           appropriate credit to the original author(s) and the source, provide a link to the Creative Commons licence, and indicate if
                                           changes were made. The images or other third party material in this article are included in the article's Creative Commons
                                           licence, unless indicated otherwise in a credit line to the material. If material is not included in the article's Creative Commons
                                           licence and your intended use is not permitted by statutory regulation or exceeds the permitted use, you will need to obtain
                                           permission directly from the copyright holder. To view a copy of this licence, visit http://creativecommons.org/licenses/by/4.0/.
                                           The Creative Commons Public Domain Dedication waiver (http://creativecommons.org/publicdomain/zero/1.0/) applies to the
                                           data made available in this article, unless otherwise stated in a credit line to the data.
Cossio-Bolaños et al. BMC Pediatrics (2021) 21:26 Page 2 of 7
In fact, in their studies, some researchers have pro- completing the anthropometric examinations (weight
posed references for diverse regions of the world. Some and/or height).
are based on the function of chronological age [1, 9] and
others by height [2, 3, 10]. Many of these are cumber- Procedures
some and impractical for daily use. In addition, some Data collection took place from March to August 2017.
even incorporate a variable other than age in the presen- All evaluations were carried out in specified locations at
tation of their standards [11]. This makes it difficult to each school (Department of Physical Education) during
quickly detect high BP in children and adolescents. classes held from 8:00 a.m. to 12:00 noon, Monday to
Therefore, in the presence of a variety of methods that Friday. Prior to collecting information, each school was
allow identification of elevated levels of BP in children asked for permission to carry out the research. Based on
and adolescents, recent studies have demonstrated that the address, each school provided data, such as birth
the measurement of absolute height divided into height date, age, sex, and parent or guardian’s name. Anthropo-
ranges of 5 cm [12] and 10 cm [13] are practical tools metric evaluations and BP were collected by 2 experi-
and useful in detecting high BP in children and adoles- enced health professionals.
cents. Thus, the methods based on chronological age The anthropometric evaluations were carried out with
and proposed formulas are better suited for tall children the students barefoot, wearing shorts and a shirt as sug-
[8]. gested and described by Ross and Marfell-Jones [14].
As a result, based on these premises, this study was Body weight was measured with a digital scale (Tanita,
guided by the following objectives: (a) identify height United Kingdom, Ltd.) with a scale of 0-150 kg and an
ranges (5 and 10 cm) for detecting BP in children and accuracy of 100 g. Standing height was measured using a
adolescents better suited to students in the Maule Re- portable stadiometer (Seca & Co. KG, Hamburg,
gion and (b) propose percentiles for assessing BP based Germany) with a precision of 0.1 mm and a scale of 0–
on age, sex, and absolute height. This information may 2.50 m. After every 10 subjects, the scale was reset, and
be useful for researchers and health science professionals the stadiometer was recalibrated. Body Mass Index
for developing specific strategies for the Maule Region. (BMI = weight/standing height) was calculated.
BP (diastolic DBP and systolic SBP) was recorded
Methods based on the recommendations of the American Acad-
Type of study and sample emy of Pediatrics (AAP) [15]. Each subject sat on a chair
A descriptive cross-sectional study was carried out with with his or her back against the back of a chair with feet
a sample of 3,013 students Chileans (Latinos – Latin planted on the floor and the right arm (unclothed) ex-
Americans) between the ages of 5.0 and 18.9 years old. tended on a table (at the height of the heart). BP was
The simple population consisted of students from elem- taken twice at 1 min intervals between measurements. A
entary and secondary municipal schools located in the certified mercury sphygmomanometer (Omron M6) [16]
Maule Region of Chile. The number of students in the was used to measure the BP.
study totaled 29,500 (17,410 males and 12,100 females). The cut-off points for BP were adopted according to
Probability proportional to size (PPS) sampling was used those proposed by the United States Department of
to select the sample. Stratified sampling proportional to Health and Human Services [17]: normotensive < p90;
the total number of students based on sex and age from pre-hypertensive ≥ p90 to p95; and hypertensive ≥ p95.
the different schools was used to determine the final To evaluate BP, height intervals based on age ranges
sample. Specifically, 12 schools were included, resulting were created and used according to those suggested by
in 10,2% [1832 (6.2%) males and 1,181 (4.0%) females] Banker et al. [12] and described by Chiolero et al. [5] in
with a CI of 95%. ranges of 5 cm and in ranges of 10 cm. In addition,
The study was conducted according to the Declaration 108 cm was established as the minimum height with
of Helsinki for Human Subjects. In addition, the re- 188 cm as the maximum height for males, and for fe-
search was approved by the Ethics Committee from the males, 98 cm was the minimum and 178 cm the max-
Universidad Autónoma de Chile (certificate number imum height.
2413). Parents or guardians approved the evaluation of
their children by signing informed consent. The students Statistical analysis
themselves also provided written consent to participate. Normalization of the data was carried out by using Kol-
Students of both sexes from municipal schools in- moronov Smirnov’s method. Descriptive statistical mean
cluded in this study ranged in age from 5.0 to 18.9 years (X), standard deviation (SD), and ranges were used.
old. Students excluded from the research were those tak- Comparison of data between both sexes was carried out
ing medication or with any type of illness and/or symp- with a student t-test for independent samples. Pearson’s
tom of one during the previous month and those not correlations were used to analyze the relationshipCossio-Bolaños et al. BMC Pediatrics (2021) 21:26 Page 3 of 7
between DBP and SBP with height to categorize normo- comparing DBP and SBP by height range of 5 cm by sex,
tensive and hypertensive BP for both sexes and for significant differences occurred in 4 height ranges (from
height ranges of 5 cm and 10 cm. In addition, the % of 128 to 133 cm; 133 to 138 cm; 138 to 143 cm; and from
explication of R² was calculated. For all cases, p < 0.05 143 to 148 cm). In addition, significant differences were
was adopted. These calculations were performed using observed in the 10 cm range in only one of 138 to
SPSS 18.0. The LMS method was used based on three 148 cm in DBP and in SBP, height from 158 to 168 cm.
smoothed curves [L(t) Box-Cox transformation, M(t) As a result, based on the findings obtained, the results
median, and S(t) Coefficient of Variation] to create the from this research demonstrated that the BP differs very
percentiles [18]. For each sex, percentiles P50, P90, P95, little in the height ranges of 10 cm. This appears to re-
and P97 were calculated for DBP and SBP for absolute flect a better suitability to evaluate DBP and SBP in chil-
height. LMS Chart Maker version 2.3 [19] was used to dren and adolescents in the Maule Region in relation to
generate the curves. 5 cm.
In fact, in the 10 cm ranges, children and adolescents
Results from various ages were grouped together to fit into par-
The anthropometric variables and BP reflected in the sam- ticular height ranges. This allowed correcting for slow
ple of children and adolescents from the Maule Region and/or rapid growth rates among children and adoles-
are illustrated in Table 1. No significant differences in cents. Thus, at whatever age, height may vary, resulting
weight and height occurred from age 5 to 14 years old. to a large extent in the presence of a wider range of BP
However, from 15 to 18 years old, males were heavier and [12] values. Therefore, the use of 10 cm height intervals
taller than the females (p < 0.05). For BMI, the significant to evaluate BP may be an advantage over chronological
differences were found in both sexes (p > 0.05). For DBP, age since it is widely known that during the stages of
males presented higher values from age 7 to 12 years old childhood and adolescence that children and adolescents
(p < 0.05). However, for the remaining ages, the values experience important changes in body size and matur-
were relatively similar for both sexes (p > 0.059). For SBP, ation during physical growth [20]. Thus, height would
males showed values significantly higher than the females explain variability substantially more than age [21].
at ages 8 and 9 years old, and 11 and 12 years old, and In this sense, height is a practical and accurate measure
from 15 to 18 years old (p < 0.05). that serves to evaluate a variety of populations and diverse
The relationships between the DBP and SBP with ethnic groups during the growth stage, especially when it
height for each category classified for BP are shown in is used in conjunction with evaluating BP [12, 22, 23]. Fur-
Table 2. The values for R and R2 were relatively similar thermore, it appears to be immanent that efforts are being
when aligned by BP category for 5 cm and 10 cm. made to correct and create simpler and more practical
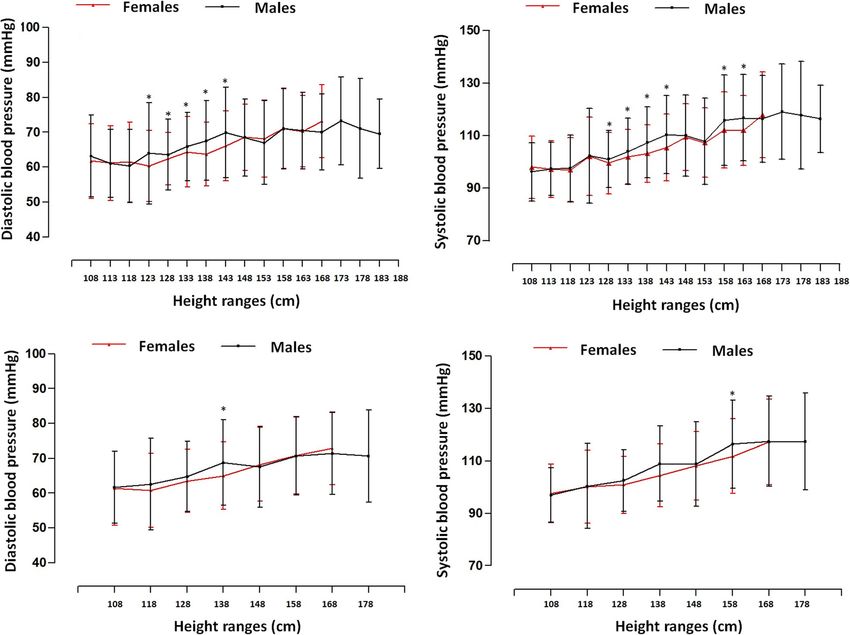
Comparisons for BP adjusted for absolute height for techniques and tools to better identify hypertension in
ranges of 5 and 10 cm are depicted in Fig. 1. Significant children [24] and adolescents and incorporate height rou-
differences occurred between both sexes when SBP and tinely into medical examinations.
DBP were aligned by ranges of 5 cm: ranges 128 to A number of studies have reported that height is a
133 cm; from 133 to 138 cm; from 138 to 143 cm; and non-invasive alternative that serves to analyze changes
from 143 to 148 cm (p < 0.05). For the SBP, differences and/or thresholds of BP related to chronological age
continued in height ranges: 158 to 163 and 168 to [21]. Also, height is considered as a useful indicator for
173 cm (p < 0.05). Furthermore, differences were ob- doctors. The use of this anthropometric variable may
served in DBP in the range of 123 to 128 cm (p < 0.05). contribute to identifying children and adolescents with
For the 10 cm categories, differences emerged in DBP in elevated BP and, consequently, offer a possible treatment
the range of 138 to 148 cm (p < 0.05) while in the SBP, [8].
the range was 158 to 168 cm (p < 0.05). In fact, based on previous findings, the researchers de-
Table 3 shows the percentiles distribution using the veloped percentiles for DBP and SBP based on 10 cm
LMS method (p50, p90, p95, and p97) adjusted for height ranges for children and adolescents of the Maule
height ranges of 10 cm for both sexes. The values for Region. In effect, the United States Department of
DBP and SBP increased as did the height ranges. Health and Human Services [17] maintains that the ref-
erence values for BP thresholds for children and adoles-
Discussion cents need to meet the requisites for six variables: DBP,
The results from this study have shown slight to moder- SBP, age, gender, weight, and percentile for height.
ate positive correlations between height with DBP and The proposed percentiles for this study meet the re-
SBP categories of normotensive and hypertensive BP. quirements indicated above. This tool may serve as a
These correlations were relatively similar in the height simple and easy to use alternative for early detection of
ranges determined by 5 and 10 cm. However, when pre- and hypertension in children and adolescents. ItCossio-Bolaños et al. BMC Pediatrics (2021) 21:26 Page 4 of 7
Table 1 Anthropometric characteristics of the children and adolescents studied
Age Weight (kg) Height (cm) BMI (kg/m2) DBP (mmHg) SBP (mmHg)
(years)
n X SD X SD X SD X SD X SD
Males
5.0-5.9 64 21.5 3.3 113.5 6.0 16.6 1.8 61.8 13.8 97.9 14.1
6.0-6.9 77 26.0 6.6 120.1 6.1 17.9 3.8 61.7 13.7 97.6 12.5
7.0-7.9 63 31.0 7.0 127.3 6.6 19.0 3.1 64.8* 11.7 101.7 14
8.0-8.9 77 32.2 6.5 130.4 5.3 18.8 2.9 63.8* 9.5 103.0* 13
9.0-9.9 96 36.8 8.8 136 8.3 19.8 3.8 66.9* 11.4 106.4* 14.5
10.0-10.9 92 42.1 9.8 142.4 7.1 20.6 3.5 67.3* 10.6 106.2 12.8
11.0-11.9 89 47.2 10.8 147.9 7.7 21.5 4.0 69.8* 13.3 109.2* 15.7
12.0-12.9 106 50.4 10.9 154.3 8.2 20.7 4.0 69.9* 11.2 110.7* 16.7
13.0-13.9 157 54.7 10.2 160.8 8.5 20.7 2.9 68.1 12.1 110.8 14
14.0-14.9 180 60.0 11.0 166.1 6.6 21.7 3.7 68.3 11.7 112 15
15.0-15.9 182 64.5* 9.2 169.9* 7.0 22.3 3.0 69.2 10.1 114.3* 14.8
16.0-16.9 214 70.4* 12.8 171.5* 7.1 23.9 4.1 70.9 10.5 117.4* 15.8
17.0-17.9 279 71.7* 13.3 171.4* 6.4 24.4 4.1 73.5 12.7 121.8* 19.3
18.0-18.9 156 71.6* 11.0 172.0* 6.9 24.2 3.6 71.2 12.3 119.7* 20.5
Total 1832 56.1 19.2 157.4 19.5 21.9 4.2 69.1 12.1 112.5 17.5
Females
5.0-5.9 55 22.1 3.5 113.7 5.2 17.0 2.2 62.2 12.0 97.5 12.6
6.0-6.9 58 25.7 5.4 119.4 5.8 17.9 2.9 60.1 10.7 98.6 10.4
7.0-7.9 52 29.1 6.0 126.2 6.2 18.1 2.5 61.4 9.5 101.1 12.4
8.0-8.9 52 32.9 7.5 130.2 6.6 19.2 3.4 61.7 8.1 99.2 11.1
9.0-9.9 76 36.5 8.0 137.4 6.8 19.2 3.1 63.9 8.8 101.6 10.9
10.0-10.9 116 42.1 9.1 144.0 8.0 20.2 3.2 65.2 8.7 105.4 12.3
11.0-11.9 81 47.2 9.0 150.9 7.3 20.7 3.6 65.6 9.4 104.4 12.9
12.0-12.9 110 54.0 10.7 156.0 6.2 22.1 4.0 66.1 12.0 108 12.7
13.0-13.9 75 56.3 10.3 158.6 7.3 22.4 3.6 69.0 10.3 110.9 12.0
14.0-14.9 93 59.3 11.6 158.6 6.9 23.5 3.8 69.5 11.1 112.0 16.1
15.0-15.9 81 60.4 10.5 159.6 4.2 23.7 3.9 69.0 9.1 110.3 13.2
16.0-16.9 114 62.8 12.1 159.2 5.5 24.7 4.6 71.5 9.6 113.1 13.3
17.0-17.9 141 64.1 13.9 158.5 4.9 25.4 4.9 72.3 12.4 111.1 16.4
18.0-18.9 77 59.7 9.6 157.8 5.7 24 3.6 72.4 10.7 109.7 14.1
Total 1181 50.5 17 149 15.6 22 4.6 67.4 11.1 107.3 14.2
Legend: * significant difference in relation to women, X Average, SD Standard deviation, BMI Body Mass Index, SBP Systolic blood pressure, DBP Diastolic
blood pressure
Table 2 Relationship of height with BP by category in normotensive and hypertensive in children of both sexes
Categories Males Females
DBP (mmHg) SBP (mmHg) DBP (mmHg) SBP (mmHg)
R R2 R R2 R R2 R R2
5 cm categories
Normotensive 0.31 0.1 0.45 0.2 0.37 0.13 0.38 0.14
Hypertensive 0.27 0.07 0.57 0.32 0.39 0.15 0.53 0.29
10 cm categories
Normotensive 0.32 0.1 0.46 0.21 0.39 0.15 0.39 0.15
Hypertensive 0.26 0.07 0.59 0.35 0.4 0.16 0.53 0.29
Legend: SBP Systolic blood pressure, DBP Diastolic blood pressureCossio-Bolaños et al. BMC Pediatrics (2021) 21:26 Page 5 of 7 Fig. 1 Comparison of the mean and ± SD values for Diastolic blood pressure and Systolic blood pressure by age ranges for both sexes (above 5 cm and below 10 cm) may also be useful for professionals working in clinical for males and 159.8 ± 5.7 cm for females. In fact, these and epidemiological contexts. In addition, it may have values correspond to a height range of the percentiles an important role in the prevention of cardiac [25] dis- proposed here of 168–178 cm for males with a BP of eases during growth and development. 139.9/86.6 mmHg and for females, a height range of As a result, the cut-off points adopted for this research 158–168 cm with a corresponding BP of 130.4/ were those proposed in the fourth report of the US De- 84.8 mmHg. These values at 18 years old are close to partment of Health and Human Services [17]:
Cossio-Bolaños et al. BMC Pediatrics           (2021) 21:26                                                                                              Page 6 of 7

Table 3 Distribution of percentiles to assess DBP and SBP in children and adolescents adjusted for absolute height and sex
Height             DBP (mmHg)                                                                SBP (mmHg)
ranges (cm)
                   L          M         S         P50         P90      P95       P97         L          M          S         P50         P90         P95        P97
Males
  108-117.9        -0.64      60.3      0.18      60.3        77.6     84        88.7        -0.26      97         0.13      97          115.1       121.1      125.1
  118 -127.9       -0.44      61.6      0.18      61.6        78.1     83.9      88          -0.09      99.1       0.13      99.1        117.4       123.2      127.2
  128-237.9        -0.28      64        0.17      64          80.1     85.5      89.4        0          102.6      0.13      102.6       121.3       127.2      131.2
  138-147.9        -0.16      66.3      0.17      66.3        82.3     87.6      91.3        -0.04      106.5      0.13      106.5       126.2       132.5      136.7
  148-157.9        -0.09      68        0.16      68          83.8     89        92.6        -0.19      110.1      0.13      110.1       131.1       137.9      142.6
  158-167.9        -0.01      69.6      0.16      69.6        85.6     90.8      94.3        -0.34      114.1      0.14      114.1       136.8       144.3      149.5
  168-177.9        0.07       70.4      0.16      70.4        86.6     91.8      95.3        -0.27      116.1      0.14      116.1       139.9       147.8      153.2
  178-187.9        0.11       70.4      0.17      70.4        86.8     92        95.5        -0.07      117.1      0.15      117.1       141.7       149.7      155.1
  >188             0.14       70.5      0.17      70.5        87       92.2      95.8        0.14       118.4      0.15      118.4       143.7       151.7      157.1
Females
  98-107.9         -0.33      56.9      0.19      56.9        73       78.7      82.6        1.4        95.3       0.13      95.3        110.5       114.6      117.3
  108-117.9        -0.31      59.1      0.17      59.1        74.4     79.7      83.4        1.34       97.7       0.13      97.7        113.2       117.4      120.2
  118 -127.9       -0.27      60.5      0.16      60.5        75       79.8      83.2        1.18       99.7       0.12      99.7        115.3       119.7      122.5
  128-237.9        -0.1       62.4      0.15      62.4        76.2     80.7      83.7        0.92       101.5      0.12      101.5       117.3       121.8      124.8
  138-147.9        0.14       64.8      0.15      64.8        78.3     82.5      85.4        0.59       104.2      0.12      104.2       120.7       125.5      128.7
  148-157.9        0.25       67.6      0.15      67.6        81.6     85.9      88.8        0.34       107.5      0.12      107.5       125.2       130.5      134
  158-167.9        0.08       70.1      0.15      70.1        84.8     89.5      92.7        0.2        111.2      0.13      111.2       130.4       136.3      140.2
  168-177.9        -0.15      72.3      0.15      72.3        87.8     92.8      96.3        0.02       115.9      0.13      115.9       137.1       143.8      148.3
  >178             -0.39      74.4      0.15      74.4        90.6     96        99.8        -0.16      121.1      0.14      121.1       144.6       152.2      157.4
Legend: M medium, L Box-Cox transformation, S coefficient of variation, P percentile, SBP systolic blood pressure, DBP diastolic blood pressure

calculator system for evaluating BP by height ranges.                                 Authors’ contributions
The graphic reports provided by the calculations could                                M.C.B., R.G.C. and W.C.B. contributed to the design of the research study.
                                                                                      R.G.C., M.C.B., R.V.E., J.S.T., and F.C.C. collected data, contributed to the
significantly facilitate BP evaluations. The calculator may                           discussion, wrote the manuscript and reviewed/edited the manuscript. C.L.A
be obtained online with the following link: http://www.                               translated, edited, commented on, and reviewed the manuscript. M.C.B.,
reidebihu.net/pad_pas_ch.php.                                                         R.G.C., C.U.A., R.V.E., and F.C.C. collected and analyzed data and/or reviewed/
                                                                                      edited the manuscript. R.G.C., and M.C.B. provided statistical analyses and
                                                                                      reviewed/edited the manuscript. All authors revised and agreed on the
                                                                                      views expressed in the manuscript.
Conclusions
In conclusion, the researchers identifies that height is a                            Funding
determinant for evaluating BP, and the height ranges for                              Fondecyt Regular 1141295, Chile.
10 cm are better suited for children and adolescents of
                                                                                      Availability of data and materials
the Maule Region. BP in the 10 cm height ranges differs
                                                                                      The datasets supporting the conclusions of this research article are available
very little from those of 5 cm. In light of these results,                            by emailing the corresponding author.
percentiles were proposed for evaluating DBP and SBP
based on height ranges and sex. This information is use-                              Ethics approval and consent to participate
ful for identifying children and adolescents with elevated                            The study protocol was approved by the Ethic Committee of the
                                                                                      Universidad Autónoma de Chile, UA 238/2014. Parents and guardians
BP and needs to be included in routine clinical examina-                              provided informed written consent for their children under the age of 16
tions and in the educational system.                                                  participating in the study. In addition, all students under and over the age of
                                                                                      16 in the study provided written informed consent acknowledging their
                                                                                      consent to participate and their understanding of the research procedures
Abbreviations                                                                         and objectives.
BP: Blood pressure; DBP: Diastolic blood pressure; SBP: Systolic blood
pressure; BMI: Body Mass Index; AAP: American Academy of Pediatrics
                                                                                      Consent for publication
                                                                                      Not applicable.
Acknowledgements
We would like to express our gratitude to all the participating students,             Competing interests
teachers, and schools for their tremendous support.                                   The authors declare that they have no competing interests.
Cossio-Bolaños et al. BMC Pediatrics (2021) 21:26 Page 7 of 7
Author details 19. Pan H, Cole TJ. Chartmaker LMS. Available online at: http://www.
1
Universidad Católica del Maule, Av San Miguel 3605, Talca, Chile. healthforallchildren.co.uk (accessed March 28, 2015). 2006.
2
Universidad Católica Silva Henríquez, Santiago, Chile. 3Universidad del Bío 20. Gomez-Campos R, Arruda M, Luarte-Rocha C, Urra Albornoz C, Almonacid
Bío, Chillán, Chile. 4Universidad Nacional de San Agustín de Arequipa, Fierro A, Cossio-Bolaños M. Enfoque teórico del crecimiento físico de niños
Arequipa, Perú. 5Universidad Privada San Juan Bautista, Lima, Perú. 6Centro y adolescentes. Rev Española de Nutr Hum Diet. 2016;20(3):244–53.
de Investigación CINEMAROS, Arequipa, Perú. 7Escuela de Kinesiología, 21. Daniels SR, McMahon RP, Obarzanek E, Waclawiw MA, Similo SL, Biro FM,
Facultad de Salud, Universidad Santo Tomás, Talca, Chile. et al. Longitudinal correlates of change in blood pressure in adolescent
girls. Hypertension. 1998;31(1):97–103.
Received: 7 August 2020 Accepted: 26 December 2020 22. Lu Q, Ma CM, Yin FZ, Liu BW, Lou DH, Liu XL. How to simplify the
diagnostic criteria of hypertension in adolescents. J Hum Hypertens. 2011;
25(3):159.
23. Galescu O, George M, Basetty S, Predescu I, Mongia A, Ten S, Bhangoo A.
References Blood pressure over height ratios: simple and accurate method of detecting
1. Al Salloum AA, El Mouzan MI, Al Herbish AS, Al Omar AA, Qurashi MM. elevated blood pressure in children. International Journal of Pediatrics. 2012
Blood pressure standards for Saudi children and adolescents. Ann Saudi 8;2012: 253497.
Med. 2009;29(3):173–8. 24. Mitchell CK, Theriot JA, Sayat JG, Muchant DG, Franco SM. A simplified table
2. Barba G, Buck C, Bammann K, Hadjigeorgiou C, Hebestreit A, Mårild S, improves the recognition of paediatric hypertension. J Paediatr Child
Molnar D, Russo P, Veidebaum T, Vyncke K, Ahrens W. Blood pressure Health. 2011;47(1-2):22–6.
reference values for European non-overweight school children: the IDEFICS 25. Mattace-Raso FU, van der Cammen TJ, Hofman A, van Popele NM, Bos ML,
study. Int J Obes (Lond). 2014;38(S2):48. Schalekamp MA, Asmar R, Reneman RS, Hoeks AP, Breteler MM, Witteman
3. Krzyżaniak A, Krzywińska-Wiewiorowska M, Stawińska-Witoszyńska B, JC. Arterial stiffness and risk of coronary heart disease and stroke.
Kaczmarek M, Krzych L, Kowalska M, Szilágyi-Pągowska I, Palczewska I, Karch Circulation. 2006;113(5):657–63.
A, Jośko J, Ostrowska-Nawarycz L. Blood pressure references for Polish 26. Goonasekera CD, Dillon MJ. Measurement and interpretation of blood
children and adolescents. Eur J Pediatr. 2009;168(11):1335–42. pressure. Arch Dis Child. 2000;82(3):261–5.
4. Lurbe E, Cifkova R, Cruickshank JK, Dillon MJ, Ferreira I, Invitti C, Kuznetsova 27. Gomez-Campos R, Arruda M, Leite-Portella D, Pacheco-Carrillo J, Urral-
T, Laurent S, Mancia G, Morales-Olivas F, Rascher W. Management of high Albornoz C, Sulla-Torres J, Luarte-Rocha C, Cossio-Bolaños MA. Physical
blood pressure in children and adolescents: recommendations of the growth and body adiposity curves in students of the Maule Region (Chile).
European Society of Hypertension. J Hypertens. 2009;27(9):1719–42. Front Pead. 2019;7:323.
5. Chiolero A, Bovet P, Paradis G. Screening for elevated blood pressure in
children and adolescents: a critical appraisal. JAMA Pediatr. 2013;167(3):266– Publisher’s Note
73. Springer Nature remains neutral with regard to jurisdictional claims in
6. Hvidt KN, Olsen MH, Ibsen H, Holm JC. Effect of changes in BMI and waist published maps and institutional affiliations.
circumference on ambulatory blood pressure in obese children and
adolescents. J Hypertens. 2014;32(7):1470–7.
7. Chiolero A, Paradis G. User-friendly tools to identify elevated blood pressure
in children. Paediatr Child Health. 2013;18(2):63–4.
8. Ma C, Kelishadi R, Hong YM, Bovet P, Khadilkar A, Nawarycz T, Krzywińska-
Wiewiorowska M, Aounallah-Skhiri H, Zong XN, Motlagh ME, Kim HS.
Performance of eleven simplified methods for the identification of elevated
blood pressure in children and adolescents. Hypertension. 2016;68(3):614–
20.
9. Rosner B, Cook NR, Daniels S, Falkner B. Childhood blood pressure trends
and risk factors for high blood pressure: the NHANES experience 1988–
2008. Hypertension. 2013;62(2):247–54.
10. Neuhauser HK, Thamm M, Ellert U, Hense HW, Rosario AS. Blood pressure
percentiles by age and height from nonoverweight children and
adolescents in Germany. Pediatrics. 2011;127(4):e978-88.
11. Park MK, Menard SW, Schoolfield J. Oscillometric blood pressure standards
for children. Pediatr Cardiol. 2005;26(5):601.
12. Banker A, Bell C, Gupta-Malhotra M, Samuels J. Blood pressure percentile
charts to identify high or low blood pressure in children. BMC Pediatr. 2016;
16(1):98.
13. Chiolero A, Paradis G, Simonetti GD, Bovet P. Absolute height-specific
thresholds to identify elevated blood pressure in children. J Hypertens.
2013;31(6):1170–4.
14. Ross WD. Kinanthropometry. Physiological testing of the high-performance
athlete. 1991.
15. Flynn JT, Kaelber DC, Baker-Smith CM, et al. Clinical Practice Guideline for
Screening and Management of High Blood Pressure in Children and
Adolescents. Pediatrics. 2017;140(3):e20171904.
16. Topouchian JA, El Assaad MA, Orobinskaia LV, El Feghali RN, Asmar RG.
Validation of two automatic devices for self-measurement of blood pressure
according to the International Protocol of the European Society of
Hypertension: the Omron M6 (HEM-7001-E) and the Omron R7 (HEM 637-
IT). Blood Press Monit. 2006;11(3):165–71.
17. U.S. Department of Health and Human Services. The fourth report on the
diagnosis, evaluation, and treatment of high blood pressure in children and
adolescents. Pediatrics. 2004;114(2):555–76. (suppl, 4th report).
18. Cole TJ, Bellizzi MC, Flegal KM, Dietz WH. Establishing a standard definition
for child overweight and obesity worldwide: international survey. BMJ. 2000;
320(7244):1240.You can also read