Ecotoxicology and Environmental Safety - Aquatic Control
←
→
Page content transcription
If your browser does not render page correctly, please read the page content below
Ecotoxicology and Environmental Safety 207 (2021) 111233
Contents lists available at ScienceDirect
Ecotoxicology and Environmental Safety
journal homepage: www.elsevier.com/locate/ecoenv
Laboratory-scale evaluation of algaecide effectiveness for control of
microcystin-producing cyanobacteria from Lake Okeechobee, Florida (USA)
Ciera Kinley-Baird a, *, Alyssa Calomeni b, David E. Berthold c, Forrest W. Lefler c,
Maximiliano Barbosa c, John H. Rodgers d, H. Dail Laughinghouse IV c
a
Aquatic Control, Inc., 418 W State Road 258, Seymour, IN, 47274, USA
b
EA Engineering, Science, and Technology, Inc., PBC 225 Schilling Circle Suite 400, Hunt Valley, MD, 21031, USA
c
Agronomy Department, Ft. Lauderdale Research and Education, University of Florida/IFAS, 3205 College Avenue, Davie, FL, 33314 USA
d
Department of Forestry and Environmental Conservation, 261 Lehotsky Hall, Clemson University, Clemson, SC, 29634, USA
A R T I C L E I N F O A B S T R A C T
Keywords: Growth of microcystin-producing cyanobacteria in Lake Okeechobee (Florida, USA) and surrounding waters has
Harmful algal blooms resulted in adverse health impacts for humans and endangered species, as well as significant economic losses. As
Algaecides these issues worsen, there is growing pressure for efficacious solutions to rapidly mitigate harmful algal blooms
Microcystins
(HABs) and protect critical freshwater resources. Applications of USEPA-registered algaecides as management
Water resource management
tactics meet many decision-making criteria often required by water resource managers (e.g., effective, scalable,
selective), but have not yet been evaluated on a large scale within the Lake Okeechobee waterway. This study
was conducted to bolster the peer-reviewed database for available management tactics against microcystin-
producing cyanobacteria in waters of this region. Laboratory-scale experiments can be conducted first to mini
mize uncertainty at larger scales and improve confidence in decision-making. In this study, samples containing
microcystin-producing cyanobacteria collected from Lake Okeechobee were exposed to several USEPA-registered
algaecides in laboratory toxicity experiments. Responses of target cyanobacteria were measured 3 days after
treatment (DAT) in terms of cell density, chlorophyll-a concentrations, and phycocyanin concentrations. Based
on responses of the cyanobacteria, minimum effective exposure concentrations were identified for each algae
cide. Microcystin release (i.e. proportion of total microcystins in the aqueous phase) was measured and compared
1 DAT among effective exposures. Total microcystin concentrations were measured in effective treatments at 1,
4, and 9 DAT to discern potential for microcystin persistence following exposures to the effective formulations
and exposure concentrations. Overall, several formulations including GreenClean Liquid® 5.0, GreenClean
Liquid® 5.0 combined with Hydrothol® 191, and the copper-based algaecides evaluated (Algimycin® PWF,
Argos, Captain® XTR, Cutrine® Ultra, and SeClear®) achieved significant and similar effects on target cyano
bacteria. The chelated copper-based formulations (Algimycin® PWF, Argos, Captain® XTR, and Cutrine® Ultra)
resulted in relatively less microcystin release 1 DAT and lesser total microcystin concentrations 4 DAT. At 9 DAT,
total microcystin concentrations were significantly lower than in untreated controls in all treatments evaluated.
These results provide the necessary comparative performance data for preliminary decision-making and
designing additional studies at larger scales. Importantly, the comparative toxicity data and approach provided
in this study demonstrate the initial steps for development of site-specific management strategies for Lake
Okeechobee and other areas impacted by harmful algal blooms with large spatial and temporal scales.
1. Introduction Okeechobee and the surrounding waterways, resulting in measurable
adverse health effects for people and endangered species, as well as
Noxious algal growths in Florida’s inland waters and along the coast significant losses in revenue generated by tourism, recreation, and
have been a problem for decades. In recent years, dense blooms of toxin- property values. Millions of dollars in income have been lost among
producing cyanobacteria (blue-green algae) have plagued Lake local businesses near the St. Lucie and Caloosahatchee Rivers and
* Corresponding author.
E-mail address: cierab@aquaticcontrol.com (C. Kinley-Baird).
https://doi.org/10.1016/j.ecoenv.2020.111233
Received 22 April 2020; Received in revised form 19 August 2020; Accepted 23 August 2020
Available online 8 September 2020
0147-6513/© 2020 The Author(s). Published by Elsevier Inc. This is an open access article under the CC BY-NC-ND license
(http://creativecommons.org/licenses/by-nc-nd/4.0/).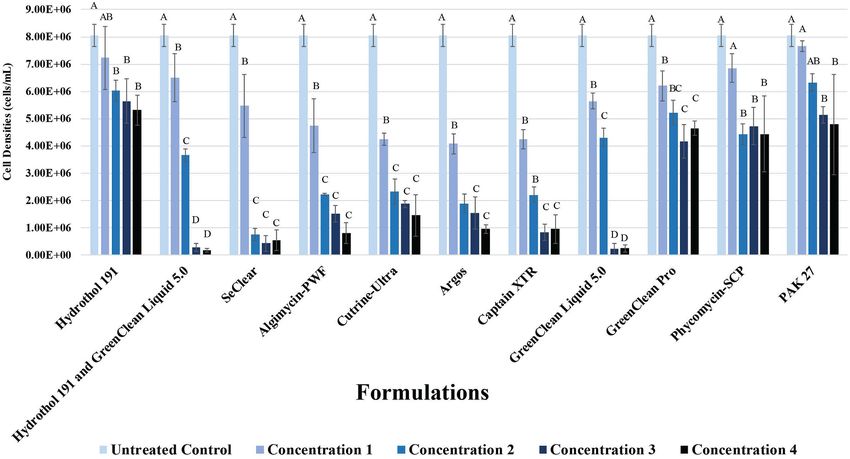
C. Kinley-Baird et al. Ecotoxicology and Environmental Safety 207 (2021) 111233
Estuaries (Alvarez et al., 2019). In response to these harmful algal the sole line of defense for mitigating HABs. Both long-term and
blooms (HABs), the governor of Florida declared a state of emergency in short-term approaches have a place in management but must be
Martin and St. Lucie counties in 2016 (Scott, 2016) and in Palm Beach, recognized as tactics with different goals and possible outcomes.
Martin, St. Lucie, Glades, Hendry, Lee and Okeechobee counties in 2018 Short-term solutions are important for mitigating immediate risks for
(Scott, 2018). Following the 2018 declaration, the Center for Disease residents, visitors, pets, wildlife, and livestock, and restoring beneficial
Control and Prevention (CDC) was awarded 1 million dollars to respond services (i.e., uses) of impacted waters, and should be evaluated. Man
to communities facing health issues due to exposures to cyanobacteria. agement objectives for Lake Okeechobee and associated waters must
Lake Okeechobee is the largest freshwater lake in Florida occupying include management of toxin production by several cyanobacteria (e.g.
about 1900 km2 (~730 square miles) with an average depth of about Aphanizomenon, Chrysosporum, Cuspidothrix, Dolichospermum, Micro
2.7 m, located in Glades, Okeechobee, Martin, Palm Beach, and Hendry cystis, and Raphidiopsis). The use of USEPA-registered chemical algae
counties. Primarily fed by the Kissimmee River, Fisheating Creek, Lake cides for management of cyanobacteria is a short-term solution for
Istokpoga, and smaller sources, Lake Okeechobee drains an area of which there are extensive peer-reviewed data to support effectiveness
12,000 km2 (SFWMD, 1989). This drainage area extends from North of against target species (Peterson et al., 1997; Ruzycki et al., 1998; Had
Orlando through the Everglades to Florida Bay, with agricultural, sub joudja et al., 2009; Matthijs et al., 2012; Calomeni et al., 2014; Geer
urban, and urban land uses in the watershed (Reddy et al., 1996). et al., 2016), margins of safety for non-target species (Surber and
Agricultural land in the watershed is used predominantly for beef cattle, Pickering, 1962; Wilson and Bond, 1969; Murray-Gulde et al., 2002;
dairy, sugarcane, citrus, and other crops. Lake Okeechobee is part of a Closson et al., 2014; Calomeni et al., 2015; Geer et al., 2016), micro
complex waterway managed by the United States Army Corps of Engi cystin release and dissipation following exposures (Iwinski et al., 2016a,
neers (USACE) with input from the South Florida Water Management 2017; Kinley et al., 2017, 2018), scalability (Bishop and Rodgers, 2011;
District (SFWMD), the Florida Department of Environmental Protection Huddleston et al., 2015; Geer et al., 2017), and rapid but temporary
(DEP) and the Florida Fish and Wildlife Conservation Commission results (Isaacs et al., 2013).
(FWC). Authorized uses of the lake include flood and storm risk man Use of USEPA-registered algaecides for management of toxin-
agement, navigation, water supply, enhancement of fish and wildlife, producing cyanobacteria is a promising tactic that meets many com
and enhancement of recreation. The Lake Okeechobee Regulation mon decision-making criteria that water resource managers often
Schedule (LORS) is the current water control plan for the lake and the require (i.e. effectiveness, selectivity, durability, scalability, availability,
Everglades Agricultural Area (EAA) that sets seasonal targets for stage cost, ease of application, and ease of transport and storage), and there
and water releases from this shallow sub-tropical lake to avoid jeop are peer-reviewed data to support these criteria being met (see citations
ardizing the integrity of the Herbert Hoover Dike, and ultimately to in prior paragraph). However, to date, this tactic has not been used at a
prevent water from inundating the surrounding populated areas. Nor large scale for control of cyanobacteria in Lake Okeechobee and sur
mally, water is discharged from Lake Okeechobee south through a series rounding waters, thus, there are no peer-reviewed data available
of canals into the EAA for water supply and storage, which then flows regarding performance in these aquatic systems. Due to the range of
into the Water Conservation Areas (WCA) and the Stormwater Treat sensitivities of cyanobacterial species (and strains of species) from site to
ment Areas (STA) of the SFWMD. However, due to topography and site and the variability of water characteristics (e.g., pH, dissolved
storage limitations south of the lake, excess water from Lake Okeecho organic carbon, and hardness) that can alter exposures (and ultimately
bee can sometimes be released to the Atlantic Ocean and Gulf of Mexico performance) of algaecides, laboratory toxicity studies can be conducted
through dredged canals connecting to coastal rivers, such as the St. Lucie prior to full-scale applications to discern relatively effective formula
Canal to the St. Lucie River and the Caloosahatchee Canal and Lake tions and exposure concentrations for a given site. At the laboratory
Hicpochee to the Caloosahatchee River. Releases can result in problems scale, concepts regarding toxicity thresholds, potencies, and compara
associated with rapid fluctuations in water characteristics (e.g., salinity) tive effectiveness among available algaecide formulations can be tested
and downstream transport of nutrients and cyanobacteria into the using site-collected cyanobacteria in site water, while minimizing con
adjacent estuaries. founding factors. Analytical confirmation of active ingredient exposure
To date, no substantive plan is currently in place that can provide concentrations and multiple lines of evidence of cyanobacterial re
effective short-term or long-term solutions for cyanobacterial blooms in sponses to those exposures are necessary to test these hypotheses (Cal
Lake Okeechobee or surrounding waterways. As awareness of the risks omeni et al., 2018a). These lines of evidence include individual-level
and damages associated with toxin producing-cyanobacteria rises, “no parameters (e.g., enumeration of viable cells) and assemblage-level
action” is not an acceptable management decision. Scientifically parameters (e.g., concentrations of photosynthetic pigments, such as
defensible solutions are crucial for accomplishing effective and efficient chlorophyll-a and phycocyanin). Results from these studies confirm the
mitigation and control of target cyanobacteria, especially in large public effective concentration of algaecide required to control the growth of
water resources. Long-term solutions (e.g. nutrient control in watershed) target cyanobacteria for a specific site and at a specific cell density,
are attractive and desirable, but may require years to decades to see thereby decreasing uncertainty regarding the outcome of an algaecide
results, if at all (Havens and James, 2005; Canfield et al., 2018). For treatment and providing comparative toxicity data for decision making.
example, a bloom of cyanobacteria covering over 259 km2 of Lake Toxin release and persistence following algaecide exposures can also
Okeechobee in 1986 initially prompted Florida legislature to pass the be evaluated and compared among formulations at the laboratory scale
Surface Water Improvement and Management Act (SWIM Act), in an to provide preliminary data for management scenarios in which those
effort to manage nutrient inputs (with a focus on non-point sources) to aspects of a treatment are important. Toxin release by cyanobacteria
the lake. Since implementation of the SWIM Act over 30 years ago, following algaecide exposures is a common concern among water
annual inputs of total phosphorus to Lake Okeechobee have not signif resource managers based on the perception that any exposure of an
icantly declined, nor have average chlorophyll-a concentrations (Can algaecide will result in complete intracellular toxin release from cya
field et al., 2018). The long-term tactic of nutrient control requires nobacteria. This perception is more commonly focused on copper-based
essentially eliminating nutrient flow into Lake Okeechobee from the algaecides due to earlier studies that reported relatively high or com
watershed, as well as sequestering or removing all sediment-associated plete microcystin release after using unspecified or illegal (in the United
nutrients to cease internal recycling. Further, there are factors contrib States) concentrations of copper in treatments (Jones and Orr, 1994;
uting to proliferation of cyanobacteria blooms other than nutrient inputs Touchette et al., 2008). More recent research regarding this topic has
and cycling, including warming waters, tropical storms, and intense shown that microcystin release depends on exposure concentration of
precipitation events. Though evaluation and proper management of copper-based algaecides, and that cyanobacteria can be adversely
nutrient loading from the watershed is important, it is often viewed as affected to the point of senescence while minimizing toxin release
2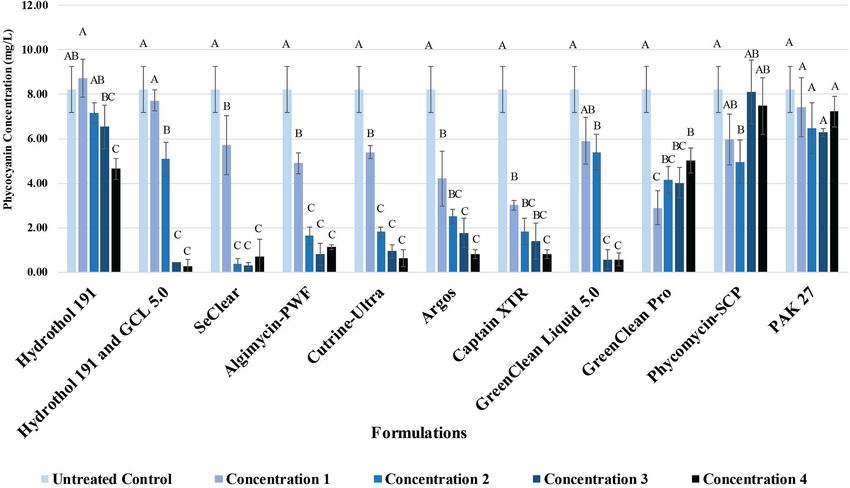
C. Kinley-Baird et al. Ecotoxicology and Environmental Safety 207 (2021) 111233
(Iwinski et al., 2016; Kinley et al., 2017). It is also important to recognize 2017). Water characteristics measured at initiation of the experiment
that human recreation and drinking water guidelines for endotoxins are are presented with the supplementary material for this study.
based on total toxin concentration (WHO, 2003; USEPA, 2019). Thus, in
waters used for recreation by people and pets, and by organisms that
2.2. Preparation of experimental treatments
inhabit or use the water, risk arises from the sum of both intracellular
and dissolved (i.e. aqueous) forms. However, when applying algaecides
Laboratory toxicity experiments were conducted using fundamental
near intake structures for drinking water treatment plants, it is logical to
design principles and protocols described by Calomeni et al. (2018a).
prioritize minimal toxin release because in-plant processes that can
The site-collected cyanobacterial assemblage was quantified using a
physically remove cyanobacteria cells (e.g. flocculation and sedimen
Bürker-Türk counting chamber and contained a total cell density of 6.14
tation, dissolved air flotation, and filtration) are generally more effective
× 106 cells/mL, with 71% of the total density consisting of Microcystis
and efficient for removing endotoxins (via removing the cells from the
aeruginosa (Kützing) Kützing and 29% consisting of Pseudanabaena
water) than conventional oxidation and sorption processes targeted for
mucicola (Naumann & Huber-Pestalozzi) Schwabe. Experimental treat
removal of dissolved organics (Svrcek and Smith, 2004). Therefore,
ments were prepared by adding 200 mL of homogenized site water and
when treating in potable source waters, it is beneficial to understand the
the cyanobacteria assemblage (at the above stated cell density) to 400
relationship between algaecide exposure concentration and extent of
mL borosilicate beakers. Ten individual algaecide formulations and one
toxin release before and after an algaecide is applied, and the conse
combination of algaecide formulations were evaluated in this study
quences of timing a treatment.
(physical and chemical properties of algaecides included in supple
Since toxin persistence following algaecide exposures is an addi
mentary material), at 4 exposure concentrations (n = 3) within the legal
tional concern from a risk perspective, relative rate and extent of toxin
(i.e. label) application range for each formulation (Table 1). The eval
dissipation following algaecide exposures is another subject that can be
uated formulations included 5 copper-based algaecides (Algimycin®
studied initially in laboratory-scale experiments. Measurements of total
PWF, Argos, Captain® XTR, Cutrine® Ultra, and SeClear®), 4 hydrogen
microcystin concentrations with time after algaecide exposures provide
peroxide-based algaecides (GreenClean® Pro, GreenClean® Liquid 5.0,
preliminary information for potential effects of algaecide exposures on
PAK® 27, and Phycomycin® SCP), and 1 endothall-based algaecide
microcystin-degrading microbial populations, since these effects should
(Hydrothol® 191). The combination evaluated included GreenClean®
manifest in altered rates of microcystin dissipation. Scaled-up experi
Liquid 5.0 and Hydrothol® 191, with one concentration of Hydrothol®
ments will ultimately be necessary to test hypotheses of microcystin
191 and a range of concentrations of GreenClean® Liquid 5.0 (Table 1).
dissipation following algaecide exposures, since fate processes including
The formulations evaluated in this study were selected to represent the
dilution and dispersion could be dominant at a site, and sediment mi
types of formulations available among USEPA-registered algaecides.
crobial populations could be more robust. For the purposes of this study,
Untreated controls consisting of site water and cyanobacteria were also
microcystin-producing cyanobacteria collected from Lake Okeechobee
prepared in the same volume at the same initial cell density (n = 3).
were exposed and evaluated. Since microcystins are more commonly
Target exposure concentrations were prepared via addition of appro
monitored and used as a metric for risks in the lake and surrounding
priate volumes from stock solutions to site water in beakers for all for
waters, the focus of potential toxin release and persistence in this study
mulations except for the solid peroxide formulations (GreenClean® Pro,
was therefore on microcystins.
PAK® 27, and Phycomycin® SCP). For these formulations, the appro
This study was conducted to bolster the peer-reviewed database for
priate mass of product was weighed and added directly to the site water
available management strategies targeting microcystin-producing cya
containing cyanobacteria. Solutions with amended granular algaecides
nobacteria in Lake Okeechobee and surrounding waters. A laboratory-
were then inverted until the granules completely dissolved. For the
scale evaluation can be utilized as a first step in this process to mini
duration of the experiment, treatment vessels were maintained at
mize uncertainty at larger scales and provide confidence in decision-
21–23 ◦ C and illuminated with cool white fluorescent bulbs (6800 K) at
making. The overall objective of this study was to measure and
compare effects of several EPA-registered algaecide formulations on
microcystin-producing cyanobacteria collected from Lake Okeechobee. Table 1
Algaecide formulations and exposure concentrations evaluated in this study.
Specific objectives were to 1) collect samples containing microcystin-
producing cyanobacteria from Lake Okeechobee, 2) measure responses Trade Name Range of Concentrations Concentrations in terms of
of site-collected cyanobacteria to exposures of USEPA-registered algae Evaluated as Active application concentration of
Ingredient product
cide formulations in terms of cell density, chlorophyll-a concentrations,
and phycocyanin concentrations 3 DAT, 3) discern minimum effective Algimycin® PWF 0.3, 0.5, 0.7, 1.0 mg Cu/L 1.59, 2.66, 3.72, 5.31 gallons/
acre-ft Algimycin® PWF
exposure concentrations for each formulation, 4) measure and compare
Argos 0.3, 0.5, 0.7, 1.0 mg Cu/L 0.9, 1.5, 2.1, 3 gallons/acre-ft
the extent of microcystin release at 1 DAT in minimum effective expo Argos
sures, and 5) measure and compare the extent of total microcystin Captain® XTR 0.3, 0.5, 0.7, 1.0 mg Cu/L 0.9, 1.5, 2.1, 3 gallons/acre-ft
dissipation within 9 DAT in minimum effective exposures. Captain® XTR
Cutrine® Ultra 0.3, 0.5, 0.7, 1.0 mg Cu/L 0.9, 1.5, 2.1, 3 gallons/acre-ft
Cutrine® Ultra
2. Materials and methods SeClear® 0.3, 0.5, 0.7, 1.0 mg Cu/L 1.95, 3.25, 4.55, 6.5 gallons/
acre-ft SeClear®
2.1. Site collection and water characteristics GreenClean® Pro 2, 5, 7, 10 mg H2O2/L 20, 49, 69, 100 lbs/acre-ft
GreenClean® Pro
PAK® 27 2, 5, 7, 10 mg H2O2/L 20, 49, 69, 100 lbs/acre-ft
Site water and associated cyanobacteria were collected from a site on PAK® 27
the southern end of Lake Okeechobee (26◦ 42′ 15.7′′ N 80◦ 42′ 56.3′′ W) on Phycomycin® SCP 2, 5, 7, 10 mg H2O2/L 20, 49, 69, 100 lbs/acre-ft
August 7, 2019 (map included with supplementary material). The cya Phycomycin® SCP
nobacteria and site water were stored in 19-L high-density polyethylene GreenClean® Liquid 4, 10, 15, 22 mg H2O2/L 5, 13, 20, 28.5 gallons/acre-ft
5.0 GreenClean® Liquid 5.0
containers during transport to the University of Florida, Ft. Lauderdale
Hydrothol® 191 0.15, 0.3, 0.5, and 1.0 mg 0.225, 0.45, 0.75, 1.5 gallons/
Research and Education Center in Davie, FL. At the laboratory, water endothall acid/L acre-ft Hydrothol® 191
characteristics including dissolved oxygen, temperature, specific GreenClean Liquid 4, 10, 15, 22 mg H2O2/L 5, 13, 20, 28.5 gallons/acre-ft
conductance, and pH were measured using a YSI Multiparameter Sonde 5.0 + Hydrothol® each mixed with 0.3 mg GreenClean Liquid 5.0 and
(Model EXO3; YSI, Inc.). Alkalinity and hardness were measured using 191 endothall acid/L 0.45 gallons/acre-ft
Hydrothol® 191
titrations (Standard Methods 2320 B and 2340 B, respectively; APHA,
3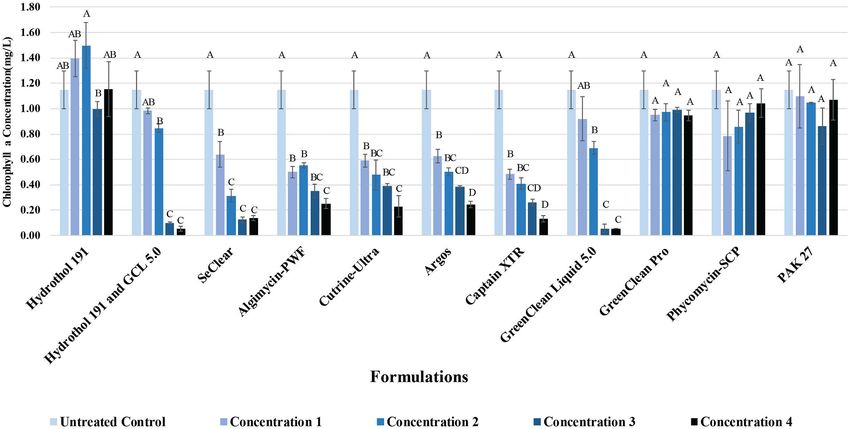
C. Kinley-Baird et al. Ecotoxicology and Environmental Safety 207 (2021) 111233
1.9–2.0 k LUX for a 12:12-h light: dark photoperiod (to provide suitable microcystin concentrations were measured in these treatments at 4 and
and realistic growing conditions for the site collected cyanobacteria), 9 DAT to evaluate the relative dissipation of microcystins among the
and were loosely covered with colorless, transparent plastic film to treatments, based on half-lives that have previously been reported in
decrease evaporation. peer-reviewed studies.
Water samples were collected immediately following exposure
initiation to confirm concentrations of active ingredients (copper, 2.5. Statistical analyses
hydrogen peroxide, and endothall) in each treatment replicate (where
those active ingredients were relevant to measure) and untreated control All data were analyzed using JMP® Pro 12.0.1 (SAS Institute, Cary,
replicate. Copper concentrations from exposures of the copper-based NC; α = 0.05). To discern the minimum effective exposure concentration
algaecides were measured by analysis of acid soluble copper using for each formulation or combination of formulations, responses in terms
inductively coupled plasma optical emission spectrometry (ICP-OES; of 3 DAT cell density, chlorophyll-a concentrations, and phycocyanin
PerkinElmer Avio™ 200) according to USEPA Method 200.7 (USEPA, concentrations were compared using least squares regression analysis.
2001). Hydrogen peroxide concentrations were measured using a The minimum effective exposure concentration for each formulation is
colorimetric method (Klassen et al., 1994; Kinley et al., 2015). Endothall defined here as the lowest concentration at which no statistically sig
concentrations were measured using enzyme-linked immunosorbent nificant increases in response are achieved with increase in concentra
assay (ELISA) (Hunt et al., 2015). tion. This is the lowest exposure concentration with the maximum
measurable effects to target cyanobacteria based on the 3 response pa
2.3. Evaluation of cyanobacteria responses to algaecide exposures rameters evaluated.
Analysis of variance (ANOVA) was used to analyze for differences
Cyanobacterial responses were measured at 72-h following exposure among the untreated control and exposure concentrations within each
initiations (3 days after treatment [DAT]). For these measurements, formulation, with specific differences identified through multiple com
samples were collected from the center of homogenized treatment parisons testing (Tukey’s test). Linear contrasts were used to gain sta
chambers. Responses were measured in terms of cell densities and tistical power for comparisons of specific pairs where further
pigment concentrations (chlorophyll-a and phycocyanin) for all exper clarification was necessary (i.e. difference between two highest expo
imental treatments and untreated controls. Cell densities were sure concentrations). If there were conflicting results among the 3
enumerated using a Bürker-Turk counting chamber with spring clips at response parameters in terms of the minimum effective concentration,
400× magnification on a compound epi-fluorescent microscope both concentrations were reported.
(Amscope XYL-606). Pigments (chlorophyll-a and phycocyanin) were The extent of microcystin release measured 1 DAT was compared
extracted from cyanobacteria cells according to Yepremian et al. (2017a, using the same statistical procedures, where ANOVA was first used to
2017b). Pigment concentrations were measured spectrophotometrically analyze for differences between the fraction of total microcystins in the
(Biomate 3, Thermo Electron spectrophotometer) at 664 nm and 620 nm aqueous phase in the untreated control and all treatments, and specific
for chlorophyll-a and phycocyanin, respectively. Linear regressions of a differences between treatments were identified through multiple com
series of concentrations of chlorophyll-a and phycocyanin standard parisons testing (Tukey’s test). Total microcystin concentrations were
(Millipore Sigma) solutions were used to calculate pigment concentra compared between the untreated control and measurements collected at
tions from measured absorbances. 1, 4, and 9 DAT for each treatment to discern differences from the un
treated control at each time point.
2.4. Microcystin release and dissipation
3. Results
Total and aqueous microcystin concentrations were measured using
ELISA following the manufacturer’s protocol (Abraxis®, Warminster, 3.1. Exposure concentrations of active ingredients
PA, USA). Total microcystins are defined here as the microcystin con
centration measured following 3 freeze-thaw cycles without filtration The average percent errors between targeted and measured exposure
(sum of intra- and extracellular microcystin concentrations). Aqueous concentrations of active ingredients were 6% ± 6% (1 standard devia
microcystins were measured from the filtrate of a 0.45 μm poly tion [SD]) for copper exposures, 38% ± 14% (1 SD) for peroxide expo
ethersulfone (PES) filter without a freeze-thaw cycle. To confirm that sures, and 41% ± 12% (1 SD) for endothall exposures applied
microcystins were not adsorbed by the filters used, an analytical stan individually (Supplementary Material). Average percent errors calcu
dard containing 5 μg/L microcystin was filtered twice through a PES lated for peroxide and endothall exposures applied in combination were
filter. The standard error, calculated as a comparison of the unfiltered 21% ± 3% (1 SD) for peroxide and 34% ± 7% (1 SD) for endothall
standard to the twice-filtered standard, was 4% which is within the (Supplementary Material). The relative percent errors were within the
percent error anticipated for measurements using ELISA. range for those anticipated based on the matrix (i.e., surface water and
Total and aqueous microcystin concentrations were first measured in cyanobacteria) and analytical techniques utilized to measure copper
the initial homogenized batch of site water and cyanobacteria (that was (2%–20%; Calomeni et al., 2014; Calomeni et al., 2018b) and peroxide
distributed among experimental treatments) before the exposures were exposures (22%–36%; Geer et al., 2016; Geer et al., 2017). Measured
initiated. At 1 DAT, total and aqueous microcystin concentrations were concentrations for the two treatments containing endothall were
measured from homogenized treatment vessels to provide data on consistently lower than the targeted concentrations (Supplementary
comparative microcystin release among algaecide formulations. This Material). Since measured exposures were less than targeted exposures,
time point was selected for these measurements since in prior experi all results are presented in terms of the measured concentrations.
ments, the greatest extent of microcystin release has been observed at
24-h after algaecide treatments (Iwinski et al., 2016; Kinley et al., 2017). 3.2. Site-collected cyanobacteria responses to algaecide exposures in
Cellular microcystin concentrations were calculated by subtracting the terms of cell density, chlorophyll-a concentrations, and phycocyanin
aqueous microcystin from the total microcystin concentration. At 3 DAT, concentrations and minimum effective exposure concentrations
percent saturation of dissolved oxygen in experimental chambers
decreased to less than 40% saturation, or less than 4 mg O2/L. Aeration Cell densities were measured before and after treatments as a line of
was added to the effective treatments for which microcystins continued evidence for cyanobacteria responses at the individual level. From
to be measured, to reflect natural settings and promote conditions exposure initiation to 3 DAT, cell densities in untreated controls
suitable for aerobic microcystin-degrading bacteria. Total and aqueous significantly increased from 6.14 × 10⁶ cells/mL to 8.06 × 10⁶ cells/mL
4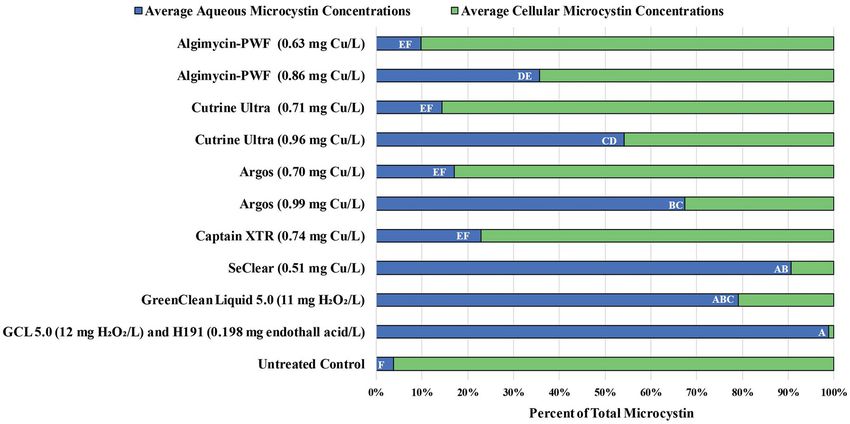
C. Kinley-Baird et al. Ecotoxicology and Environmental Safety 207 (2021) 111233
(p = 0.0041; α = 0.05), indicating that cyanobacteria in untreated effective exposure was 0.139 mg endothall acid/L. However, since the
controls remained viable during the study duration. maximum measured responses from these formulations were less than
Among the copper-based formulations, SeClear® achieved the the other formulations in preceding paragraphs, the highest evaluated
greatest decline in average cell densities, with multiple exposure con concentrations were treated as the minimum effective exposures for
centrations resulting in >90% decreases compared to the untreated further analysis. The highest exposure concentrations evaluated for the
control. Responses of cyanobacteria to the three highest concentrations solid hydrogen peroxide-based formulations (GreenClean® Pro, PAK®
of SeClear® evaluated (0.51–1.01 mg Cu/L) were significantly different 27, and Phycomycin® SCP) and Hydrothol® 191 (applied as a single
from the untreated control and the lowest exposure evaluated, but formulation) resulted in decreases ranging from 34 to 48% in cell den
similar to each other (p = 0.9634–0.9994; Fig. 1), thus, the minimum sity relative to the untreated control 3 DAT (Fig. 1).
effective exposure concentration of SeClear® based on cell density was Responses of cyanobacteria in terms of declines in chlorophyll-a
0.51 mg Cu/L. For the chelated copper-based formulations (Algimycin® concentrations were slightly less sensitive than cell densities, but similar
PWF, Argos, Captain® XTR, and Cutrine® Ultra), the second to highest patterns in exposure-response relationships were observed (Fig. 2).
concentration (nominal concentration = 0.7 mg Cu/L) was the mini Among the copper-based formulations, 0.51 mg Cu/L was the minimum
mum effective exposure concentration (Fig. 1), meaning responses be effective concentration of SeClear®, while 0.63 and 0.74 mg Cu/L were
tween exposures targeting 0.7 and 1.0 mg Cu/L were statistically similar the minimum effective concentrations for Algimycin® PWF and Cap
for each of these formulations. The measured exposure concentrations tain® XTR, respectively. Exposures of 0.99 and 0.96 mg Cu/L were the
for these treatments were 0.63 mg Cu/L (Algimycin® PWF), 0.70 mg minimum effective concentrations for Argos and Cutrine® Ultra,
Cu/L (Argos), 0.74 mg Cu/L (Captain® XTR), and 0.71 mg Cu/L respectively. Among these exposure concentrations, declines in average
(Cutrine® Ultra). At these concentrations, declines in average cell den chlorophyll-a concentrations ranged from 70% (Algimycin® PWF) to
sities relative to untreated controls ranged from 77% (Cutrine® Ultra) to 80% (Cutrine® Ultra) (Fig. 2).
90% (Captain® XTR) (Fig. 1). GreenClean® Liquid 5.0 applied individually and in combination
The two highest concentrations of GreenClean® Liquid 5.0 evaluated with Hydrothol® 191 at the two highest concentrations resulted in
(11.4 mg H2O2/L and 17.0 mg H2O2/L) resulted in similar responses of >90% declines in chlorophyll-a relative to the untreated control (Fig. 2).
the assemblage (p = 0.9998), with declines in cell densities > 95% Responses were statistically similar between the second highest and
relative to the untreated control (Fig. 1). Thus, the minimum effective highest concentrations for these treatments (p = 1.000 for GreenClean®
exposure was 11.4 mg H2O2/L for GreenClean® Liquid 5.0 applied Liquid 5.0 applied alone and p = 0.4277 for combination). Thus, for
alone. For GreenClean® Liquid 5.0 and Hydrothol® 191 applied in GreenClean® Liquid 5.0 applied alone, the minimum effective exposure
combination, cell densities decreased by > 95% and were similar (p = concentration was 11.4 mg H2O2/L. For GreenClean® Liquid 5.0 and
0.9983) at the two greatest concentrations of peroxide (11.8 mg H2O2/L Hydrothol® 191 applied in combination, the minimum effective expo
and 17.3 mg H2O2/L). Thus, the lowest effective treatment for this sure concentration was 11.8 mg H2O2/L and 0.198 mg endothall acid/L.
combination was 11.8 mg H2O2/L mixed with 0.198 mg endothall acid/ The solid hydrogen peroxide-based algaecides resulted in between
L. 6% (PAK® 27) and 18% (GreenClean® Pro) decreases in chlorophyll-a
Among the granular peroxide formulations, the minimum effective concentrations for the highest concentration evaluated (targeting 10 mg
measured exposure concentrations were 2.9 mg/L H2O2 for Phycomy H2O2/L) relative to the untreated controls 3 DAT (Fig. 2). At the highest
cin® SCP, 3.9 mg/L H2O2 for PAK® 27, and 4.7 mg/L H2O2 for Green concentration of Hydrothol® 191 evaluated, there was a 0% decrease in
Clean® Pro. For Hydrothol® 191 applied individually, the minimum average chlorophyll-a concentrations relative to the untreated control
Fig. 1. Average cell densities 3 days after treatment (DAT) in untreated controls and experimental treatments (n = 3). Error bars represent ±1 standard deviation and
different letters indicate significant differences among concentrations of a formulation. Concentrations 1 through 4 represent increasing concentrations of each
formulation.
5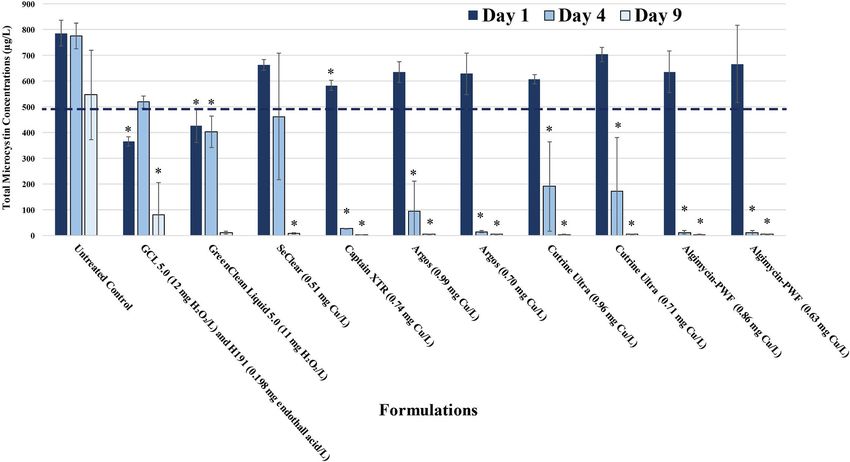
C. Kinley-Baird et al. Ecotoxicology and Environmental Safety 207 (2021) 111233
Fig. 2. Average chlorophyll-a concentrations 3 days after treatment (DAT) in untreated controls and experimental treatments (n = 3). Error bars represent ±1
standard deviation and different letters indicate significant differences among concentrations of a formulation. Concentrations 1 through 4 represent increasing
concentrations of each formulation. GCL 5.0 = GreenClean® Liquid 5.0.
(Fig. 2). Captain® XTR and Cutrine® Ultra, respectively. Exposures of 0.86 and
In terms of phycocyanin concentrations, similar exposure-response 0.99 mg Cu/L were the minimum effective concentrations for Algimy
relationships were observed as with cell densities and chlorophyll-a cin® PWF and Argos, respectively. Among these minimum effective
concentrations (Fig. 3). Among the copper-based formulations, 0.51 mg exposure concentrations, declines in average phycocyanin concentra
Cu/L was the minimum effective concentration of SeClear®, while 0.74 tions ranged from 83% (Captain® XTR) to 96% (SeClear®) (Fig. 3).
and 0.71 mg Cu/L were the minimum effective concentrations for Decreases greater than 93% were achieved at the two highest
Fig. 3. Average phycocyanin concentrations 3 days after treatment (DAT) in untreated controls and experimental treatments (n = 3). Error bars represent ±1
standard deviation and different letters indicate significant differences among concentrations of a formulation. Concentrations 1 through 4 represent increasing
concentrations of each formulation. GCL 5.0 = GreenClean® Liquid 5.0.
6
C. Kinley-Baird et al. Ecotoxicology and Environmental Safety 207 (2021) 111233
concentrations of GreenClean® Liquid 5.0 applied alone and in combi 79% of the microcystin was in aqueous form, while the combination of
nation with Hydrothol® 191 (Fig. 3). Responses to the two highest Hydrothol® 191 and GreenClean® Liquid 5.0 resulted in 99% of total
exposure concentrations were similar for GreenClean® Liquid 5.0 microcystins in the aqueous phase (Fig. 4). The copper sulfate-based
applied alone (p = 1.000) and in combination with Hydrothol® 191 (p formulation, SeClear®, resulted in 91% of total microcystins in the
= 0.7220). Therefore, the minimum effective concentrations for these aqueous phase 1 DAT (Fig. 4). The exposures that resulted in lower
treatments were 11.4 mg H2O2/L for GreenClean® Liquid 5.0 applied proportions of microcystins in the aqueous phase 1 DAT were 0.63 mg
alone and 11.8 mg H2O2/L with 0.198 mg endothall acid/L for the Cu/L of Algimycin® PWF (10%), 0.71 mg Cu/L of Cutrine® Ultra (14%),
combination. 0.70 mg Cu/L of Argos (17%), and 0.74 mg Cu/L of Captain® XTR
Decreases in average phycocyanin concentrations achieved by the (23%). The highest evaluated exposure concentrations of Algimycin®
highest concentration evaluated of the solid hydrogen peroxide-based PWF (0.86 mg Cu/L), Argos (0.99 mg Cu/L), and Cutrine® Ultra (0.96
algaecides were 9% (Phycomycin® SCP), 12% (PAK® 27), and 39% mg Cu/L) resulted in 36%, 67%, and 54% of total microcystins in the
(GreenClean® Pro). The greatest percent decrease in phycocyanin con aqueous phase at 1 DAT, respectively. Overall, in terms of percent
centrations elicited by Hydrothol® 191 was 44%, following an exposure microcystin release, the chelated copper formulations applied at a
concentration of 0.67 mg endothall acid/L (Fig. 3). nominal concentration of 0.7 mg Cu/L were similar to the untreated
Based on the 3 response parameters evaluated, the minimum effec control and significantly different from SeClear® and GreenClean®
tive exposure concentrations for the evaluated formulations were as Liquid 5.0 applied individually and in combination with Hydrothol®
follows: Algimycin® PWF: 0.63 and 0.86 mg Cu/L; Argos: 0.7 and 0.99 191 (Fig. 4).
mg Cu/L; Captain® XTR: 0.74 mg Cu/L; Cutrine® Ultra: 0.71 and 0.96
mg Cu/L; SeClear®: 0.51 mg Cu/L; GreenClean® Liquid 5.0: 11.4 mg
H2O2/L; GreenClean® Liquid 5.0 + Hydrothol® 191: 11.8 mg H2O2/L + 3.4. Dissipation of total (sum of cellular and aqueous) microcystin
0.198 mg endothall acid/L; GreenClean® Pro: 6 mg H2O2/L; PAK® 27:
7.6 mg H2O2/L; Phycomycin® SCP: 6.8 mg H2O2/L; Hydrothol® 191: Average total microcystin concentrations increased in untreated
0.66 mg endothall acid/L. The more effective formulations overall controls from 491 ± 94 μg/L at experiment initiation to 787 ± 49 μg/L at
included all the copper-based products, GreenClean® Liquid 5.0, and 1 DAT and decreased slightly to 776 ± 51 μg/L at 4 DAT (Fig. 5). Total
the combination of GreenClean® Liquid 5.0 with Hydrothol® 191. Thus, microcystin concentrations remained elevated at 9 DAT and averaged
subsequent results regarding microcystin release and persistence are 547 ± 173 μg/L in untreated controls. At 1 DAT, total microcystin
reported for these formulations and their minimum effective exposure concentrations decreased significantly relative to untreated controls for
concentrations. the combination of Hydrothol® 191 and GreenClean® Liquid 5.0 as well
as GreenClean® Liquid 5.0 and Captain® XTR applied individually
(Fig. 5), to concentrations of 366, 427, and 584 μg/L, respectively. In all
3.3. Extent of microcystin release other exposures, total microcystin concentrations remained similar to
untreated controls 1 DAT (Fig. 5).
To address concurrent questions about microcystin release and By 4 DAT, all exposures except for SeClear® and Hydrothol® 191 +
dissipation, exposures that were deemed effective based on the magni GreenClean® Liquid 5.0 applied in combination resulted in significant
tude of cyanobacterial response (i.e., cell density, chlorophyll-a, and decreases in total microcystin concentrations relative to untreated
phycocyanin concentrations) were further evaluated. Total and aqueous controls (Fig. 5). For example, average total microcystin concentrations
microcystin concentrations in the untreated controls 1 DAT were 787 ± were 28 μg/L for Captain® XTR (0.74 mg Cu/L), 16 μg/L for Argos (0.70
49 μg/L and
C. Kinley-Baird et al. Ecotoxicology and Environmental Safety 207 (2021) 111233
Fig. 5. Total microcystin concentrations measured on 1, 4 and 9 days after treatment (DAT) for each effective exposure (n = 3). Error bars represent ±1 standard
deviation and asterisks indicate significant differences from the untreated control on the same day after exposure initiation. The dotted line indicates the average
total microcystin concentration at experiment initiation (Day 0). GCL 5.0 = GreenClean® Liquid 5.0 and H191 = Hydrothol® 191.
microcystin concentrations decreased to less than 10 μg/L for all expo utility in different situations for both demonstration and full-scale
sures except for GreenClean® Liquid 5.0 applied individually and in treatments. Each demonstration and full-scale site is unique in terms
combination with Hydrothol® 191. of its designated uses, defined problem, and management goals, and
those parameters must be considered to identify a specific formulation
4. Discussion for management.
4.1. Responses of site-collected cyanobacteria to algaecide exposures 4.2. Extent of microcystin release following algaecide exposures
The species Microcystis aeruginosa and Pseudanabaena mucicola In prior studies (Iwinski et al., 2016; Kinley et al., 2017) and in the
identified in the cyanobacterial assemblage from Lake Okeechobee and present study, the data show that the viability of cyanobacterial cells can
used in this study are common and were previously identified in samples significantly decrease following exposure to algaecides, while micro
collected from the lake during the 2016 bloom (Rosen et al., 2017) and cystin release is minimal. Among several of the effective algaecides and
Microcystis was identified from the 2018 bloom (Krimsky et al., 2018). exposure concentrations, less than 20% of the total microcystin con
Differences in responses of microcystin-producing cyanobacteria to centrations were in the aqueous phase 1 DAT. These results emphasize
algaecide exposures were apparent in this study. All copper-based al that laboratory experiments can be used to identify appropriate algae
gaecides and the liquid hydrogen peroxide-based algaecide evaluated cides if minimizing toxin release is a management priority. Target sites
were more effective than the granular hydrogen peroxide-based algae for this approach would include areas near intake structures for drinking
cides and the endothall-based algaecide evaluated. These differences water treatment plants. However, at other sites, minimizing toxin
were likely due to intrinsic factors including relative sensitivities of the release is not a priority, since total microcystins (i.e. sum of intracellular
site-specific cyanobacteria as well as factors that modify the effective and dissolved forms) are the relevant source of risk in scenarios where
ness among algaecide formulations such as pH, hardness, temperature, protection of aquatic life or protection of human health is the manage
particulate and dissolved organic carbon, and cell density of the target ment goal. It is important to emphasize that release of microcystins from
assemblage (Fitzgerald, 1964). In these toxicity experiments, a relatively cells does not increase potential for risk, contrary to what is commonly
high cell density was evaluated (6 × 10⁶ cells/mL); therefore, formu perceived and propagated.
lations with greater potencies applied at higher concentrations were
necessary to measure responses in cyanobacteria (Kinley et al., 2017). 4.3. Dissipation of microcystins after algaecide exposures
This cell density was intentionally targeted to reflect conditions
commonly observed in the field so that robust, effective products could By 4 DAT, total microcystin concentrations significantly declined
be identified, and so that release and decline of microcystins could be (compared to untreated controls) in nearly all algaecide formulations
accurately measured. At relatively lower cell densities (e.g., ≤ 1 × 10⁶ evaluated, except for SeClear® and GreenClean® Liquid 5.0 applied
cells/mL), it is likely that lower concentrations of the effective formu individually and in combination with Hydrothol® 191. By 9 DAT, total
lations would be needed to achieve comparable responses, and other microcystin concentrations declined to less than 10 μg/L in all treat
apparently less effective formulations in this study could achieve greater ments except for GreenClean® Liquid 5.0 applied individually and in
cyanobacterial responses than what was observed. Results from these combination with Hydrothol® 191. Ultimately, demonstration-scale
experiments do not warrant exclusion of certain formulations from studies will be necessary to measure rates of microcystin dissipation
further evaluation and all the formulations evaluated in this study have after algaecide treatments to test these hypotheses under more realistic
8C. Kinley-Baird et al. Ecotoxicology and Environmental Safety 207 (2021) 111233
conditions. Dilution and dispersion are often dominant aqueous fate 4.4. Comparative toxicity data to inform scaling
processes in aquatic systems that could drastically alter overall rates of
microcystin dissipation. In addition, presence of sediments with abun The goal of this study was to provide laboratory data that would be
dant microbial communities can support more rapid breakdown of necessary for scaling algaecide treatments for demonstration-scale
cyanobacteria cells and microcystins after treatments. Ultimately, each studies and full-scale applications. Since the context of this study was
site is different and knowledge of the site characteristics, especially focused on management of microcystin-producing cyanobacteria in
parameters like flow rate and water residence time, will be beneficial to Lake Okeechobee and nearby waters, the laboratory experiments con
predicting microcystin dissipation rate in the field. At treatment sites ducted were designed to provide information needed for those sites.
where water residence time is relatively longer (i.e. narrow, isolated Given the enormity of Lake Okeechobee, algaecides will not be applied
homeowner canals) due to lower flow rates (meaning dilution and to the entire surface area. In larger systems, priority areas can be
dispersion may not be the dominant fate processes), or at sites where designated as management units in which there are specific designated
there are known sensitive or listed species present, selection of formu uses and management goals, and that information can guide evaluation
lations that demonstrate lesser impacts on microcystin dissipation (in and identification of effective algaecides. For example, the towns/cities
the laboratory and field) can help minimize potential for risk. of Pahokee, Belle Glade, Okeechobee, Clewiston, South Bay, and Bryant
Demonstration-scale studies will help further refine identification and use surface water from Lake Okeechobee for potable water supply. If a
selection of specific products for different types of sites. management plan (using algaecides) was developed for these intake
areas, the priority could be focused on identifying effective algaecides
that result in minimal microcystin (or other toxin) release and persis
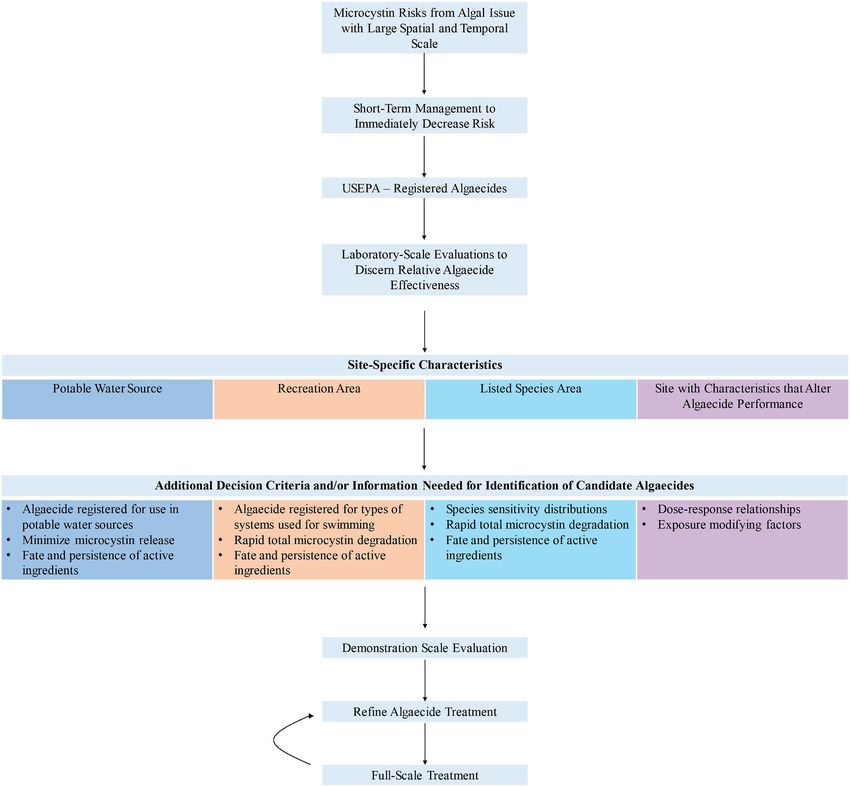
tence (Fig. 6). At sites where recreation (e.g., boating, fishing, and
Fig. 6. Conceptual model for identification of candidate algaecide formulations and concentrations for treatment of microcystin producing cyanobacteria in Lake
Okeechobee and surrounding areas.
9C. Kinley-Baird et al. Ecotoxicology and Environmental Safety 207 (2021) 111233
swimming) is prevalent, or water residence time is relatively longer, the hypotheses under more realistic conditions with relevant fate processes
priority could be focused on identifying effective algaecides that do not including dilution, dispersion, and microbial degradation at the
demonstrate lags in toxin dissipation after treatment (Fig. 6). Similarly, sediment-water interface.
at sites where there are threatened or endangered aquatic species, a Laboratory-scale experiments can provide data and information
criterion of minimizing microcystin persistence could be established necessary to identify effective formulations and application concentra
when identifying an effective formulation, since microcystins are a tions for implementation at larger scales. Since every management site
source of risk for aquatic life. differs in terms of water characteristics, target cyanobacterial species,
At all sites, certain characteristics will be crucial for scaling algaecide cell densities of target assemblages, and designated uses of the water
applications. Due to the size of Lake Okeechobee and surrounding areas, resource, laboratory-scale evaluations of algaecide performance can
water characteristics that impact algaecide effectiveness are anticipated provide site-specific data, thereby minimizing uncertainties of outcomes
to vary from site to site. Similarly, the genera and species of cyano for full-scale algaecide applications. Thus, this study demonstrates a
bacteria, and cell densities present at the time of treatment usually differ physical framework for how those studies can be conducted for a specific
spatially and temporally. The data generated from this study for a broad site. Importantly, the comparative toxicity data and approach provided
range of USEPA-registered algaecides in addition to the breadth of in this study demonstrate the initial steps for development of site-
literature available for USEPA-registered algaecides can be used to make specific management strategies for Lake Okeechobee and other areas
informed decisions on use of specific algaecides depending on the impacted by harmful algal blooms with large spatial and temporal
combination of factors that may occur at a site (Fig. 6). Although these scales.
studies were targeted for the Lake Okeechobee area, the approach taken
is widely applicable and can be used to identify effective formulations Credit author statement
and exposure concentrations of algaecides for control of harmful or
nuisance algae for a variety of aquatic systems when considering the Ciera Kinley-Baird: Conceptualization, Funding acquisition, Investi
appropriate site-specific parameters. gation, Project administration, Formal analysis, Supervision, Validation,
This study provides data and useful information to bolster the Writing (Writing - original draft, review, and editing), Alyssa Calomeni:
knowledge base on available management strategies for microcystin- Conceptualization, Project administration, Investigation, Methodology,
producing cyanobacteria in and around Lake Okeechobee. As fre Supervision, Formal analysis, Writing (Writing - original draft, review,
quency, duration, and intensity of HABs increase in Florida and across and editing), David Berthold: Investigation, Resources, Forrest Lefler:
the United States (and globally), and there is more public and political Investigation, Resources, Max Barbosa: Investigation, Resources, John
pressure for sound solutions, science-driven management is crucial. To Rodgers: Conceptualization, Funding acquisition, writing (Writing -
justify expenses associated with management of HABs in freshwater original draft), Dail Laughinghouse: Funding acquisition, Investigation,
resources, certain decision-making criteria must be met. These include Methodology, Resources, writing (Writing - original draft, review, and
effectiveness, durability, availability, scalability, selectivity, non-target editing)
species risks, and more. All available management tactics for HABs
(physical, chemical, and biological) can be rigorously scrutinized
against these criteria to support environmentally defensible, socially Declaration of competing interest
acceptable, and economically feasible management decisions.
The authors declare that they have no known competing financial
5. Conclusions interests or personal relationships that could have appeared to influence
the work reported in this paper.
In this study, the overall objective was to evaluate the comparative
effectiveness of selected USEPA-registered algaecides against Acknowledgements
microcystin-producing cyanobacteria collected from Lake Okeechobee.
The purpose of conducting these experiments was to bolster the data The authors thank the Aquatic Ecosystem Restoration Foundation
base on available short-term management strategies for harmful cya (AERF) for financial support for this study. Dr. Haywood Dail Laugh
nobacteria in freshwater resources of the Lake Okeechobee waterway. inghouse IV would like to acknowledge the USDA-NIFA Hatch Project
Responses of the site-collected cyanobacteria following these treatments #FLA-FTL-00565697.
were measured using several lines of evidence. Microcystin release and
dissipation after algaecide exposures were also measured among the Appendix A. Supplementary data
formulations to provide those comparative data at the laboratory scale.
Results from comparative toxicity experiments show that several of Supplementary data to this article can be found online at https://doi.
the evaluated formulations resulted in significant and environmentally org/10.1016/j.ecoenv.2020.111233.
relevant declines in cell densities and photosynthetic pigments of target
cyanobacteria 3 DAT. These formulations included a liquid hydrogen References
peroxide-based algaecide, GreenClean® Liquid 5.0, applied individually
and in combination with an endothall-based algaecide, Hydrothol® 191, Alvarez, S., Lupi, F., Solis, D., Thomas, M., 2019. Valuing provision scenarios of coastal
ecosystem services: the case of boat ramp closures due to harmful algal blooms in
as well as the copper-based products (Algimycin® PWF, Argos, Cap Florida. Water 11, 1250. https://doi.org/10.3390/w11061250.
tain® XTR, Cutrine® Ultra, and SeClear®). American Public Health Association (APHA), 2017. Standard Methods for the
The chelated copper-based formulations (Algimycin® PWF, Argos, Examination of Water and Wastewater, 23rd ed. American Public Health Association,
Washington, DC.
Captain® XTR, and Cutrine® Ultra) resulted in a lesser extent of Bishop, W.M., Rodgers, J.H., 2011. Responses of Lyngbya magnifica Gardner to
microcystin release 1 DAT than the other evaluated formulations. The analgaecide exposure in the laboratory and field. Ecotoxicol. Environ. Saf. 74 (7),
chelated copper-based formulations also resulted in relatively lower 1832–1838.
Calomeni, A., Rodgers, J.H., Kinley, C.M., 2014. Responses of Planktothrix agardhii and
total microcystin concentrations by 4 DAT, and all evaluated formula
Pseudokirchneriella subcapitata to copper sulfate (CuSO4⋅ 5H2O) and a chelated
tions resulted in significantly lower total microcystin concentrations copper compound (Cutrine®-Ultra). Water, Air, Soil Pollut. 225 (12), 2231.
than the untreated control by 9 DAT. At 9 DAT, most of the treatment Calomeni, A.J., Iwinski, K.J., Kinley, C.M., McQueen, A., Rodgers Jr., J.H., 2015.
vessels containedYou can also read