Economic and Market Overview - March 2022
←
→
Page content transcription
If your browser does not render page correctly, please read the page content below
Economic and Market Overview
March 2022

150 West Main Street, Suite 1700 | Norfolk, Virginia 23510
www.wstam.com | 757.623.3676
Executive Overview

   Transition Risks Mount As We Enter 2022
        •   Global growth still strong, but slowing
        •   Monetary policy still accommodative, but tightening
        •   COVID better understood, but still surprising
        •   Inflation remains the key variable
        •   Geopolitical tensions with China, Russia and Iran add to uncertainty
        •   Valuations across most asset classes are extended

   Equities: Stocks Surge in 4Q To Cap Amazing Year
        • Market rotates back to U.S. large cap; small-cap and non-U.S. lag
        • Valuations suggest lower returns ahead
        • Looking for leadership shift to international, value and small stocks

   Bonds: Fixed Income Investors Endure Rare Negative Year
        •   Inflation maybe not so transitory
        •   Yield curve flattens as Fed Shifts more hawkish and growth slows
        •   Bonds offer minimal compensation for additional duration risk
        •   Continue to overweight credit exposure

             Some of the information enclosed may represent opinions of WST which are subject to change from time to time and which do not constitute a recommendation to purchase and sale any security nor to
             engage in any particular investment strategy. There are no guarantees investment objectives will be met.
                                                                                                                                                                                                                  2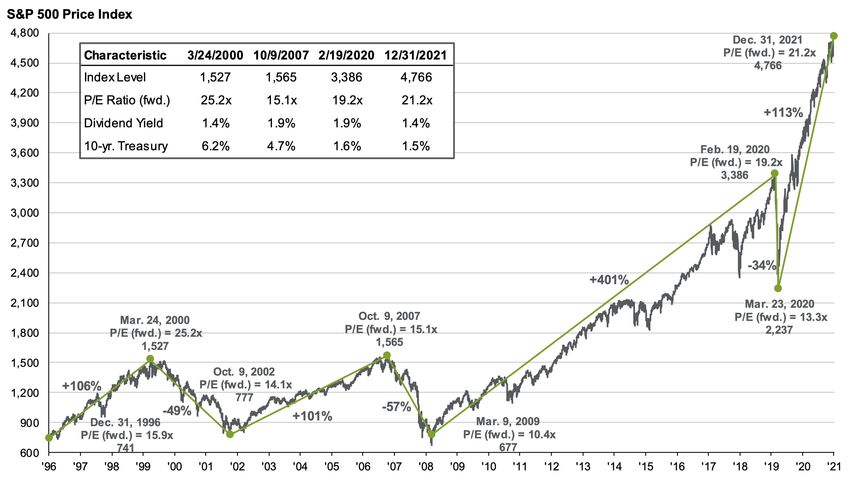
Economic Growth Remains Strong

                                 3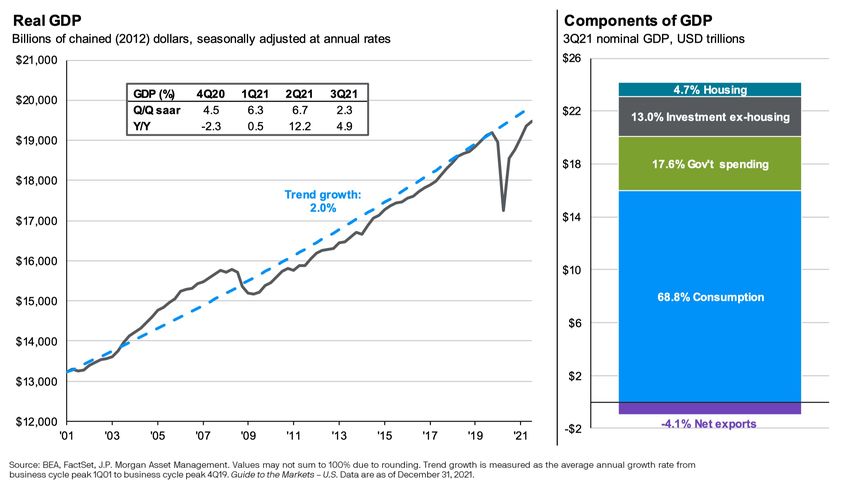
Fed Needs To Thread The Needle On Pace Of Tightening

                                                       4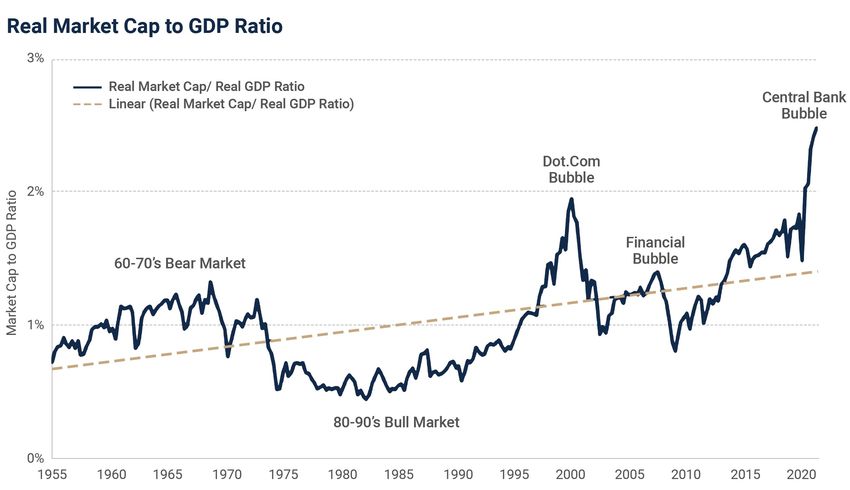
COVID -19 Remains A Wildcard in 2022

           Source: Apple SmartNews
                                       5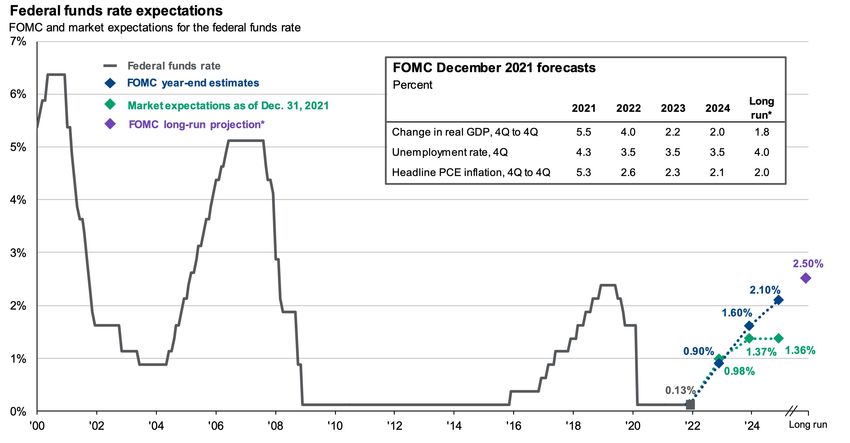
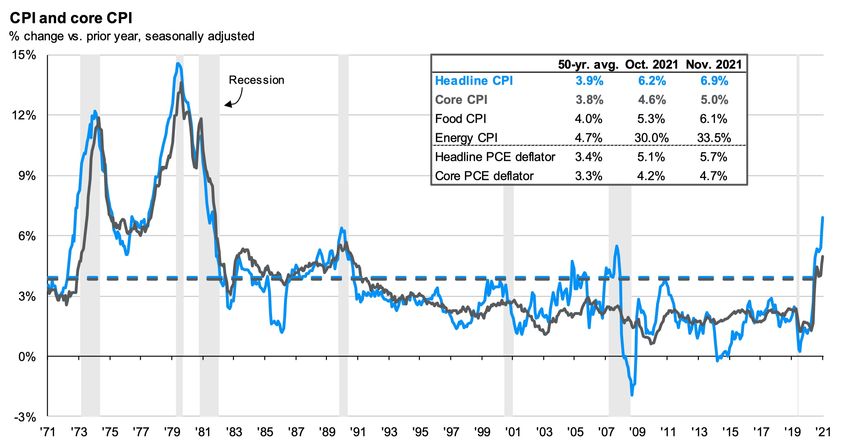
Inflation Is Key Variable

                            6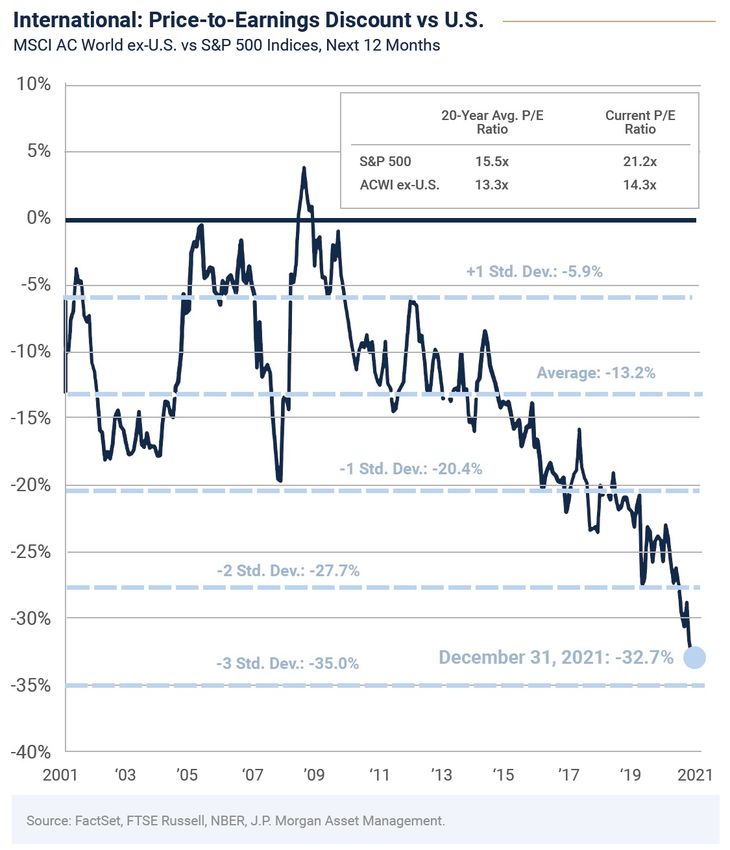
S&P 500 – Amazing Recovery Drives Stocks To Records, and High Valuations

    Source: Compustat, FactSet, Federal Reserve, Standard & Poor’s, J.P. Morgan Asset Management. Dividend yield is calculated as consensus estimates of dividends for the next 12 months, divided by most
    recent price, as provided by Compustat. Forward price-to-earnings ratio is a bottom-up calculation based on J.P. Morgan Asset Management estimates. Returns are cumulative and based on S&P 500 Index
    price movement only, and do not include the reinvestment of dividends. Past performance is not indicative of future returns. Guide to the Markets –U.S. Data are as of December 31, 2021.

                                                                                                                                                                                                             7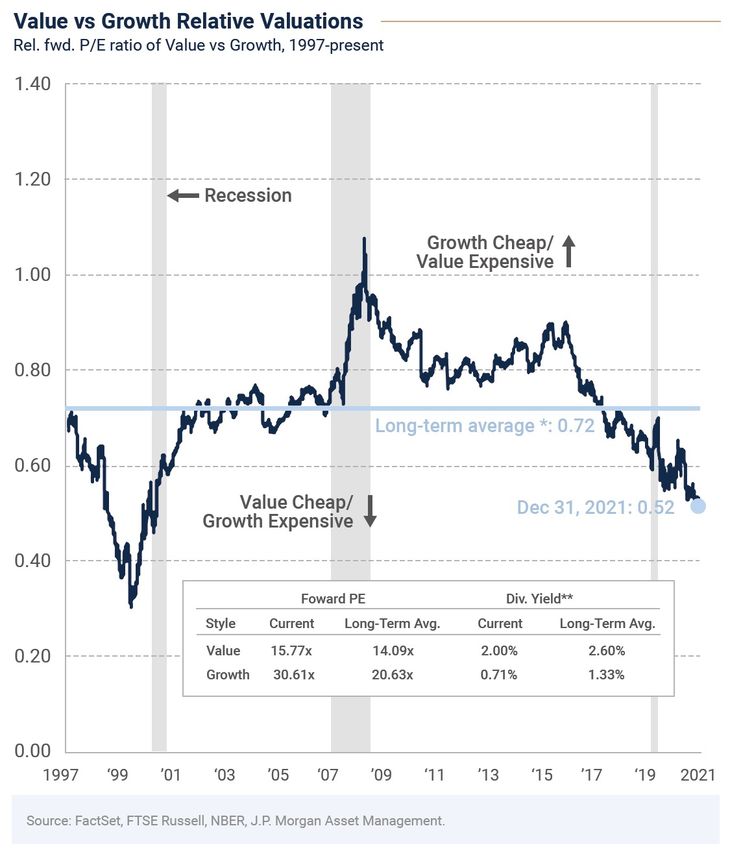
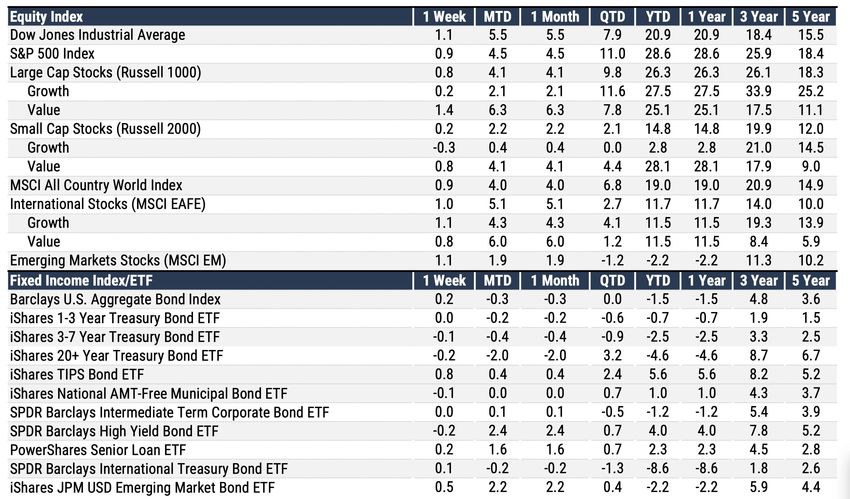
Market Returns Summary – December 31, 2021

Source: Factset.

                                             8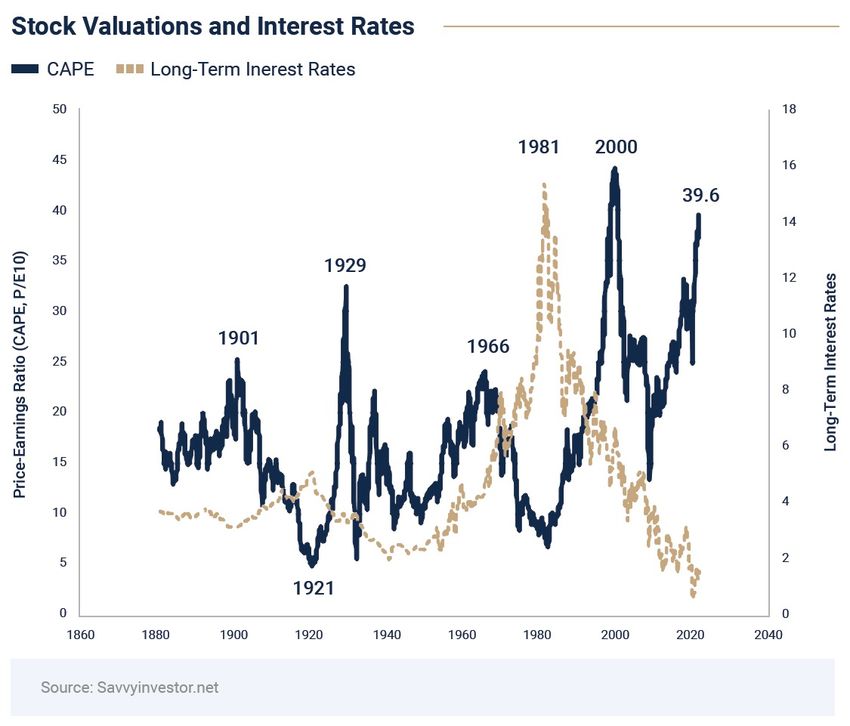
Confidence Gap Likely To Narrow This Year – One Way Or Another

                                                                 9
Stocks Are Expensive Relative to GDP

                                       10
U.S. Equity Valuations and Subsequent Returns
11Fed Rate Hikes Won’t Necessarily Derail The Bull Market
12Higher Interest Rates Will Be A Headwind
13A Possible Path to a 6% Return For The S&P 500 in 2022
Source: Goldman Sachs Asset Management 14Style: Value Versus Growth Stocks – Reversal Ahead?
15U.S. Stocks Have Enjoyed A Long Run Of Leadership
16Setting Expectations
Source: Vanguard
17Interest Rates – Bond Market Anticipates Slower Growth and Lower Inflation
U.S. Treasury Yield Curves
2.5% 2.42%
2.0% 1.91%
1.74%
1.51%
1.5% 1.65%
1.27%
1.0%
0.73% 0.94%
0.92%
0.38%
0.5% 0.36% As of December 31, 2020
As of March 31, 2021
0.10% 0.12% As of December 31, 2021
0.0%
0.07%
0 5 10 15 20 25 30
(Years)
Source: Factset. US Treasury yield curves as of 12/31/2020, 3/31/2021, and 12/31/2021.
18Summary and Game Plan
Cautious On Short-Term Outlook
• Slowing growth
• Higher Inflation
• Opaque data
• Fed policy risk
• Fiscal policy risk
Equities Remain Asset Of Choice For Long-Term Growth
• Low yields = TINA
• Valuations point to lower returns for U.S. large caps
• International stocks are relatively attractive
Bonds Still Play A Role In Portfolios, But Structure Matters
• Keeping maturities short - no compensation for additional duration risk
• Continue to overweight credit exposure if economy is healthy
Some of the information enclosed may represent opinions of WST which are subject to change from time to time and which do not constitute a recommendation to purchase and sale any security nor to
engage in any particular investment strategy. There are no guarantees investment objectives will be met.
19Disclosures
Wilbanks Smith & Thomas Asset Management , LLC (“WST”). This material is proprietary and being provided on a confidential basis, and may not be reproduced, transferred or distributed in any form without prior written
permission from WST. WST reserves the right at any time and without notice to change, amend, or cease publication of the information. This material has been prepared solely for informative purposes. The information contained
herein includes information that has been obtained from third party sources and has not been independently verified. It is made available on an "as is" basis without warranty.
Some of the information enclosed may represent opinions of WST which are subject to change from time to time and which do not constitute a recommendation to purchase and sale any security nor to engage in any particular
investment strategy. There are no guarantees investment objectives will be met.
Statements in this brochure that reflect projections or expectations of future financial or economic performance or of the market in general are forward-looking statements. No assurance can be given that actual results or events
will not differ materially from those projected, estimated, assumed or anticipated in any such forward-looking statements. Important factors that could result in such differences, in addition to the other factors noted with such
forward-looking statements, including, without limitation, general economic conditions such as inflation, recession and interest rates. Past performance is not a guarantee of future results.
Securities and Insurance Products and Services – Are not FDIC or any other Government Agency Insured – Are not Bank Guaranteed – May lose Value All information in this presentation is the property of Wilbanks Smith, &
Thomas Asset Management, LLC
Barclays US Aggregate Bond Index: Benchmark covering the USD-denominated, investment-grade, fixed-rate, taxable bond market of SEC-registered securities. The index includes bonds from the Treasury, Government-Related,
Corporate, MBS, ABS, and CMBS sectors.
Yield to Call is the yield of a bond or note if you were to buy and hold the security until the call date. This yield is valid only if the security is called prior to maturity.
Yield to Maturity is the rate of return anticipated on a bond if it is held until the maturity date.
During the period(s) shown, there were no material market or economic conditions which affected the results portrayed. With the exception of several market corrections during the period(s), the overall market as measured by the
S&P 500 was generally rising. If such trends are broken, the clients may experience real capital losses in their managed accounts.
Foreign investments involve greater risks than US investments, including political and economic risks and the risk of currency fluctuation, all of which may be magnified in emerging markets.
Market indices are unmanaged and do not reflect the deduction of fees or expenses. You cannot invest directly in an index and the performance of an index does not represent the performance of any specific investment.
Past performance is not necessarily indicative of future results. Results portrayed reflect the reinvestment of dividends, capital gains and other earnings when appropriate.
Small company issues can be subject to increased volatility and considerable price fluctuations.
Commodities and futures generally are volatile and are not suitable for all investors. The value of commodity funds relate directly to the value of the futures contracts and other assets held within the fund and any fluctuation in
the value of these assets could adversely affect an investment in commodities.
High yield bonds are rated in the lower rating categories by the various credit rating agencies, investors must take into account the special nature of such securities and certain special considerations in assessing the risk
associated with such investments. Securities in the lower rating categories are subject to greater risk of loss of principal and interest than higher-rated securities and are generally considered to be predominantly speculative with
respect to the issuer’s capacity to pay interest and repay principal.
MSCI EAFE Index: A free float-adjusted market capitalization index that is designed to measure the equity market performance of developed markets, excluding the US & Canada. The MSCI EAFE Index consists of the following 22
developed market country indices: Australia, Austria, Belgium, Denmark, Finland, France, Germany, Greece, Hong Kong, Ireland, Israel, Italy, Japan, the Netherlands, New Zealand, Norway, Portugal, Singapore, Spain, Sweden,
Switzerland, and the United Kingdom.
MSCI Emerging Markets Index: A free float-adjusted market capitalization index that is designed to measure equity market performance of emerging markets. The MSCI Emerging Markets Index consists of the following 21
emerging market country indices: Brazil, Chile, China, Colombia, Czech Republic, Egypt, Hungary, India, Indonesia, Korea, Malaysia, Mexico, Morocco, Peru, Philippines, Poland, Russia, South Africa, Taiwan, Thailand, and Turkey.
S&P 500 Index: The S&P 500 Index is a market capitalization-weighted index, including reinvestment of dividends and capital gains distributions that is generally considered representative of the U.S. stock market.
The projections or other information generated by the Vanguard Capital Markets Model® (VCMM) regarding the likelihood of various investment outcomes are hypothetical in nature, do not reflect actual investment results, and
are not guarantees of future results. Distribution of return outcomes from VCMM, derived from 10,000 simulations for U.S. equity returns and fixed income returns. Simulations as of October 31, 2013. Results from the model may
vary with each use and over time.
Projections or other information generated regarding the likelihood of various investment outcomes are hypothetical in nature, do not reflect actual investment results and are not a guarantee of future results. Assumption used or
shown may be based on information provided and reviewed by the client. Those assumptions must be reconsidered on a frequent basis to ensure that results are adjusted accordingly since any alteration in assumptions can have
a significant impact on projections. Any inaccurate or incomplete representation by the client of any facts or assumptions used herein will invalidate the projections. Actual results may also vary to a material degree due to
external factors beyond the scope and control of the projections and assumptions in this report.
20You can also read


