Q4 Quarterly Market Review - Fourth Quarter 2021 - Pacifica Wealth Advisors
←
→
Page content transcription
If your browser does not render page correctly, please read the page content below
Q4
Quarterly Market Review
         Fourth Quarter 2021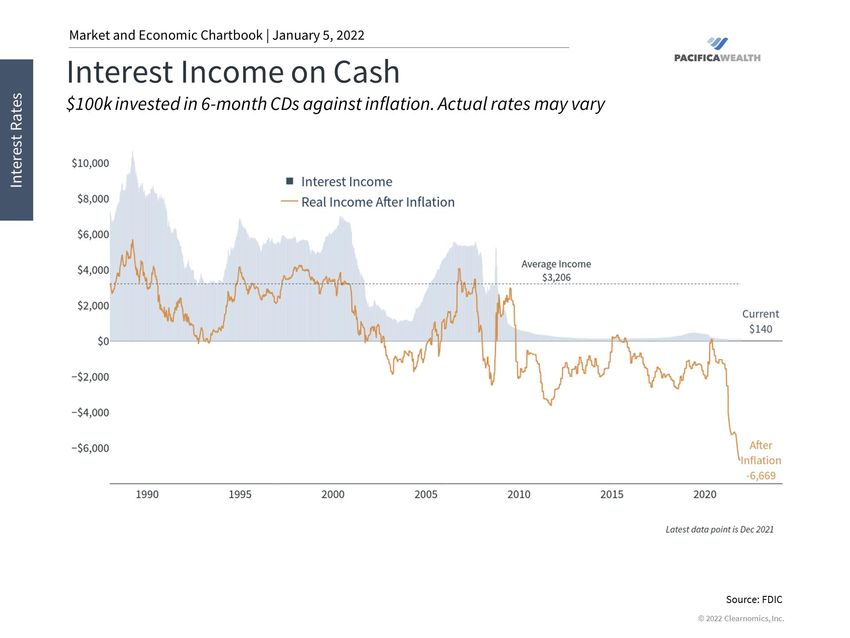
Quarterly Market Summary
Index Returns

                                                                                                                                                                                                                 Global
                                                                               International                    Emerging                      Global                                                             Bond
                                                    US Stock                   Developed                        Markets                       Real                                US Bond                        Market
                                                    Market                     Stocks                           Stocks                        Estate                              Market                         ex US

   4Q 2021                                                                                       STOCKS                                                                                            BONDS

                                                      9.28%                         3.14%                        -1.31%                        12.35%                                0.01%                         0.07%

   Since Jan. 2001

   Average
                                                       2.5%                          1.7%                          2.9%                           2.7%                                1.1%                          1.1%
   Quarterly Return

   Best                                               22.0%                         25.9%                         34.7%                         32.3%                                 4.6%                          4.6%
   Quarter
                                                    2020 Q2                       2009 Q2                       2009 Q2                       2009 Q3                              2001 Q3                       2008 Q4

   Worst                                             -22.8%                        -23.3%                         -27.6%                        -36.1%                               -3.4%                         -2.7%
   Quarter
                                                    2008 Q4                       2020 Q1                       2008 Q4                       2008 Q4                              2021 Q1                       2015 Q2

Past performance is not a guarantee of future results. Indices are not available for direct investment. Index performance does not reflect the expenses associated with the management of an actual portfolio.
Market segment (index representation) as follows: US Stock Market (Russell 3000 Index), International Developed Stocks (MSCI World ex USA Index [net dividends]), Emerging Markets (MSCI Emerging Markets Index [net
dividends]), Global Real Estate (S&P Global REIT Index [net dividends]), US Bond Market (Bloomberg US Aggregate Bond Index), and Global Bond Market ex US (Bloomberg Global Aggregate ex-USD Bond Index [hedged
to USD]). S&P data © 2022 S&P Dow Jones Indices LLC, a division of S&P Global. All rights reserved. Frank Russell Company is the source and owner of the trademarks, service marks, and copyrights related to the Russell
Indexes. MSCI data © MSCI 2022, all rights reserved. Bloomberg data provided by Bloomberg.                                                                                                                                  2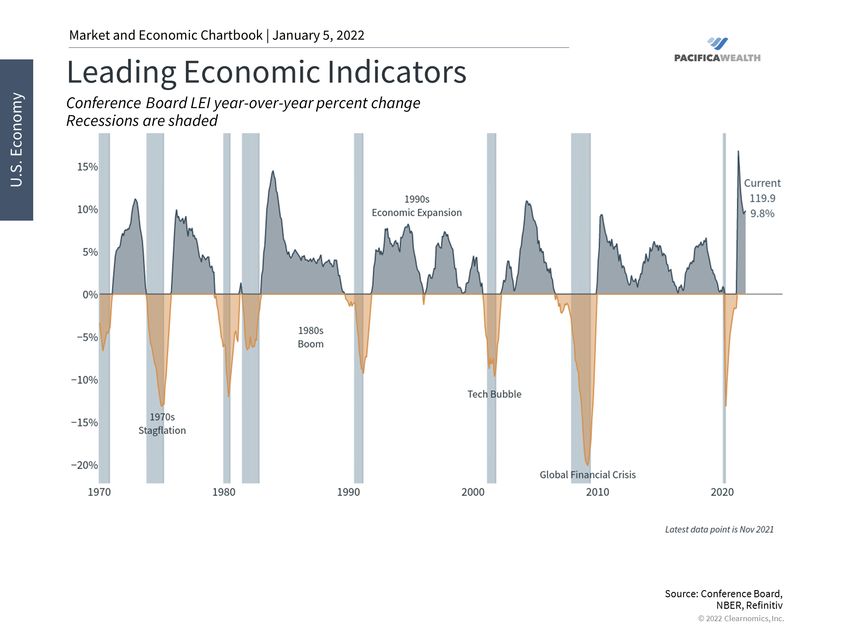
World Stock Market Performance
MSCI All Country World Index with selected headlines from past 12 months
LONG TERM (2000–Q4 2021)
400
300
200
Last 12
100
SHORT TERM (Q4 2020–Q4 2021) months
0
2000 2003 2006 2008 2011 2013 2016 2018 2021
400
380
360
340
320
300
Dec 31 Mar 31 Jun 30 Sep 30 Dec 31
“US Oil Tops
“Small Stocks $75 for First “Bitcoin Price Surges
Widen Their “In a Wild
“CDC: Fully Vaccinated Time Since Past $66,000,
Lead; Russell Year for
People Can Stop Wearing 2018” Reaching New High”
2000 Up 15% Markets,
Face Masks, End Physical Stocks
This Year” Distancing in Most Settings” “Stock Markets
“Biden Takes Pull Off
Cruise to “Nasdaq Drops 2% as Big
Office as 46th
Records in Investors Flee Shares of Gains”
President” “Bitcoin Trades
First Half” High-flying Stocks and
Above $50,000 “Eurozone Inflation
Bond Yields Lurch Higher”
for First Time” “US Existing-Home Hits Decade High as “US Inflation Hit a
“US Added 916,000 Prices Hit Record Bottlenecks Bite” 39-Year High in
“Yield on 30-year Jobs in March as High in May” “US Orders for Durable November”
Treasury Hits 2% Hiring Accelerated” Goods Hit A Record”
“US Inflation Is “CDC Urges Vaccinated People “Biden to Nominate Jerome
for First Time
Highest in 13 Years to Resume Wearing Masks Powell for Second Term as
Since Pandemic”
as Prices Surge 5%” Indoors in Some Areas” Fed Chairman”
These headlines are not offered to explain market returns. Instead, they serve as a reminder that investors should view daily events from a long-term perspective and avoid making
investment decisions based solely on the news.
Graph Source: MSCI ACWI Index [net dividends]. MSCI data © MSCI 2022, all rights reserved.
It is not possible to invest directly in an index. Performance does not reflect the expenses associated with management of an actual portfolio. Past performance is not a guarantee of future results. 3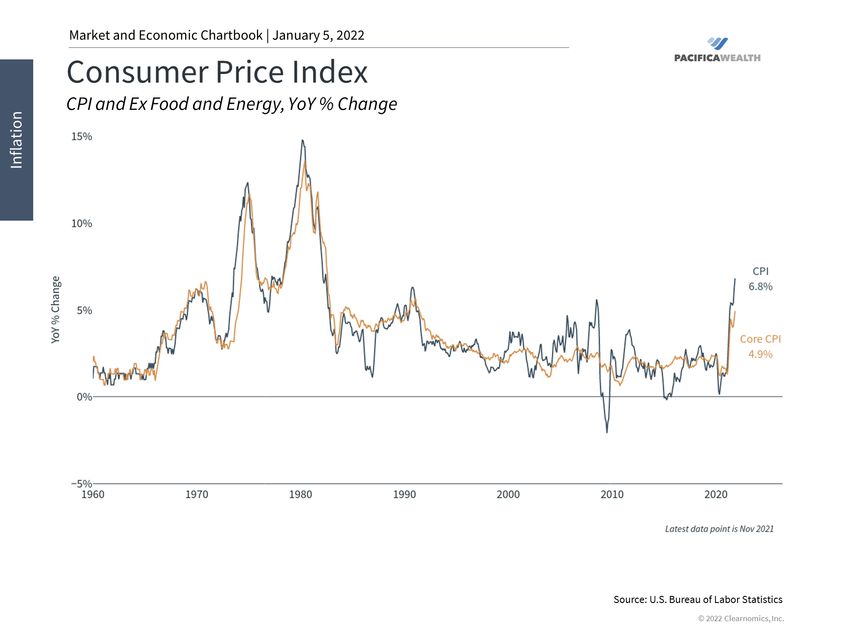
•   As this chart shows (log scale), the stock market has performed well over the past 50 years despite short-term ups
    and downs.
•   These periods of turbulence were due to economic, political and global turmoil during those decades.
•   This emphasizes the importance of staying invested, rather than focusing on days or months, especially as
    volatility rises.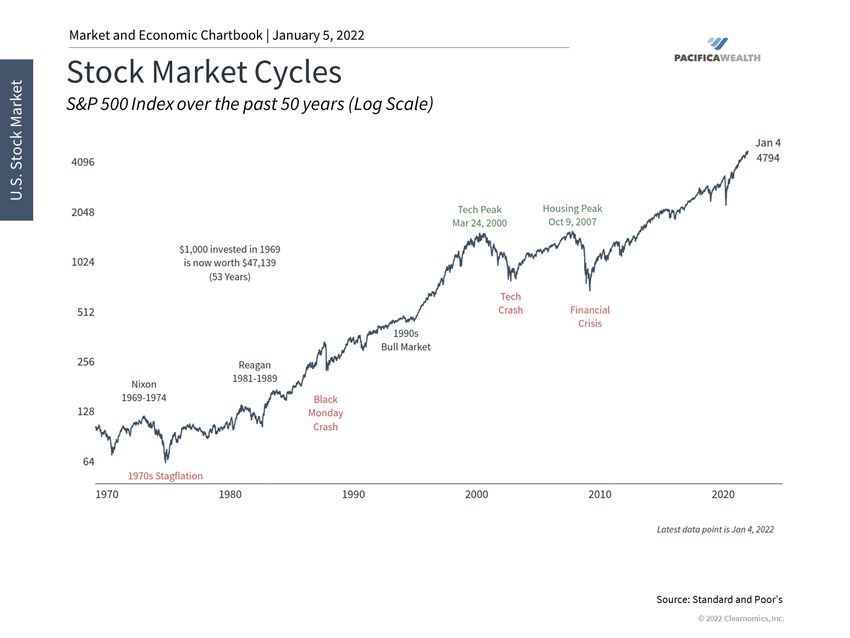
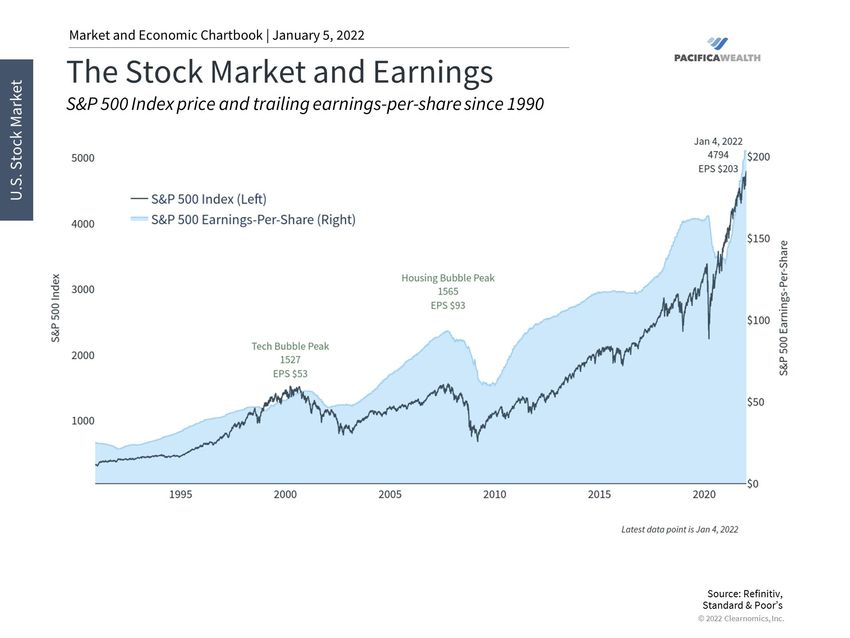
•   This chart shows the S&P 500 index alongside its trailing 12 months earnings-per-share.
•   Over the long run, the stock market tends to follow earnings. If earnings are rising, investors are willing to pay
    more per share.
•   Earnings, in turn, tend to track economic growth. Thus, a healthy economy tends to result in a rising stock market.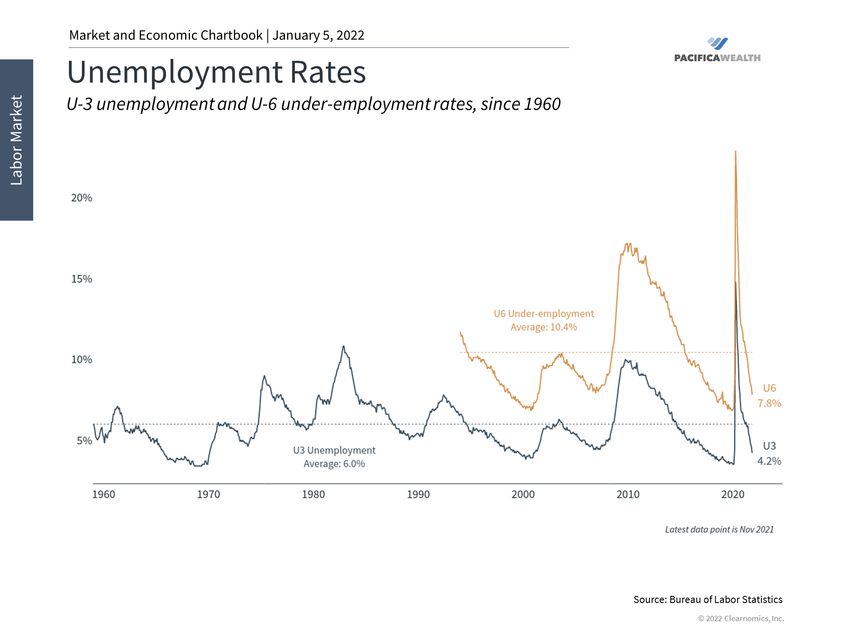
•   This chart shows the year-over-year percent change in an index of leading economic indicators.
•   This indicator usually turns negative several months before a recession. This also happened prior to the current
    crisis.
•   This pattern is also evident over the prior seven recessions and is the result of the economic cycle.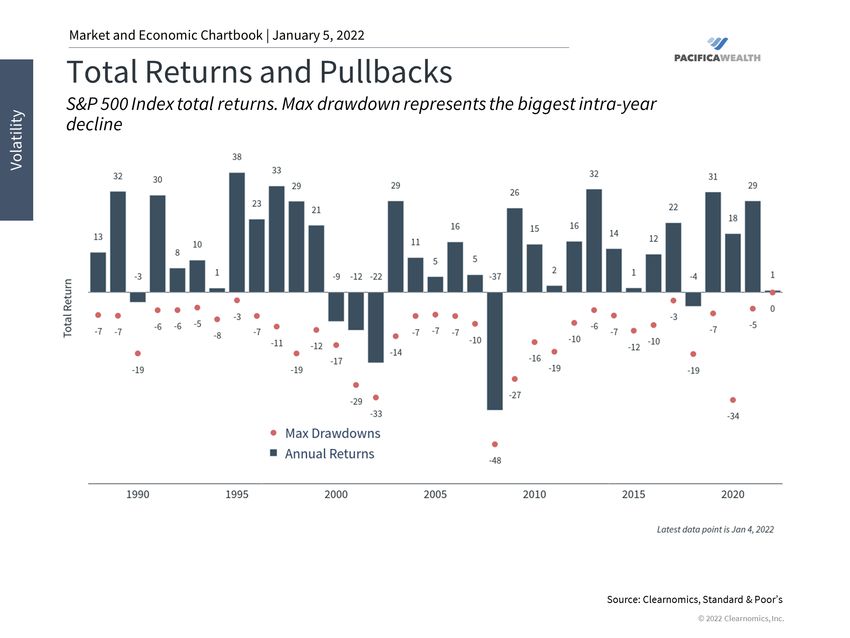
•   Unemployment has improved significantly although the pace of job gains has slowed.
•   Still, the growth in jobs has pushed down the unemployment rate closer to historical averages.
•   Under-employment is still elevated and many industries due to the ongoing pandemic.
•   CPI is a commonly cited measure of inflation. It uses a basket of goods and services to track price changes for
    consumers.
•   In order to measure the underlying trend in inflation, rather than temporary shocks to food and energy,
    economists often focus on Core CPI.
•   Inflation remains at multi-decade highs due to global supply chain problems and a tightening labor market.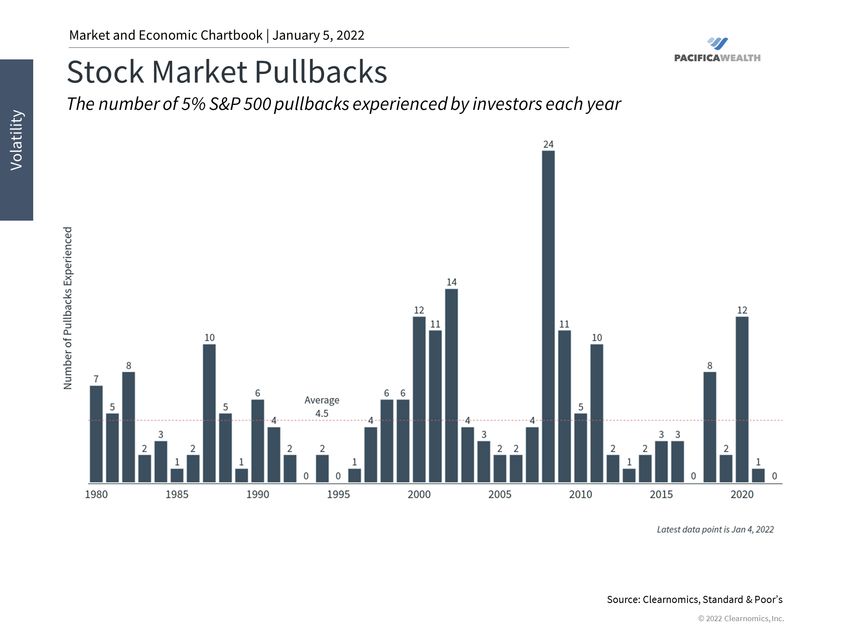
•   This chart shows total returns of the stock market (bars) and the largest intra-year decline (dots) each year.
•   The average year sees a significant intra-year drop. However, most years still end in positive territory, especially
    with dividends.
•   Volatility in prices is a normal part of investing. It is important to not forget that investments also generate income.
• Investing in the stock market is inherently uncertain. Large pullbacks can occur at any time.
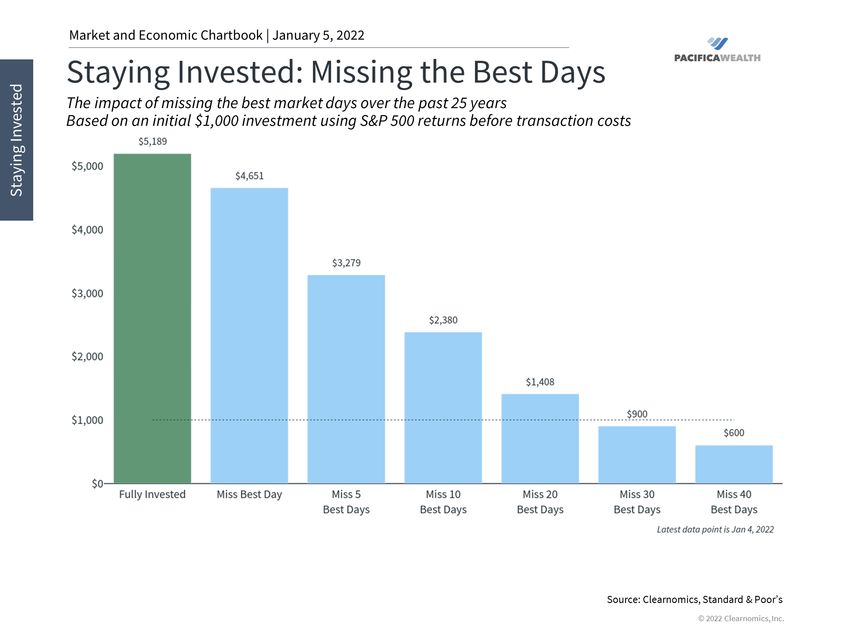
• Investors experience several large pullbacks each year with very few exceptions.
• Over the long run, stocks are still the best way to protect and create wealth. Staying invested is thus an important
discipline.• Staying invested is a key principle of long-term financial success. • This chart shows the impact of missing the best market days over the past 25 years. • Staying invested through ups and downs can make a significant difference in final investment outcomes.
•   Generating income from safe investments has been challenging since the global financial crisis.
•   The Fed has kept rates low, putting additional pressure on the income generated by cash - e.g. CDs and savings
    accounts.
•   Adjusting for rising inflation, most savers are still losing significant purchasing power by holding cash.
Important Information This presentation is solely for informational purposes. Past performance is no guarantee of future returns. Investing involves risk and possible loss of principal capital. No advice may be rendered by Pacifica Wealth Advisors, Inc. unless a client service agreement is in place. Please contact us at your earliest convenience with any questions regarding the content of this presentation and how it may be the right strategy for you. Pacifica Wealth Advisors, Inc. is a Registered Investment Adviser. Advisory services are only offered to clients or prospective clients where Pacifica Wealth Advisors, Inc. and its representatives are properly licensed or exempt from licensure. This report is solely for informational purposes. Past performance is no guarantee of future returns. Investing involves risk and possible loss of principal capital. No advice may be rendered by Pacifica Wealth Advisors, Inc. unless a client service agreement is in place. This report presents past performance, which does not guarantee future results. The investment return and principal value will fluctuate thus an investor's shares, when redeemed, may be worth more or less than their original cost. Current performance may be higher or lower than return data quoted herein. Different types of investments involve varying degrees of risk, and there can be no assurance that the future performance of any specific investment, investment strategy, or product made reference to directly or indirectly in this newsletter (article), will be profitable, equal any corresponding indicated historical performance level(s), or be suitable for your portfolio. Due to various factors, including changing market conditions, the content may no longer be reflective of current opinions or positions. Moreover, you should not assume that any discussion or information contained in this report serves as the receipt of, or as a substitute for, personalized investment advice from Pacifica Wealth Advisors, Inc. Neither asset allocation nor diversification guarantee a profit or protect against a loss in a declining market. They are methods used to help manage investment risk. Historical performance results for investment indices and/or categories have been provided for general comparison purposes only, and generally do not reflect the deduction of transaction and/or custodial charges, the deduction of an investment management fee, nor the impact of taxes, the incurrence of which would have the effect of decreasing historical performance results. It should not be assumed that your account holdings do or will correspond directly to any comparative indices. Please remember to contact Pacifica Wealth Advisors, Inc. if there are any changes in your personal/financial situation or investment objectives for the purpose of reviewing/evaluating/revising our previous recommendations and/or services. A copy of our current written disclosure statement discussing our advisory services and fees continues to remain available for your review upon request.
You can also read