DON'T EXPECT THE FED TO END THIS BULL ANYTIME SOON
←
→
Page content transcription
If your browser does not render page correctly, please read the page content below
January 18, 2022

                           DON’T EXPECT THE FED TO END THIS BULL
                           ANYTIME SOON
                           Jeff Buchbinder, CFA, Equity Strategist, LPL Financial
                           Ryan Detrick, CMT, Chief Market Strategist, LPL Financial

    The Federal Reserve (Fed) has engineered a massive hawkish shift, causing a bit more stock market
    volatility recently. But how worried should investors be? Here we take a look back at historical
    performance for stocks before, after, and much after initial Fed rate hikes to help reassure any
    nervous investors out there. We also take a quick look at what the Fed pivot could mean for
    growth/value and large cap/small cap trends given the maturing business cycle.

MASSIVE HAWKISH SHIFT
With the recent pivot by Jay Powell and Company at the Fed, rate hikes have been getting a
lot of attention. And rightly so, given the bond market has gone from pricing in one 2022 rate
hike just a few months ago to now pricing in three to four. That’s one of the most dramatic
hawkish shifts by the Fed in a short period of time that we’ve ever seen, so some market jitters
are not surprising.

HOW MUCH SHOULD WE WORRY?
A look back at history may help calm some investors’ jitters around the start of Fed rate hikes.
As we wrote in our Outlook 2022: Passing the Baton, stocks tend to do well leading up to initial
Fed rate hikes. There we highlighted the average 15% gain during the 12 months ahead of the
initial hike of an economic cycle, including gains in all nine cases back more than 60 years.
This makes sense given it takes a strengthening economy to create the job gains and inflation
the Fed needs to see to take away the punchbowl. We see the first rate hike coming in either
March or May, and with the S&P 500 Index up nearly 20% since March of 2021, and more than
10% since May 2021, those gains may already have occurred.

Looking beyond the initial hike, on our LPL Research blog last week we looked at how stocks
performed during various periods after the Fed starts to hike rates. The story is similar, with the
S&P 500 up an average of 7.5% six months later and 10.8% over the next 12 months
historically. Stock were up all eight times one year after those initial hikes going back to the
early 1980s. So based on history, the start of a rate hiking campaign by the Fed should not be
too worrisome for investors.

1     Member FINRA/SIPC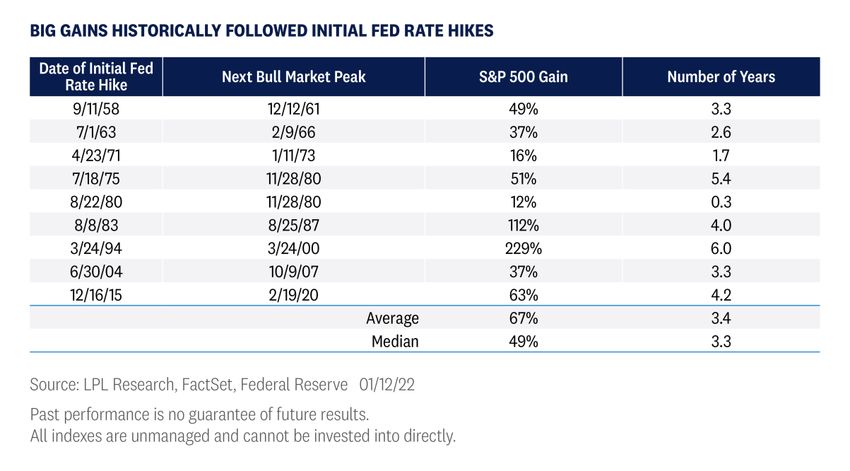
LOOKING OUT LONGER TERM

But what does the hike mean further out, say 2023 and beyond? In Outlook 2022, we noted
that initial Fed rate hikes can help us mark where the economy is in its cycle. The start of rate
hikes typically happens in the early-to-middle stages of the cycle, where stocks historically see
solid gains as we are forecasting for 2022.

But we can extend this exercise further and look at how stocks have done from the initial rate
hike of a cycle until the end of the accompanying bull market, as we have done in [Figure 1].
Those first rate hikes have been followed by an average gain of 67% before the subsequent
bull market peak. For those keeping score at home, that would take the S&P 500 to over 7,700
(no, that is not a forecast) before the next 20% or more decline.

On average, after rate hikes start, bull markets have run for about three to four years (or 40
more months) before peaking, with the longest in the late 1990s at six years (72 months)
between the 1994 hike and the bull market top in March of 2000.

We can also look at where in economic cycles these first rate hikes occurred based on the
dates of the economic expansion. This can give us a rough idea of how much more economic
growth we might expect after the Fed starts hiking rates.

This exercise reveals that, on average, expansions were 40% completed upon arrival of the
Fed’s first hike. However, the August 1983 hike occurred only about one-quarter of the way
through that expansion, which we think is more representative of how long this unusual cycle
may last. We’re not even two years in and we think this cycle has a few more years left.

2   Member FINRA/SIPC
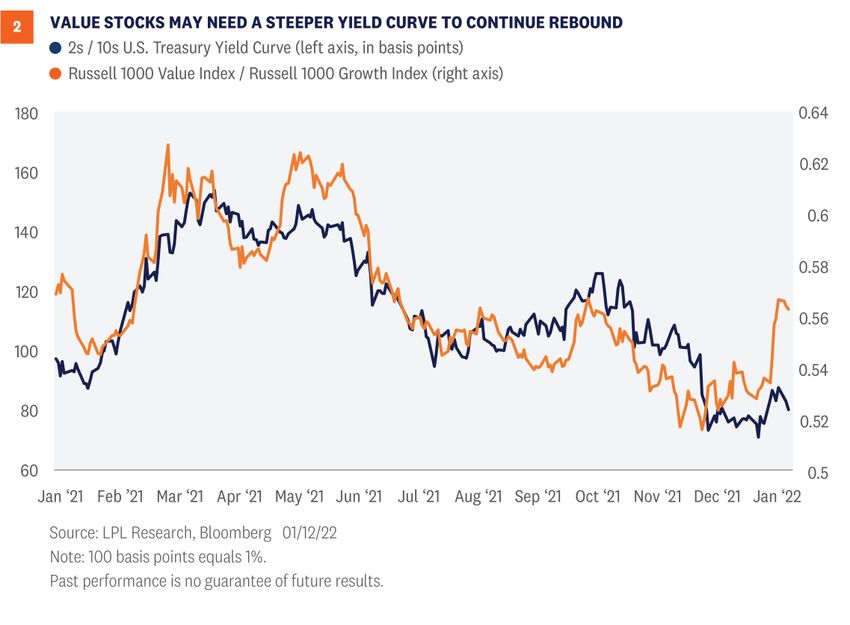
IMPLICATIONS FOR THE GROWTH-VALUE ROTATION

After growth stocks performed so well throughout much of the pandemic, value stocks have
shown signs of life recently. Year to date the Russell 1000 Value Index has gained 1%, ahead
of the more than 5% drop in the 1000 Growth Index. That follows about four percentage points
of outperformance by value in December.

As shown in [Figure 2], the relative strength of value stocks has been closely tied to the yield
curve, or the difference between 2-year and 10-year U.S. Treasury yields. A steeper yield curve
tends to be good for financials, the biggest value sector, so this makes sense.

One of the reasons we squared up our views on the growth and value styles this month in our
latest Global Portfolio Strategy report is because we think the opportunity for yield curve
steepening may be somewhat limited now that the Fed pivot has occurred and the bond market
is pricing in more than three rate hikes for 2022. If the 10-year yield doesn’t get much higher
than 2% this year, as we expect, and the Fed follows through with a series of hikes and maintains
its credibility as an effective inflation fighter, then the yield curve may actually flatten.

We are not worried about an inverted yield curve signaling recession, but we are skeptical that
value stocks will continue to outperform at such a strong pace for much longer even with support
from strong, though slower, economic growth and a likely further rise in interest rates.

3   Member FINRA/SIPC
SCALES MAY BE TILTING TOWARD LARGE CAPS

Small cap stocks have historically done better early in economic expansions, so as this cycle
matures, large caps may have an edge. While we do not fear an impending recession, we do
believe tighter monetary policy marks the economy’s progress toward mid-cycle. As such, we
have become a bit less enamored with small caps, taking our view down from positive to
neutral this month.

While small caps have historically performed well in inflationary environments, this cycle is
unique and we believe larger companies are better positioned for the current environment of
supply chain challenges and labor shortages (where a big chunk of the inflation is coming
from). In addition, weakness in biotech and other more speculative, richly valued pockets of
the market, should it continue, will make it difficult for smaller cap stocks to keep up with their
mostly higher quality, better-resourced large cap peers.

CONCLUSION
The Fed has engineered a massive hawkish pivot, contributing to an increase in volatility
recently. But a look back at history provides some reassurance, as stocks have historically
performed well leading up to and after the first rate hike of a cycle, with significant upside
before eventual bull market tops. Bottom line, even with rate hikes coming soon, we think this
economic cycle and bull market have quite a bit left in the tank.

4   Member FINRA/SIPC
IMPORTANT DISCLOSURES

This material is for general information only and is not intended to provide specific advice or recommendations for any
individual. There is no assurance that the view s or strategies discussed are suitable for all investors or w ill yield positive
outcomes. Investing involves risks including possible loss of principal. Any economic forecasts set forth may not develop as
predicted and are subject to change.

References to markets, asset classes, and sectors are generally regarding the corresponding market index. Indexes are
unmanaged statistical composites and cannot be invested into directly. Index performance is not indicative of the performance
of any investment and does not reflect fees, expenses, or sales charges. All performance referenced is historical and is no
guarantee of future results.

Any company names noted herein are for educational purposes only and not an indication of trading intent or a solicitation of
their products or services. LPL Financial doesn’t provide research on individual equities.

All information is believed to be from reliable sources; how ever, LPL Financial makes no representation as to its completenes s
or accuracy.

U.S. Treasuries may be considered “safe haven” investments but do carry some degree of risk including interest rate, credit,
and market risk. Bonds are subject to market and interest rate risk if sold prior to maturity. Bond values w ill decline as in terest
rates rise and bonds are subject to availability and change in price.

The Standard & Poor’s 500 Index (S&P500) is a capitalization-w eighted index of 500 stocks designed to measure performance
of the broad domestic economy through changes in the aggregate market value of 500 stocks representing all major
industries.

The PE ratio (price-to-earnings ratio) is a measure of the price paid for a share relative to the annual net income or profit
earned by the firm per share. It is a financial ratio used for valuation: a higher PE ratio means that investors are paying more
for each unit of net income, so the stock is more expensive compared to one w ith low er PE ratio.

Earnings per share (EPS) is the portion of a company’s profit allocated to each outstanding share of common stock. EPS
serves as an indicator of a company’s profitability. Earnings per share is generally considered to be the single most important
variable in determining a share’s price. It is also a major component used to calculate the price-to-earnings valuation ratio.

All index data from FactSet.

This research material has been prepared by LPL Financial LLC.

Securities and adv isory services offered through LPL Financial (LPL), a registered inv estment advisor and broker -dealer (member
FINRA/SIPC). Insurance products are offered through LPL or its licensed affiliates. To the extent you are receiving investment advice from
a separately registered independent investment advisor that is not an LPL affiliate, please note LPL makes no representation with respect to
such entity.

     Not Insured by FDIC/NCUA or Any Other Gov ernment Agency                              Not Bank/Credit Union Guaranteed
             Not Bank/Credit Union Deposits or Obligations                                           May Lose Value

RES-1008301-0122 | For Public Use | Tracking # 1-05232903 (Exp. 01/23)

5     Member FINRA/SIPC
You can also read