Discovery of four super-soft X-ray sources in XMM-Newton observations of the Large Magellanic Cloud
←
→
Page content transcription
If your browser does not render page correctly, please read the page content below
A&A 657, A26 (2022)
https://doi.org/10.1051/0004-6361/202142159                                                                                                              Astronomy
c C. Maitra and F. Haberl 2021                                                                                                                            &
                                                                                                                                                         Astrophysics

        Discovery of four super-soft X-ray sources in XMM-Newton
               observations of the Large Magellanic Cloud
                                                                         C. Maitra and F. Haberl

     Max-Planck-Institut für extraterrestrische Physik, Gießenbachstraße 1, 85748 Garching, Germany
     e-mail: fwh@mpe.mpg.de
     Received 5 September 2021 / Accepted 3 October 2021

                                                                                    ABSTRACT

     Context. Super-soft X-ray sources were established as a heterogeneous class of objects from observations of the Large Magellanic
     Cloud (LMC).
     Aims. We have searched for new sources of this class in the X-ray images obtained from the XMM-Newton survey of the LMC and
     additional archival observations.
     Methods. We first selected candidates by visual inspection of the image and screened out the artefacts that can mimic super-soft
     X-ray sources as well as the bright foreground stars that create optical loading in the detectors. We obtained four new super-soft X-ray
     sources for which we performed detailed X-ray timing and spectral analyses and searched for possible optical counterparts to identify
     their nature. We also looked at archival ROSAT and Swift observations to investigate the long-term behaviour of the sources.
     Results. XMMU J050452.0−683909 is identified as the central star of the planetary nebula SMP LMC 21 in the LMC. We suggest
     XMMU J051854.8−695601 and XMMU J050815.1−691832 as new soft intermediate polars based on the nature of their X-ray spec-
     trum. Their estimated absorption-corrected luminosities and the blackbody radii indicate that they are located in our Galaxy, rather
     than the LMC. We discovered coherent pulsations of 497 s from XMMU J044626.6-692011, which indicates a magnetic cataclysmic
     variable nature of the source. The location of XMMU J044626.6−692011 in the LMC or our Galaxy is less clear. It could either be a
     white dwarf in the LMC with nuclear burning on its surface near the Eddington limit or another soft intermediate polar in our Galaxy.
     Conclusions. The discovery of new super-soft X-ray sources makes a significant contribution to the known population in our Galaxy.
     An observed higher density of sources in the direction of the Magellanic Clouds can likely be explained by the relatively low Galactic
     column density in their direction as well as a large number of existing observations sensitive at low X-ray energies.
     Key words. novae, cataclysmic variables – white dwarfs – binaries: close – galaxies: individual: LMC – X-rays: stars

1. Introduction                                                                                 Anzolin et al. 2008) show pulsations in their X-ray flux that are
                                                                                                caused by the rotation of the magnetised WD, which is syn-
The low Galactic foreground absorption in the direction of the
                                                                                                chronous with the orbital revolution in polars (typically longer
Magellanic Clouds makes them ideal laboratories for the detec-
                                                                                                than one hour). Typical WD spin periods of a few hundred
tion and investigation of super-soft X-ray sources (SSSs). In
                                                                                                seconds (Kuulkers et al. 2006) are found from intermediate
fact, the first SSSs were discovered in the Large Magellanic
                                                                                                polars (IPs) with Pspin ∼ 0.1Porb (Norton et al. 2004). Double-
Cloud (LMC) using the Einstein observatory (Long et al. 1981)
                                                                                                degenerate binaries (i.e. systems that host two interacting WDs)
before further discoveries with ROSAT established them as a
                                                                                                can have orbital periods as short as a few minutes (Cropper et al.
new, though heterogeneous, class of objects (see Greiner 1996;
                                                                                                1998; Esposito et al. 2014).
Kahabka & Haberl 2006; Kahabka et al. 2008).
                                                                                                    In this paper we report the discovery of new SSSs in XMM-
    Super-soft X-ray sources are characterised by soft X-ray
                                                                                                Newton observations of the LMC. In Sect. 2 we describe the
spectra with kT ∼ 15–80 eV (e.g., Kahabka & van den Heuvel
                                                                                                XMM-Newton and other available archival X-ray observations as
1997) and a wide range of luminosities. The most luminous
                                                                                                well as the analysis methods. Section 3 examines the OGLE data,
(∼1036 to ∼1038 erg s−1 ) can be explained by stable nuclear burn-
                                                                                                which cover the X-ray positions. The results from our temporal
ing white dwarfs (WDs), which accrete H-rich matter from a
                                                                                                and spectral analyses and our search for optical counterparts are
companion star (van den Heuvel et al. 1992). The size of the
                                                                                                presented in Sect. 4 and discussed in Sect. 5.
emission area derived from blackbody fits to their spectra is con-
sistent with emission from the full WD surface. At least five of
these close-binary SSSs are known in the LMC (Kahabka et al.                                    2. X-ray observations and analysis
2008). White dwarfs as central stars of planetary nebulae (PNe)
                                                                                                2.1. XMM-Newton
are known as SSSs in the LMC (SMP LMC 29; Kahabka et al.
2008) and the Small Magellanic Cloud (SMC; SMP SMC 22 and                                       In the course of the XMM-Newton surveys of the SMC (Haberl
SMP SMC 25; Mereghetti et al. 2010).                                                            et al. 2012; Sturm et al. 2013) and the LMC (Maggi et al. 2016),
    A soft blackbody-like emission component is also observed                                   we searched for new SSSs in the data obtained by the European
from magnetic cataclysmic variables (mCVs), albeit with sig-                                    Photon Imaging Cameras (EPIC), including pn- (Strüder et al.
nificantly lower luminosities, below 1034 erg s−1 . AM Her-type                                 2001) and MOS-type (Turner et al. 2001) charge-coupled device
systems (polars; Cropper 1990) and DQ Her-type systems (soft                                    (CCD) detectors. Due to their soft X-ray spectra with the bulk of
intermediate polars; Haberl & Motch 1995; Burwitz et al. 1996;                                  the emission below ∼1 keV, they appear as red sources in our
                                                                                                                                                                            A26, page 1 of 9
               Open Access article, published by EDP Sciences, under the terms of the Creative Commons Attribution License (https://creativecommons.org/licenses/by/4.0),
                                which permits unrestricted use, distribution, and reproduction in any medium, provided the original work is properly cited.
                                                                  Open Access funding provided by Max Planck Society.
A&A 657, A26 (2022)
We extracted the events to produce spectra and light
curves from circular regions around the source positions and
nearby blank-sky areas. Due to the higher sensitivity of the
pn detectors compared to the MOS detectors at low ener-
gies, we used only pn data, except for the timing analysis of
XMMU J044626.6−692011 (see Sect. 4.4). Single- and double-
pixel events (PATTERN 0–4) were selected, excluding known
bad CCD pixels and columns (FLAG 0). For the spectra, we
removed times of increased flaring activity when the background
was above a threshold of 8 counts ks−1 arcmin−2 (7.0–15.0 keV
band). EPIC spectra were re-binned to have at least one count per
bin, and C-statistic was used. The SAS tasks arfgen and rmfgen
were used to generate the corresponding detector response files.
The X-ray spectra were analysed with the spectral fitting pack-
age XSPEC 12.11.0k2 (Arnaud 1996). Errors are specified for
90% confidence, unless otherwise stated.
We modelled the EPIC-pn spectra with blackbody emission
attenuated by photo-electric absorption. For three of the sources,
a weak, but significant, high-energy tail is seen in the spectra.
Because the shape of this component is not well constrained
(the power law and bremsstrahlung both yield acceptable fits),
we used a bremsstrahlung model as bremsstrahlung is gener-
ally seen in the X-ray spectra of mCVs (see e.g., Mukai 2017).
Fig. 1. Regions around the four new SSSs. The zoomed-in images are all We fixed the temperature at 10 keV and assumed that blackbody
on the same scale and extracted from the full RGB mosaic of the EPIC and bremsstrahlung components are attenuated by the same NH .
LMC observations. HD 268622 is a bright foreground star of spectral First, we assumed the sources are located in the LMC and used
type G5 and V = 11.3 mag, which causes optical loading (see Sect. 2.1). two column densities along the line of sight. One accounts for the
Galactic foreground with solar abundances according to Wilms
et al. (2000) and was fixed at the value obtained from H i mea-
colour red-green-blue (RGB) images, which are composed of surements (Dickey & Lockman 1990)3 , the other (free in the
combined EPIC images in three energy bands (R: 0.2–1.0 keV, fit), with metal abundances set to 0.5, reflects the absorption by
G: 1.0–2.0 keV, and B: 2.0–4.5 keV). The images were produced the interstellar medium of the LMC (Rolleston et al. 2002) and
using the same pipeline as for the SMC as described in Sturm local to the source. Second, if the source could be closer and
et al. (2013). located in the Milky Way, we used only one column density with
However, CCD detectors can also produce artefacts that solar abundance, allowing it as a free parameter in the spectral
mimic SSSs: (1) Hot CCD pixels or columns create events in low fit. Luminosities were corrected for absorption and calculated
detector channels, and (2) optically bright stars produce optical assuming a distance of 50 kpc in the case of LMC and 1–5 kpc
loading due to the sensitivity of the CCDs to optical photons, in the case of our Galaxy.
which can release a sufficiently high number of electrons to cre-
ate a signal above the low-energy threshold of the detector. Both 2.2. Swift
of these types of false detections can be recognised because they
We produced long-term light curves from archival data of
are not subject to blurring due to the point spread function (PSF)
the Swift X-ray telescope (XRT) in a soft energy band (0.3–
of the telescope and can be identified in detector images (type
1.0 keV or 0.3–1.5 keV, depending on the spectrum) with time
1), or they correlate with optically bright stars and produce large
bins of 1 day, using the online tool of the UK Swift Science
numbers of invalid event patterns (type 2).
Data Centre4 , which is described in Evans et al. (2007)
We processed all EPIC observations in the directions of the
and Evans et al. (2009). This time binning ensures that
Magellanic Clouds using the XMM-Newton Science Analysis
the data from the observations (also with different ObsIDs),
Software (SAS) 19.0.01 package to create event lists using the
which were performed shortly after one another, are merged.
most recent software and calibration files. Following Sturm et al.
We set the minimum fractional exposure to 0.005 to ignore
(2013), we produced the images and ran source detection. From
exposures that were too short to allow the sources to be
a visual inspection of the RGB images of the LMC, we identified
detected. The list of available observations can also be
22 new SSS candidates. In the majority of cases, we identified
obtained from the data centre5 . Five archival observations cover
a bright foreground star (V magnitudes were between 4.8 and
the position of XMMU J050452.0−683909 (J0504 for short),
11.4) in observations for which the thin optical blocking filter
three of which have sufficient XRT exposure to detect the
was used, which was insufficient to suppress the optical light.
source (February 2012, September 2016, and June 2020). The
Only in one case did we find a hot pixel that was not masked out
XRT 0.3–1.0 keV count rates during these observations were
automatically by the software (ObsID 0690744401, pn-CCD = 2,
(1.4+1.5 −3 −1 +2.7 −3 −1 +1.2
−0.9 ) × 10 cts s , (2.5−1.6 ) × 10 cts s , and (0.62−0.59 ) ×
RAWX = 20, RAWY = 154). After this careful screening, we
were left with four new SSS candidates. Colour images are pre- 2
Available at https://heasarc.gsfc.nasa.gov/xanadu/
sented in Fig. 1, which also shows an example of the appearance xspec/
of a bright foreground star. A summary of the XMM-Newton 3
Extracted using NASA’s HEASARC web interface https://
observations in which they were found is given in Table 1. heasarc.gsfc.nasa.gov/cgi-bin/Tools/w3nh/w3nh.pl
4
https://www.swift.ac.uk/user_objects/
1 5
https://www.cosmos.esa.int/web/xmm-newton/sas https://www.swift.ac.uk/swift_live/
A26, page 2 of 9C. Maitra and F. Haberl: Super-soft X-ray sources in XMM-Newton observations of the LMC
Table 1. XMM-Newton observations of new SSSs.
Source name Observation Start time Exp. Off-axis RA Dec Err
XMMU J... short ID angle (J2000)
(ks) (0 ) (h m s) (◦ 0 00
) (00 )
050452.0−683909 J0504 0803460101 2017-10-19 04:34 44.41 7.7 05 04 52.00 −68 39 09.7 0.41
0693450201 2013-02-09 13:14 11.40 13.9 05 04 51.39 −68 39 09.9 0.64
051854.8−695601 J0518 0690751801 2012-12-28 21:30 22.95 5.5 05 18 54.82 −69 56 01.5 0.40
050815.1−691832 J0508 0690752001 2012-09-22 02:29 22.05 13.8 05 08 15.14 −69 18 32.4 0.43
044626.6−692011 J0446 0801990301 2017-09-28 21:50 21.54 5.1 04 46 26.62 −69 20 11.9 0.48
Notes. Parameters are given for the EPIC-pn instrument. Source coordinates were determined by applying bore-sight correction using background
active galactic nuclei (following Maitra et al. 2019). The position error includes statistical and remaining systematic uncertainties (0.3300 ). Exposure
times are given after correcting for dead times and the removal of intervals with high background.
Table 2. eROSITA observations of XMMU J051854.8-695601.
261488
Observation Start time Exp. (ks)
700182 2019-11-27 06:07:32.9 31.5
700201 2019-12-02 12:45:50.4 11
700202 2019-12-04 02:46:43.5 9
N
N
−3 −1
10 cts s , respectively. Also, five observations cover the 2.5" W
W
2.5"
position of XMMU J051854.8−695601 (J0518 ), one of which
with an XRT exposure of nearly 2 ks (March 2013). The
0.3–1.5 keV XRT count rate during this observation was
(4.4+2.1 −3 −1
−1.6 ) × 10 cts s . Numerous serendipitous observations of
XMMU J050815.1−691832 (J0508) exist in the Swift archive, 117274
which allowed us to investigate the long-term variability
between November 2008 and June 2016. No Swift observations
cover the position of XMMU J044626.6−692011 (J0446).
113589 N
We also used the online analysis tool for the Swift ultra-violet N
optical telescope (UVOT)6 to search for optical-UV counterparts 2.5"
W
in the UVOT data. The analysis tool is based on the Swift/UVOT 2.5"
W
(Roming et al. 2005) software package and consists of the fol-
lowing steps: summing of all the exposure fractions, performing
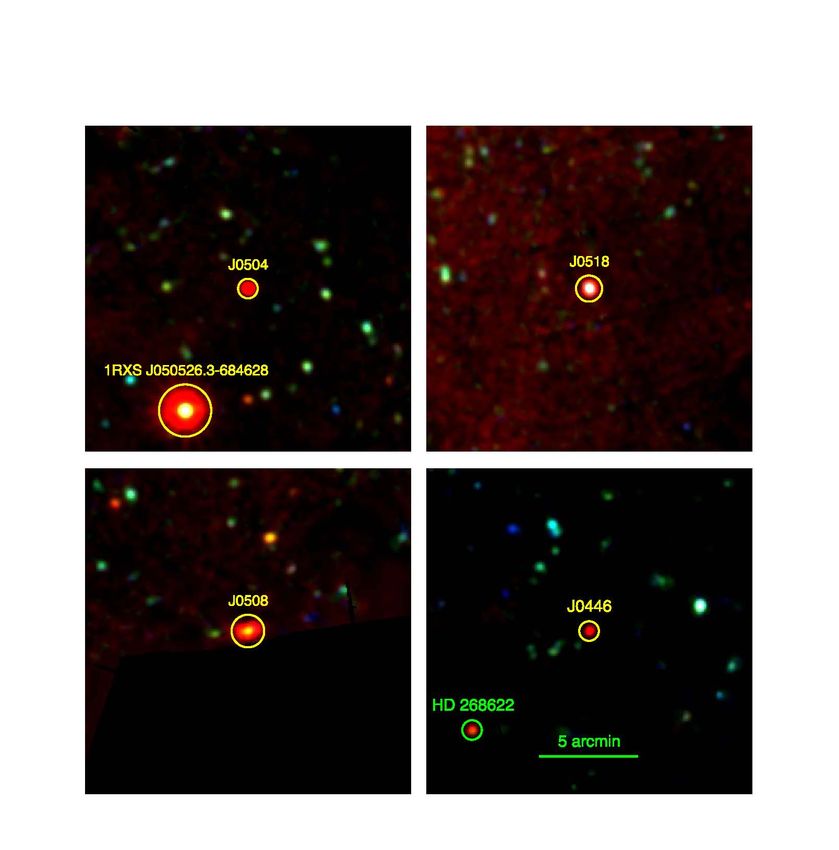
Fig. 2. Finding charts of the four new SSSs. In the zoomed-in I-band
source detection using the uvotdetect task (detection threshold images from OGLE-II/III, the 1σ error circles of the XMM-Newton
of 6 and quality filtering applied), and applying magnitude de- positions and the OGLE source IDs are marked in red. The field identi-
reddening using the E(B − V) value at the query position accord- fications for J0504 (top left), J0518 (top right), J0508 (bottom left), and
ing to Schlafly & Finkbeiner (2011). J0446 (bottom right) are OGLE-II LMC_SC14, OGLE-III LMC118.6,
OGLE-II LMC_SC11, and OGLE-III LMC142.7, respectively.
2.3. eROSITA
J0518 was in the field of view of eROSITA, the soft X-ray 1992), which provides more than 20 years of monitoring data
instrument on the Spektrum-Roentgen-Gamma (SRG) mis- (OGLE IV; Udalski et al. 2015). We looked at images taken
sion (Predehl et al. 2021), during the ‘CalPV phase’ (Haberl in the V and I filter passbands, where the photometric magni-
et al. 2021). To analyse the CalPV data, we used the tudes are calibrated to the standard VI system. For each source
eROSITA Standard Analysis Software System (eSASS, version studied in this work, we searched for possible optical coun-
eSASSusers_201009; Brunner et al. 2021). The data reduc- terparts within the X-ray error circle given in Table 1 (see
tion and spectral analysis were performed in a similar way as Fig. 2).
described by Maitra et al. (2021) and Carpano et al. (2021),
where details can be found. The details of the CalPV observa-
tions are given in Table 2. 4. Results
4.1. XMMU J050452.0−683909
3. OGLE observations The SSS candidate with the softest X-ray spectrum in our sam-
The fields in the LMC were also observed by the Opti- ple, J0504 , was covered by two XMM-Newton observations
cal Gravitational Lensing Experiment (OGLE; Udalski et al. (Table 1). It was detected in both observations in the low-
est energy band (0.2–0.5 keV) in pn and MOS images, which
6
https://www.ssdc.asi.it/mmia/index.php?mission= clearly excludes an instrumental origin. The EPIC-pn count rates
swiftmastr in the soft band (corrected for vignetting) determined by the
A26, page 3 of 9A&A 657, A26 (2022)
0.1 XMMU J050452.0−683909 0.1 XMMU J051854.8−695601
Planetary Nebula SMP LMC 21 [SHP 2000] LMC 94
0.01 0.01
Counts s−1 keV−1
Counts s−1 keV−1
10−3 10−3
10−4 10−4
10−52 10−5
1 2
0
χ
χ
0
−1
−2
−2
0.2 0.5 1 0.5 1 2 5
Channel Energy (keV) Channel Energy (keV)
0.1 XMMU J050815.1−691832 XMMU J044626.6−692011
average
flare 0.01
quiescence
0.01
Counts s−1 keV−1
Counts s−1 keV−1
10−3
10−3
10−4 10−4
10−5 10−5
2 2
0 0
χ
χ
−2 −2
0.5 1 2 0.2 0.5 1 2
Channel Energy (keV) Channel Energy (keV)
Fig. 3. EPIC-pn X-ray spectra of new SSSs observed in the XMM-Newton survey of the LMC. For J0508, the best-fit model was derived from the
average spectrum, while the models for quiescent and flare emission were scaled by a constant factor, keeping all other parameters fixed at the
values of the average spectrum.
source detection algorithm of (4.11 ± 0.36) ×10−2 cts s−1 (Febru- the detector response of the ROSAT position sensitve propor-
ary 2013) and 0.0455(14) cts s−1 (October 2017) are consistent tional counter (PSPC), a count rate of 3.5 × 10⁻³ cts s−1 is
within their (1σ) errors. The source was observed at a very large expected. With such a count rate, the source should have been
off-axis angle in 2013. To avoid systematic uncertainties, we detected in two ROSAT/PSPC observations: 500037p (April
considered only the 2017 observation for the extraction of source 1992, 6826 s exposure) and 500258p (October–December 1993,
products. 12 715 s) with ∼20 cts (taking into account vignetting), which
To search for an optical counterpart, we used the X-ray coor- is a factor of about three higher than the detection limit. In
dinates derived from the observation with a smaller off-axis angle. other words, J0504 was at least a factor of three fainter dur-
This position is right at the centre of the PN SMP LMC 21 (at ing the ROSAT observations. During Swift observations (2012,
RA = 05h 04m 51s.99 and Dec = −68◦ 390 0900. 7 with angular extent 2016, and 2020), J0504 was detected with 0.3–1.0 keV count
of 0.230 ; Reid & Parker 2006, catalogue entry 1797). This rates between 0.6 × 10⁻³ cts s−1 and 2.5 × 10⁻³ cts s−1 . Assum-
is the second association of an SSS with a PN in the LMC ing the EPIC-pn best-fit spectral parameters, an XRT count
after XMMU J050803.1−684017 = SMP LMC 29 (Kahabka et al. rate of ∼2.1 × 10⁻³ cts s−1 is expected, consistent with the
2008), while two are detected in the SMC (Mereghetti et al. observations.
2010). The OGLE counterpart of this object (LMC_SC14 StarID:
261488) is at RA = 05h 04m 52s.05 and Dec = −68◦ 390 0900. 9 with 4.2. XMMU J051854.8−695601
I = 16.9 mag (Fig. 2). The OGLE-II I-band light curve of the
star does not exhibit significant variability. J0518 was detected in the EPIC images of observation
The EPIC-pn spectrum is well represented by an absorbed 0690751801 (Table 1) with an EPIC-pn count rate (0.2–0.5 keV,
blackbody component (Fig. 3 and Table 3). The inferred corrected for vignetting) of (4.29 ± 0.20) ×10−2 cts s−1 . No opti-
size of the emission area is consistent with emission from cal counterpart was found for the object in the OGLE database
the full surface of a WD (see Table 3). The source intrin- (Fig. 2) nor in the Gaia catalogues within the X-ray error circle.
sic luminosity of 1.7 × 1037 erg s−1 is very similar to that A star with V ∼ 21 mag was, however, found within the error
of SMP SMC 22 (Mereghetti et al. 2010) and consistent with circle from the Magellanic Clouds Photometric Survey (MCPS)
being constant between the two XMM-Newton observations, catalogue of Zaritsky et al. (2004). No source was detected at the
which were taken almost 4.7 years apart. On the other hand, position of J0518 from the Swift/UVOT data. Using the longest
the source was not detected in ROSAT pointed observations. UVOT exposure that covers J0518 (ObsID 00045502001, expo-
Using the best-fit model parameters derived from the EPIC- sure 1014 s, filter uvm2) and the sources detected in the field, a
pn spectrum (obtained from the observation in 2017) and lower limit of 18.5 mag was obtained.
A26, page 4 of 9C. Maitra and F. Haberl: Super-soft X-ray sources in XMM-Newton observations of the LMC
Table 3. Spectral fit results.
Source Observation kT bb NHGal NHLMC C-stat d.o.f. Fobserved (c) L (d) RBB
name (a) ID (eV) (1021cm−2 ) (1021 cm−2 ) /d.o.f. (erg cm−2 s−1 ) (erg s−1 ) (km)
J0504 0803460101 31 ± 4 0.64 1.2+0.5
−0.4 0.66 19 7.6 ± 0.4 × 10⁻¹⁴ 1.7 × 1037 16 000+40 600
−9600
J0518 0690751801 78 ± 8 0.67 0.9+0.6
−0.5
1.2 94 1.0 ± 0.1 × 10⁻¹³ 2.1 × 1035 220+140
−80
eROSITA 88 ± 4 0.67 0.09+0.16
−0.09 1.1 106 1.7 ± 0.2 × 10⁻¹³ 2.0 × 1035 135+28
−20
J0508 (b) 0690752001 86 ± 9 0.74 1.9 +0.9
−0.8 1.7 54 1.7 ± 0.1 × 10⁻¹³ 5.7 × 1035 290 +280
−120
J0446 0801990301 49 ± 14 0.72 6.4+5.6
−3.2 0.94 40 2.0 ± 0.3 × 10⁻¹⁴ 7 × 1036 3400+9600
−3000
J0518 0690751801 78 ± 7 1.6+0.5
−0.4 – 1.2 94 1.0 × 10⁻¹³ 9.0 × 1031 4.5 +2.9
−1.6
eROSITA 88 ± 4 0.75+0.15
−0.13 – 1.1 106 1.7 × 10⁻¹³ 6.0 × 1031 2.7 +0.6
−0.5
J0508 (b) 0690752001 87 ± 9 2.5+1.0
−0.8 – 1.7 54 1.7 × 10⁻¹³ 2.4 × 1032 +6.7
6.1−2.8
J0446 0801990301 50 ± 14 7.1+6.5
−3.3 – 0.96 40 2.0 × 10⁻¹⁴ 5.0 × 1033 87+265
−78
Notes. Best-fit parameters using a model with absorbed blackbody and bremsstrahlung emission. The bremsstrahlung component is not well con-
strained, and the temperature was fixed at 10 keV (see Sect. 2.1). The C-stat values include the full model. Errors indicate 90% confidence ranges.
(a)
For full source names, see Table 1. (b) Spectral parameters derived from the average spectrum. (c) Fluxes are provided for the 0.1–2.4 keV band
to allow comparison with values published for SSSs based on ROSAT observations. (d) Source luminosities (0.1–2.4 keV) corrected for absorption,
assuming a distance of 50 kpc (Pietrzyński et al. 2013) in the upper part of the table. The Galactic foreground column density was taken from
Dickey & Lockman (1990). For the model in the lower part of the table, only a Galactic absorption component (with free column density in the fit)
and a distance of 1 kpc were assumed. A note of caution regarding absorption-corrected X-ray luminosities in soft energy bands: Column densities
with large errors lead to a large uncertainty on the luminosity, which is in particular the case for J0446.
Due to the relatively small off-axis angle of the source
0.1 XMMU J051854.8−695601
and the high detection significance, the data were suitable for [SHP 2000] LMC 94
a detailed analysis. The EPIC-pn spectrum can be fitted by
Counts s−1 keV−1
0.01
a blackbody and an additional bremsstrahlung component to
account for a significant hard tail in the spectrum. Figure 3 10−3
shows the best-fit EPIC-pn spectrum, and the best-fit spec-
tral parameters are tabulated in Table 3. The total 0.1–8.0 keV 10−4
absorption-corrected luminosity at the distance of the LMC is
2.13 × 1035 erg s−1 with the bremsstrahlung component account- 10−54
ing for 11%, demonstrating the dominance of the soft component
2
in the spectrum. Although the blackbody luminosity depends
somewhat on the temperature and absorption derived from the 0
χ
spectral fit, the luminosity is well below the range in which H −2
burning is expected to be stable (Wolf et al. 2013). In addition, −4
the radius of the emitting area of 220 km would be much smaller 0.5 1 2 5
than the size of a WD. On the other hand, the X-ray luminosity Channel Energy (keV)
would be too high to be explained by an mCV in the LMC. If we Fig. 4. Combined eROSITA X-ray spectrum of XMMU J051854.8−
assume the source to be located in the Milky Way, the luminosity 695601 observed in the CalPV phase together with the best-fit model.
and radius of the emitting area are correspondingly smaller (e.g., The model consists of soft blackbody and hard bremsstrahlung compo-
for distances of 1–5 kpc: Lbol = 9 × 1031 erg s−1 to 2 × 1033 erg s−1 nents, which are indicated by dotted lines.
and RBB = 4–20 km; see also Table 3).
J0518 was observed during the CalPV phase of eROSITA.
Data from the different telescope modules TM1, 2, 3, 4, and 6 1997–January 1998) and is listed in the catalogue of Sasaki
(which are equipped with cameras with on-chip optical blocking et al. (2000) as source 94 ([SHP2000] LMC 94) with a count
filter) and from the three observations were added. The com- rate of (2.6 ± 0.4) ×10−3 cts s−1 . Assuming the current spectral
bined spectrum is well represented by the same models as in the model derived from EPIC-pn, the expected HRI count rate
case of XMM-Newton EPIC-pn; the best-fit parameters are listed is ∼2.2 ×10⁻³ cts s−1 , consistent with the ROSAT measurement.
in Table 3. Similarly, the flux of 1.0 × 10⁻¹³ erg cm−2 s−1 observed with
The eROSITA spectrum with the best-fit two-absorption EPIC-pn (in September 2012) corresponds to a Swift/XRT 0.3–
component model is presented in Fig. 4. While the temperature 1.5 keV count rate of ∼4.1 ×10⁻³ cts s−1 , consistent with the
and emission radius derived from the eROSITA spectrum are detection in March 2013.
consistent with those measured from EPIC-pn, the column den-
sities are significantly lower during the eROSITA CalPV phase 4.3. XMMU J050815.1−691832
in November 2019, almost seven years after the XMM-Newton
observation. The higher absorption in 2012 results in a lower J0508 was detected in the EPIC images of observation
observed flux, but the absorption-corrected intrinsic luminosi- 0690752001 (Table 1) at an EPIC-pn count rate (0.2–0.5 keV,
ties during the two observations are similar, with a slightly lower corrected for vignetting) of (6.25 ± 0.30) ×10−2 cts s−1 . Although
value during the 2019 observations. there was no OGLE counterpart within the X-ray error circle, the
The source was detected previously in a ROSAT high- nearest counterpart, LMC_SC11 StarID: 117274, lies at 0.7500
resolution imager (HRI) observation (RH601040 in December (just outside the error circle) with I = 20.2 mag (Fig. 2). Due to
A26, page 5 of 9A&A 657, A26 (2022)
0.2
0.15
0.02
0.02
0.02
Count/sec
Count rate (cts s−1)
0.1
0.01
0.01
0.01
0.05
0 5000 104 1.5×10⁴ 2×10⁴ 2.5×10⁴
Time (s)
Fig. 5. EPIC-pn light curve of XMMU J050815.1−691832 (observation
0
0
0
0690752001) binned at 500 s in the 0.2–2 keV band. Time zero corre- 5.479 5.48 5.481 5.628 5.63 5.752 5.754 5.756
sponds to 22 September 2012 at 02:29:24 UTC. MJD (104 days)
Fig. 6. Long-term X-ray light curve of XMMU J050815.1−691832 in
the 0.3–1.5 keV band with one-day binning obtained from archival
the detection of the source near the edge of the field of view, the Swift observations. The source was mainly observed during three
epochs: November–December 2008, December 2012–January 2013,
position may be uncertain, and we ascertain this as the plausi-
and May–June 2016.
ble optical counterpart. The OGLE-II I-band light curve of the
star does not exhibit variability, although this cannot be ruled
out due to large uncertainties. No source was detected at the
position of J0508 from the Swift/UVOT data. Using the longest ing the flaring interval was a factor of ∼10 higher than during
UVOT exposure that covers J0518 (Obsid 00030348002, expo- quiescence. Figure 3 shows the best-fit EPIC-pn spectra during
sure 2049 s, filter w1) and the sources detected in the field, a the entire observation as well as during the flaring and quies-
lower limit of 19.1 mag was obtained. cence intervals.
Although the source was detected at a large off-axis angle, J0508 is consistent in position with 2RXS J050813.5−
its relatively bright nature allowed us to perform timing and 691831, which was detected in the ROSAT all-sky survey (Boller
spectral analyses of the EPIC-pn data. The EPIC-pn light curve et al. 2016) with a PSPC count rate of 1.2 × 10⁻² cts s−1 ,
of J0508 in the 0.2–2 keV band shows flaring activity shortly and the source is also listed in the ROSAT/HRI catalogue of
after the beginning of the observation, which lasted for ∼8.2 ks Sasaki et al. (2000) with a count rate of (4.9 ± 0.7) ×10−3 cts s−1
(Fig. 5). ([SHP2000] LMC 38). Using the best-fit model parameters
The EPIC-pn spectrum can be described by blackbody emis- derived from the EPIC-pn spectrum and the ROSAT/PSPC
sion with kT = 86 eV and a weak bremsstrahlung component. and HRI detector responses, the predicted count rates are
The best-fit spectral parameters are summarised in Table 3. The ∼1.2 ×10⁻² cts s−1 and ∼4.5 ×10⁻³ cts s−1 , respectively. This
blackbody temperature of J0508 is similar to that of J0518 , but indicates that the source was at a consistent brightness level dur-
significantly higher than that of J0504 and probably also J0446. ing the ROSAT all-sky survey (1990), the pointed ROSAT/HRI
The total unabsorbed luminosity at the distance of LMC is (RH601036 1997/1998), and the XMM-Newton (2012) observa-
6 × 1035 erg s−1 with the bremsstrahlung component accounting tion.
for only 2% of the total 0.1–8 keV emission, demonstrating again The soft X-ray light curve of J0508 extracted from archival
the dominance of the soft component. As in J0518 , the luminos- Swift data (Fig. 6) suggests some brightening during May–June
ity is well below the range for stable H burning, and the radius 2016. Based on the EPIC-pn best-fit spectral model parame-
of the emitting area of ∼290 km would be much smaller than the ters, the observed flux of 1.7 × 10⁻¹³ erg cm−2 s−1 corresponds
size of a WD. The inferred size of the emission region is indica- to a Swift/XRT count rate of ∼7.4 ×10⁻³ cts s−1 (0.3–1.5 keV).
tive of hot spots on the WD surface and suggests an IP nature In June 2016, the source flux reached a maximum of about
of the source. However, the X-ray luminosity would again be a factor of three higher, while the average count rate from
too high to be explained by an LMC membership of the source. the full Swift light curve of (3.1 ± 0.4) ×10−3 cts s−1 was at
If we assume a source location in the Milky Way, the luminosity about half the flux level during the ROSAT and XMM-Newton
and radius of the emitting area are correspondingly smaller (e.g., observations.
for distances of 1–5 kpc: Lbol = 2 × 1032 erg s−1 –5 × 1033 erg s−1
and RBB = 6–30 km; Table 3). 4.4. XMMU J044626.6−692011
We also extracted spectra, as shown in Fig. 3, from the
‘flaring’ and ‘quiescent’ intervals, guided by the light curve in J0446 was detected in the EPIC images observation 0801990301
Fig. 5. The spectrum of the entire observation and the spectra (Table 1) at an EPIC-pn count rate (0.2–0.5 keV, corrected for
from the flaring and quiescent intervals were simulatenously fit- vignetting) of (8.9 ± 0.8) ×10−3 cts s−1 . No optical counterpart
ted. We left the blackbody temperature, the NHLMC , and a nor- was found for the object in the OGLE database (Fig. 2) nor in
malisation constant (to account for an overall change in flux) the Gaia catalogues within the X-ray error circle.
free. Due to the insufficient statistical quality of the spectra, The source was detected at a relatively small off-axis angle,
no change in the spectral parameters, except the normalisation, therefore allowing detailed timing and spectral analyses of the
could be detected within uncertainties. The peak luminosity dur- EPIC-pn data. We first analysed the EPIC-pn light curve in
A26, page 6 of 9C. Maitra and F. Haberl: Super-soft X-ray sources in XMM-Newton observations of the LMC
2
1.5
Normalized Intensity
1
Fig. 7. Lomb-Scargle periodogram of the combined EPIC light curve of
XMMU J044626.6−692011 (0.2–2 keV). The dashed red line marks the 0.5
3σ confidence level.
0 0.5 1 1.5
the energy range 0.2–2 keV using a Lomb-Scargle periodogram Phase
analysis (Lomb 1976; Scargle 1982). A period was found at Fig. 8. EPIC-pn light curve of XMMU J044626.6−692011 in the 0.2–
∼496 s along with the first harmonic. The signal was somewhat 2 keV band folded at the best-fit spin period.
enhanced when using the combined EPIC (pn+M1+M2) light
curve, and the periodogram is shown in Fig. 7. The pulse period
and its associated 1σ error were determined to be 497.4 ± 1.6 s.
The XMM-Newton EPIC-pn light curve in the range of 0.2– 5.1. XMMU J050452.0−683909 = SMP LMC 21
2 keV, folded with the best-obtained period, is shown in Fig. 8. J0504 is identified as the central star of the PN SMP LMC 21 in
The period is in the typical range observed from IPs and likely the LMC. SMP LMC 21 is a high excitation PN (Morgan
indicates the spin period of the WD. 1984) that exhibits a quadrupolar morphology of 1.1500 extent
The EPIC-pn spectrum is well represented by an absorbed (Stanghellini et al. 1999). The chemical composition from opti-
blackbody component, with an indication for a weak hard tail cal observations suggests a Type I PN hosting a relatively mas-
(Fig. 3). The best-fit spectral parameters are listed in Table 3. sive progenitor from the asymptotic giant branch (Stanghellini
Because of very large uncertainties in temperature and absorp- et al. 2007, and references therein). Using archival observa-
tion, the luminosity of the blackbody component cannot be reli- tions from 2009, Mereghetti et al. (2010) derived an upper
ably determined. Assuming the formally best-fit parameters, the limit of the unabsorbed X-ray luminosity of 3 × 1035 erg s−1
contribution of the bremsstrahlung emission to the total lumi- (see Table 5 in their paper). In this work we detect the source
nosity is completely negligible and could also be caused by a with high confidence, and our results indicate a much higher
background-subtraction problem. Assuming J0446 is located at X-ray luminosity. The soft spectrum and derived high luminosity
LMC distance, the inferred size of the emission area is consistent (∼2 × 1037 erg s−1 ) imply that its X-ray emission originates from
with emission from the full surface of a WD. The measured LMC the central star rather than from the surrounding hot shocked
NH = 6.4 × 1021 cm−2 is the highest of the sources studied in this gas. After SMP LMC 29 (Kahabka et al. 2008), this is the second
work and leads to an unabsorbed luminosity of 7 × 1036 erg s−1 . known PN in the LMC to emit soft X-rays. Two such systems
We caution that this value is strongly dependent on the actual are also known in the SMC (SMP SMC 22 and SMP SMC 25;
absorption along the line of sight to this source. If we assume a Mereghetti et al. 2010), and from a simple estimate based on
source location in the Milky Way at a distance of 1 kpc, the lumi- the mass ratio of the two galaxies, one would expect many more
nosity and radius of the emitting area are Lbol = 5 × 1033 erg s−1 to be detected in the LMC. This deficit could be caused partly by
and RBB = 87 km (Table 3). the lower coverage of the LMC with X-ray observations, but also
J0446 is located at the western rim of the LMC and was by the stronger diffuse soft X-ray emission in the LMC, which
only covered by a short (9 ks) ROSAT/HRI observation with reduces the sensitivity for the detection of faint point sources
the source at a large off-axis angle of ∼170 , which does with soft X-ray spectra.
not yield a stringent upper limit for the flux. No pointed
ROSAT observations with the more sensitive PSPC detector nor
Swift observations were performed at that location. 5.2. XMMU J051854.8−695601 and
XMMU J050815.1−691832: Galactic soft intermediate
polars
5. Discussion
J0518 and J0508 show very similar spectral properties. Their soft
From a systematic search for new SSSs in the XMM-Newton blackbody-like emission can be characterised by a temperature
data of the Magellanic Clouds, we report the discovery of four between 70–100 eV, and both show a hard tail dominating the
sources in the direction of the LMC. We also used OGLE spectrum above 2 keV, an absorption-corrected X-ray luminos-
data to search for their possible optical counterparts and used ity of a few 1035 erg s−1 (assuming LMC distance), and a corre-
archival ROSAT and Swift observations to investigate their long- sponding size of the emission area of ∼100–400 km in radius. All
term behaviour. One of the sources, XMMU J051854.8-695601, of the above is reminiscent of the properties of soft IPs, except
was in the field of view of eROSITA during the CalPV phase and that the luminosities and emission areas are larger than those
was studied in this work. measured from soft IPs in our Galaxy (for a comparison, see
A26, page 7 of 9A&A 657, A26 (2022)
Table 4. Cataclysmic variables with blackbody-like soft X-ray emission and fast spinning WDs.
Source Other name Periods (a) Distance (b) kT (c) LBB RBB Fluxes (d)
(pc) (eV) (erg s−1 ) (km) (erg cm−2 s−1 )
RX J0512.2−3241 UU Col 863.5 s/3.45 h 2429 73 2.1 × 1032 7.6 5.1 × 10⁻¹³ –3.5 × 10⁻¹²
RX J0558.0+5353 V 405 Aur 545.5 s/4.15 h 662 64.8 2.3 × 1032 31.8 1.0 × 10⁻¹¹ –2.3 × 10⁻¹¹
1E 0830.9−2238 WX Pyx 1557.3 s/∼5.54 h 1591 82 1.8 × 1032 5.6 2.3 × 10⁻¹³ –4.9 × 10⁻¹³
RE 0751+14 PQ Gem 833.7 s/5.19 h 750 47.6 9.0 × 1032 36.9 4.7 × 10⁻¹² –6.2 × 10⁻¹¹
1RXS J154814.5−452845 NY Lup 693.0 s/9.87 1228 104 7.8 × 1032 7.2 4.7 × 10⁻¹² –1.8 × 10⁻¹¹
Notes. (a) Spin period of the WD and binary period. (b) Distances from Gaia DR2 (Bailer-Jones et al. 2018). (c) Blackbody temperatures and bolomet-
ric fluxes to compute the bolometric luminosity, LBB , and the emission radius, RBB , of the blackbody component are taken from Evans & Hellier
(2007). (d) Observed flux range in the 0.2–2 keV band; for details, see Sect. 5.
Table 4). Alternatively, the two sources could be located at dis- soft X-rays. The spin period measurement suggests an orbital
tances of around 1 kpc, which would make their luminosities and period of ≥1.4 hrs for J0446 (Pspin ∼ 0.1Porb ; Norton et al.
emission radii consistent with the typical values measured from 2004). However, the location of the source, either in the LMC or
Galactic soft IPs. For this purpose, we simplified the spectral our Galaxy, is less clear. Assuming the best-fit spectral param-
model by fitting only one column density for gas with solar ele- eters, the luminosity and size of the emission region at LMC
mental abundances. The inferred best-fit parameters are listed in distance are consistent with a WD with nuclear burning on its
the lower part of Table 3 and are consistent with those measured surface near the Eddington limit. In this case, J0446 could be
for Galactic soft IPs (Table 4). similar to 1RXS J050526.3−684628 in the LMC, which exhibits
J0518 has likely been a persistent SSS since at least the 170 s pulsations (Vasilopoulos et al. 2020). The soft X-ray emis-
1990s, as the detections in archival ROSAT and Swift data and sion from both sources could be due to residual nuclear sur-
the recent eROSITA CalPV observations suggest. A variation in face burning after a nova eruption. While the evolution of the
the amount of absorption column density is, however, observed X-ray luminosity of 1RXS J050526.3−684628 could be fol-
between the XMM-Newton and eROSITA observations from lowed for about 30 years (the first detections were in
2012 and 2019, respectively, leading to significantly differ- ROSAT data), J0446 was not detected during the ROSAT all-sky
ent observed fluxes. J0508 exhibits variability on timescales of survey, implying that at least the onset of the super-soft phase
hours, as seen in the form of flaring behaviour in the XMM- – and probably also the nova outburst – of J0446 occurred later
Newton observation. Intermediate polars are known to exhibit than that of 1RXS J050526.3−684628.
flaring behaviour on short timescales, which may arise in the tur- On the other hand, the spectral model for J0446 with
bulent inner region of the accretion disk or from bright spots on one absorption component yields an absorption-corrected 0.1–
the surface of the WD (Barbera et al. 2017; Hellier 2001). The 2.4 keV luminosity of 5 × 1033 erg s−1 for a distance of 1 kpc.
largest flux variations on long-term timescales, by about a factor The expected Lx of IPs range from 3 × 1029 erg s−1 to 5 ×
of six, were also seen from J0508 (Fig. 6), which could be caused 1033 erg s−1 (Ruiter et al. 2006), and with the above argu-
by flaring activity similar to that seen during the XMM-Newton ment, J0446 could be a soft IP located in our Galaxy at
observation (Fig. 5). For comparison, we used the HIgh-energy a distance of ≤1 kpc. The measured NH is higher than the
LIght-curve GeneraTor7 to produce 0.2–2 keV light curves from expected total Galactic column density in the direction of
archival ROSAT, XMM-Newton, and Swift observations of the the source (NH = NHI + 2NH2 ≈ 2 × 1021 cm−2 ; Willingale et al.
Galactic soft IPs that are listed in Table 4. From the available 2013). This is indicative of obscuration local to the binary sys-
spectral models, we selected the blackbody with kT = 60 eV and tem, which is common in IPs. Future deeper observations to
NH = 1 × 1021 cm−2 , and the inferred minimum and maximum firmly establish the presence of the hard tail in the X-ray spec-
fluxes are summarised in Table 4. The somewhat higher vari- trum can help to ascertain the IP nature of this source or, if
ability of the Galactic soft IPs, as seen in Table 4, is likely due instead its absence is confirmed, allow the IP nature to be dis-
to the larger number of available observations compared to the regarded.
newly discovered systems.
5.4. New Galactic magnetic cataclysmic variables
5.3. XMMU J044626.6−692011 From our four new sources, which show super-soft X-ray emis-
The X-ray spectrum and the pulsations of ∼497 s suggest sion, at least two (J0518 and J0508) are most likely located in
an mCV nature for J0446 as well. The coherent pulsa- our own Galaxy. Kahabka & Haberl (2006) reported the XMM-
tions denote the spin period of the WD. Several other SSSs Newton detection of the SSS candidate RX J0059.4−7118 in
with measured spin periods were discovered in XMM-Newton the direction of the SMC and confirmed its super-soft X-ray
observations of M 31: XMMU J004319.4+411758, a transient spectrum, which is characterised by a blackbody component
source with period of ∼865 s (Osborne et al. 2001), and with a temperature of ∼90 eV and an additional hard spectral
XMMU J004252.5+411540, with a period of ∼218 s (Tru- component. Similarly, the high luminosity of RX J0059.4−7118
dolyubov & Priedhorsky 2008). In one case, an SSS with of ∼4 × 1034 erg s−1 , if located at SMC distance, let the
1110 s pulsations could be identified with nova M31N 2007-12b authors argue for a Galactic mCV. Given the similarities of
(Pietsch et al. 2011), strongly suggesting that the nova erupted RX J0059.4−7118 with J0518 and J0508, we support this con-
in an IP system and that residual nuclear surface burning is clusion and suggest the object to be a soft IP located in
detected after the ejected envelope became optically thin for our Galaxy. Another case with super-soft X-ray emission in
the direction of the LMC is the double-degenerate candi-
7
http://xmmuls.esac.esa.int/upperlimitserver/ date 3XMM J051034.6−670353, which exhibits 1418 s X-ray
A26, page 8 of 9C. Maitra and F. Haberl: Super-soft X-ray sources in XMM-Newton observations of the LMC
pulsations (Haberl et al. 2017). For an LMC distance, this sys- Burwitz, V., Reinsch, K., Beuermann, K., & Thomas, H.-C. 1996, A&A, 310,
tem exhibits a luminosity of around 5 × 1034 erg s−1 and a radius L25
Carpano, S., Haberl, F., Maitra, C., et al. 2021, A&A, submitted,
for the emitting area of ∼180 km. The detection of a 23.6 min [arXiv:2106.14536]
periodic modulation in the optical and identification of the opti- Cropper, M. 1990, Space Sci. Rev., 54, 195
cal counterpart confirms a location of the binary system in our Cropper, M., Harrop-Allin, M. K., Mason, K. O., et al. 1998, MNRAS, 293, L57
Galaxy (Ramsay et al. 2018). Dickey, J. M., & Lockman, F. J. 1990, ARA&A, 28, 215
Esposito, P., Israel, G. L., Dall’Osso, S., & Covino, S. 2014, A&A, 561, A117
J0518 and J0508, together with RX J0059.4−7118 and Evans, P. A., & Hellier, C. 2007, ApJ, 663, 1277
3XMM J051034.6−670353, make a significant contribution to Evans, P. A., Beardmore, A. P., Page, K. L., et al. 2007, A&A, 469, 379
the known population of such systems in our Galaxy (Haberl Evans, P. A., Beardmore, A. P., Page, K. L., et al. 2009, MNRAS, 397, 1177
Greiner, J. 1996, in Supersoft X-Ray Sources, ed. J. Greiner (Berlin Springer
et al. 2017; Anzolin et al. 2008; Evans & Hellier 2007). The dis- Verlag), Lect. Notes Phys., 472, 299
tance to J0446 is less clear, but it could be another IP system Haberl, F., & Motch, C. 1995, A&A, 297, L37
in our Galaxy. Evans & Hellier (2007) argue that whether IPs Haberl, F., Sturm, R., Ballet, J., et al. 2012, A&A, 545, A128
show a soft emission component mainly depends on the viewing Haberl, F., Israel, G. L., Rodriguez Castillo, G. A., et al. 2017, A&A, 598, A69
Haberl, F., Maitra, C., Carpano, S., et al. 2021, A&A, in press, https://doi.
geometry. Accretion curtains hide the soft emission from the sur- org/10.1051/0004-6361/202141878
face of the WD in the majority of IPs. In addition to the obscura- Hellier, C. 2001, Cataclysmic Variable Stars (Springer)
tion intrinsic to binary systems, the interstellar absorption along Kahabka, P., & van den Heuvel, E. P. J. 1997, ARA&A, 35, 69
the line of sight plays an important role in the detection of the Kahabka, P., & Haberl, F. 2006, A&A, 452, 431
Kahabka, P., Haberl, F., Pakull, M., et al. 2008, A&A, 482, 237
soft emission. A higher density of known sources in the direc- Kuulkers, E., Norton, A., Schwope, A., & Warner, B. 2006, in X-rays from cat-
tion of the Magellanic Clouds can likely be explained by the aclysmic variables, eds. W. H. G. Lewin, & M. van der Klis, 421
relatively low Galactic column density and the large number of Lomb, N. R. 1976, Ap&SS, 39, 447
Long, K. S., Helfand, D. J., & Grabelsky, D. A. 1981, ApJ, 248, 925
existing X-ray observations sensitive to low energies. Maggi, P., Haberl, F., Kavanagh, P. J., et al. 2016, A&A, 585, A162
Maitra, C., Haberl, F., Ivanov, V. D., Cioni, M.-R. L., & van Loon, J. T. 2019,
Acknowledgements. We thank the referee for useful comments and suggestions A&A, 622, A29
which helped to improve the manuscript. This work used observations obtained Maitra, C., Haberl, F., Sasaki, M., et al. 2021, A&A, in press, https://doi.
with XMM-Newton, an ESA science mission with instruments and contributions org/10.1051/0004-6361/202141104
directly funded by ESA Member States and NASA. The XMM-Newton project Mereghetti, S., Krachmalnicoff, N., La Palombara, N., et al. 2010, A&A, 519,
is supported by the DLR and the Max Planck Society. This research has made A42
use of the VizieR catalogue access tool, CDS, Strasbourg, France. The origi- Morgan, D. H. 1984, MNRAS, 208, 633
nal description of the VizieR service was published in A&AS 143, 23. This work Mukai, K. 2017, PASP, 129, 062001
made use of data supplied by the UK Swift Science Data Centre at the University Norton, A. J., Wynn, G. A., & Somerscales, R. V. 2004, ApJ, 614, 349
of Leicester. The OGLE project has received funding from the National Science Osborne, J. P., Borozdin, K. N., Trudolyubov, S. P., et al. 2001, A&A, 378, 800
Centre, Poland, grant MAESTRO 2014/14/A/ST9/00121 to AU. This work used Pietrzyński, G., Graczyk, D., Gieren, W., et al. 2013, Nature, 495, 76
data from eROSITA, the soft X-ray instrument on board SRG, a joint Russian- Pietsch, W., Henze, M., Haberl, F., et al. 2011, A&A, 531, A22
German science mission supported by the Russian Space Agency (Roskosmos), Predehl, P., Andritschke, R., Arefiev, V., et al. 2021, A&A, 647, A1
in the interests of the Russian Academy of Sciences represented by its Space Ramsay, G., Marsh, T. R., Kupfer, T., et al. 2018, A&A, 617, A88
Research Institute (IKI), and the Deutsches Zentrum für Luft- und Raumfahrt Reid, W. A., & Parker, Q. A. 2006, MNRAS, 373, 521
(DLR). The SRG spacecraft was built by Lavochkin Association (NPOL) and Rolleston, W. R. J., Trundle, C., & Dufton, P. L. 2002, A&A, 396, 53
its subcontractors, and is operated by NPOL with support from the Max Planck Roming, P. W. A., Kennedy, T. E., Mason, K. O., et al. 2005, Space Sci. Rev.,
Institute for Extraterrestrial Physics (MPE). The development and construction 120, 95
of the eROSITA X-ray instrument was led by MPE, with contributions from the Ruiter, A. J., Belczynski, K., & Harrison, T. E. 2006, ApJ, 640, L167
Dr. Karl Remeis Observatory Bamberg & ECAP (FAU Erlangen-Nürnberg), the Sasaki, M., Haberl, F., & Pietsch, W. 2000, A&AS, 143, 391
University of Hamburg Observatory, the Leibniz Institute for Astrophysics Pots- Scargle, J. D. 1982, ApJ, 263, 835
dam (AIP), and the Institute for Astronomy and Astrophysics of the University of Schlafly, E. F., & Finkbeiner, D. P. 2011, ApJ, 737, 103
Tübingen, with the support of DLR and the Max Planck Society. The Argelander Stanghellini, L., Blades, J. C., Osmer, S. J., Barlow, M. J., & Liu, X. W. 1999,
Institute for Astronomy of the University of Bonn and the Ludwig Maximilians ApJ, 510, 687
Universität Munich also participated in the science preparation for eROSITA. Stanghellini, L., García-Lario, P., García-Hernández, D. A., et al. 2007, ApJ,
The eROSITA data shown here were processed using the eSASS software system 671, 1669
developed by the German eROSITA consortium. Strüder, L., Briel, U., Dennerl, K., et al. 2001, A&A, 365, L18
Sturm, R., Haberl, F., Pietsch, W., et al. 2013, A&A, 558, A3
Trudolyubov, S. P., & Priedhorsky, W. C. 2008, ApJ, 676, 1218
References Turner, M. J. L., Abbey, A., Arnaud, M., et al. 2001, A&A, 365, L27
Udalski, A., Szymanski, M., Kaluzny, J., Kubiak, M., & Mateo, M. 1992, Acta
Anzolin, G., de Martino, D., Bonnet-Bidaud, J.-M., et al. 2008, A&A, 489, Astron., 42, 253
1243 Udalski, A., Szymański, M. K., & Szymański, G. 2015, Acta Astron., 65, 1
Arnaud, K. A. 1996, in Astronomical Data Analysis Software and Systems V, van den Heuvel, E. P. J., Bhattacharya, D., Nomoto, K., & Rappaport, S. A. 1992,
ASP Conf. Ser., 101, 17 A&A, 262, 97
Bailer-Jones, C. A. L., Rybizki, J., Fouesneau, M., Mantelet, G., & Andrae, R. Vasilopoulos, G., Koliopanos, F., Woods, T. E., et al. 2020, MNRAS, 499, 2007
2018, AJ, 156, 58 Willingale, R., Starling, R. L. C., Beardmore, A. P., Tanvir, N. R., & O’Brien,
Barbera, E., Orlando, S., & Peres, G. 2017, A&A, 600, A105 P. T. 2013, MNRAS, 431, 394
Boller, T., Freyberg, M. J., Trümper, J., et al. 2016, A&A, 588, A103 Wilms, J., Allen, A., & McCray, R. 2000, ApJ, 542, 914
Brunner, H., Liu, T., Lamer, G., et al. 2021, A&A, submitted, Wolf, W. M., Bildsten, L., Brooks, J., & Paxton, B. 2013, ApJ, 777, 136
[arXiv:2106.14517] Zaritsky, D., Harris, J., Thompson, I. B., & Grebel, E. K. 2004, AJ, 128, 1606
A26, page 9 of 9You can also read