Economic and Market Outlook
←
→
Page content transcription
If your browser does not render page correctly, please read the page content below
Economic and Market Outlook

First Quarter 2022

 Investment Products: Not FDIC Insured • No Bank Guarantee • May Lose Value

Past performance is no guarantee of future
results. Financial term and index definitions are
available in the appendix.
                                                                              1
Table of Contents
Investor Pitfalls

                    3
Economic Outlook

                   10
Market Outlook

                 25
International Outlook

                        37
Market Leadership

                    43
2Investor Pitfalls
3Probabilities vs. Possibilities
The Wall of Worry
Equity Valuations Fed Policy Error Civil Unrest
Fiscal Cliff Midterm Elections
Dollar Debasement COVID-19 Sovereign Debt Crisis
Taper Tantrum Inflation
Corporate Leverage China Over-Tightening
Populism EM Problems Intensify
4S&P 500 & Panic Attacks
5,000
China Property
Market Contagion
4,500 Omicron
Variant
4,000
Rising
Potential Rate
2/10 Second Scare
Tariffs Scheduled
3,500 Endgame Trade War Yield Wave
for Last $300B of
Panic Escalation Imports Curve
Inversion
US
Brent Quitaly Fed Election
Fears Communication
3,000 Bottoms
Error
Concerns
at $27.88
Japan Trump Trade Fiscal
Goes Impeachment War Cliff
Trade
NIRP Scare Escalates Fears
2,500 Short War
Brexit Volatility Accelerates
Unwind
2,000 N. Korea Pandemic
U.S. Gov. China
Rate Crisis COVID-19 Goes
Shutdown
WTI Hike Shutdown Global
Bottoms Scare
1,500
2016 2017 2018 2019 2020 2021
“The definition of insanity is doing the same thing over and over again and expecting a different result.”
- Attributed to Albert Einstein
Data as of Dec. 31, 2021. Source: Standard & Poor’s. Past performance is not a guarantee of future results. Investors cannot
invest directly in an index, and unmanaged index returns do not reflect any fees, expenses or sales charges. 5Effects of Panic Attacks on Average Investors
20 Years Annualized Returns (2001-2020)
12
10
10.0%
8
7.5%
6
5.0% 4.8%
4
3.7%
2.9%
2
2.1%
0
REITs U.S. Stock International Government Homes AverageInvestor
Average Investor Inflation
Equities Related Bonds
Investment Returns
Source: Bloomberg, June 30, 2021. Average asset allocation investor return is based on an analysis by DALBAR, Inc., which utilizes the net of aggregate mutual
fund sales, redemptions and exchanges each month as a measure of investor behavior. Indices shown are as follows: REITs are represented by the NAREIT
Equity REIT Index, U.S. Stocks are represented by the S&P 500 Index, International Equities are represented by the MSCI EAFE Index, Government-Related
Bonds are represented by the Bloomberg Barclays U.S. Aggregate Bond Index, Homes are represented by U.S. existing home sales median price, Inflation is
represented by the Consumer Price Index. Indices are unmanaged and cannot be purchased directly by investors. Index performance is shown for illustrative
purposes only and does not predict or depict the performance of any investment. Past performance is no guarantee of future results. 6Volatility Does Not Equal a Financial Loss Unless You Sell
50%
40%
30%
Median
20% Annualized
Total Return
10% +15.8%
0%
Median
Intra-Year
-10% Price Decline
-9.9%
-20%
-30%
-40%
-50%
1983 1985 1987 1989 1991 1993 1995 1997 1999 2001 2003 2005 2007 2009 2011 2013 2015 2017 2019 2021
S&P 500 Calendar Year Total Return S&P 500 Largest Intra-Year Price Decline (%)
As of Dec. 31, 2021. Source: FactSet. Past performance is not a guarantee of future results. Investors cannot invest directly in
an index, and unmanaged index returns do not reflect any fees, expenses or sales charges. 7Can You Time the Market?
Growth of $100: Buy and Hold vs. Market Timing Since 1936
$100,000
Cumulative
Return:
$35,489
$10,000 Cumulative
Return:
$10,978
Cumulative Return (Log Scale)
$1,000
$100
$10
$1
1936 1946 1956 1966 1976 1986 1996 2006 2016
Cumulative Return: Buy & Hold Cumulative Return: Sell 10 Months Before Peak, Buy 10 Months After Trough
Since 1936, an investor that consistently sold 10 months prior to a market peak and bought
back 10 months after the trough was worse off overall than a buy-and-hold investor.
Data as of Dec. 31, 2021. Source: Yardeni Research. Past performance is not a guarantee of future results. Investors cannot
invest directly in an index, and unmanaged index returns do not reflect any fees, expenses or sales charges. 8Market Annual Returns
Distribution of S&P 500 Total Returns Since 1926
36
36
1927
1928
1933
32 1935
1936
1938
25 Negative Years 1942
28 1943
71 Positive Years 1945
1950
Positive 74% of the time since 1926
1951
24 1954
1955
1958
21
1961
20 1926 1963
Years
1944 1967
1949 1975
1952 1976
1959 1980
16
1964 1982
14 14 1983
1965
1929 1947 1968 1985
1932 1948 1971 1989
12 1991
1934 1956 1972
1939 1960 1979 1995
1940 1970 1986 1996
1946 1978 1988 1997
8 1984 1998
1953 1993
6 1962 1987 2004 1999
5 1969 1992 2006 2003
1930
1931 1941 1977 1994 2010 2009
4 1981 2005 2013
1937 1957 2012
1974 1966 1990 2007 2014 2017
2002 1973 2000 2011 2016 2019
2008 2001 2018 2015 2020 2021
0
20%
S&P 500 Annual Total Return Ranges
As of Dec. 31, 2021. Source: FactSet. Past performance is not a guarantee of future results. Investors cannot invest directlyin
an index, and unmanaged index returns do not reflect any fees, expenses or sales charges. 9Economic Outlook
10S&P 500 Market Crashes vs. Pullbacks
Crashes are longer, more extreme, and more likely to be followed by a recession
Market Crashes Pullbacks
S&P 500 S&P 500
S&P Return: Peak S&P Return: Peak
Peak Trough Days Recession Peak Trough Days Recession
500 to Trough 500 to Trough
+1 Year +1 Year
Nov. 1968 May 1970 543 -36% -8% Yes Sept. 1976 March 1978 531 -19% -9% No
Jan. 1973 Oct. 1974 630 -48% -29% Yes Feb. 1980 March 1980 43 -17% 14% Yes
Nov. 1980 Aug. 1982 621 -27% 15% Yes July 1990 Oct. 1990 87 -20% 3% Yes
Aug. 1987 Dec. 1987 101 -34% -18% No July 1998 Oct. 1998 83 -19% 13% No
March 2000 Oct. 2002 929 -49% -32% Yes April 2010 July 2010 70 -16% 10% No
Oct. 2007 March 2009 517 -57% -27% Yes April 2011 Oct. 2011 157 -19% 6% No
Average 557 -42% -16% 83% Sept. 2018 Dec. 2018 82 -19% 10% No
Feb. 2020 March 2020 33 -34% 15% Yes
Average 137 -21% 8% 38%
4.1x longer 2.2x more
557
than 83% likely to
a pullback -21% coincide with
a recession
2.0x as
severe 38%
137 -42%
Days S&P 500 Drawdown Recession Probability
Market Crashes Pullbacks
Market Crashes defined as decline of 20% or greater in S&P 500 lasting at least 1 year. Pullbacks defined as declines of 15% or greater in S&P 500 (no
time component). 1987 decline persisted at 20% or greater loss 1 year after Aug. 1987 peak despite trough coming in Dec. 1987. Source: S&P, NBER,
and Bloomberg. Past performance is not a guarantee of future results. Investors cannot invest directly in an index, and unmanaged index returns do
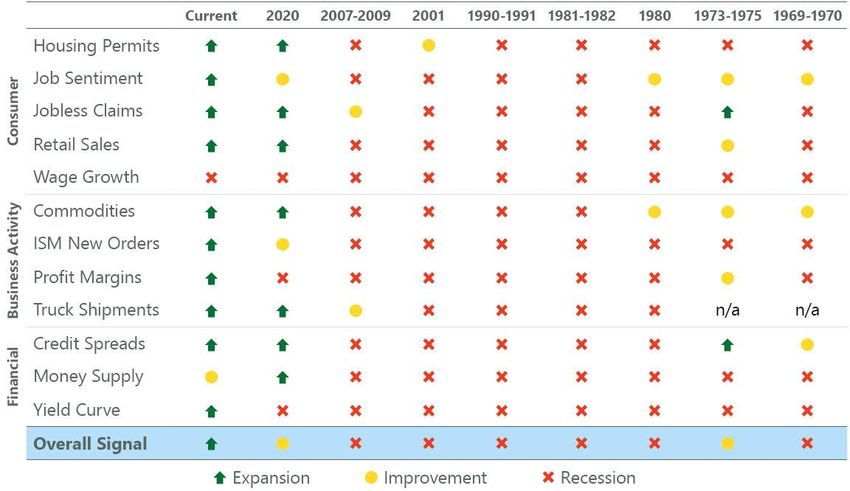
not reflect any fees, expenses or sales charges. 11U.S. Recession Risk Indicators
• 12 variables have historically foreshadowed a looming recession
• Wage growth and money supply are flashing risk right now
Data as of Dec. 31, 2021. Source: BLS, Federal Reserve, Census Bureau, ISM, BEA, American Chemistry Council, American Trucking Association,
Conference Board, and Bloomberg. The ClearBridge Recession Risk Dashboard was created in January 2016. References to the signals it would have sent
in the years prior to January 2016 are based on how the underlying data was reflected in the component indicators at the time. 12U.S. Recession Risk Indicators
• 12 variables have historically foreshadowed a looming recession
• Wage growth and money supply are flashing risk right now
Data as of Dec. 31, 2021. Source: BLS, Federal Reserve, Census Bureau, ISM, BEA, American Chemistry Council, American Trucking Association,
Conference Board, and Bloomberg. The ClearBridge Recession Risk Dashboard was created in January 2016. References to the signals it would have sent
in the years prior to January 2016 are based on how the underlying data was reflected in the component indicators at the time. 13U.S. Recession Risk Dashboard
Case Study: 2018-2020
3,400
3,231
3,200
2,942
3,000 3,100
S&P 500
2,800 2,718
2,600
2,400 Overall Signal: 2,507 Overall Signal: Overall Signal:
2,200
Q2 2018 Q4 2018 Q2 2019 Q4 2019 Q2 2020
Housing Permits
Job Sentiment
Consumer
Jobless Claims
Retail Sales
Wage Growth
Commodities
Business
Activity
ISM New Orders
Profit Margins
Truck Shipments
Credit Spreads
Financial
Money Supply
Yield Curve
Source: BLS, Federal Reserve, Census Bureau, ISM, BEA, American Chemistry Council, American Trucking Association, Conference Board,
and Bloomberg. The ClearBridge Recession Risk Dashboard was created in January 2016. References to the signals it would have sent in the
years prior to January 2016 are based on how the underlying data was reflected in the component indicators at the time. 14U.S. Recession Indicator: Job Sentiment
Crashes are longer, more extreme, and more likely to be followed by a recession
60 1.00
Conference Board Jobs Plentiful minus Jobs Hard to Get
0.90
40
0.80
0.70
(Employment Conditions)
20
0.60
0 0.50
0.40
-20
0.30
0.20
-40
0.10
-60 0.00
1968 1972 1976 1980 1984 1988 1992 1996 2000 2004 2008 2012 2016 2020
Recession Jobs Plentiful minus Jobs Hard to Get (Employment Conditions)
Consumer sentiment towards the health of the labor market traditionally foreshadows an
impending recession.
At present, the labor differential (jobs plentiful minus jobs hard to get) is near a record
level, suggesting a robust labor market.
Data as of Nov. 30, 2021, latest available as of Dec. 31, 2021. Source: FactSet, Conference Board, National Bureau of Economic Research. Past performance is
not a guarantee of future results. Investors cannot invest directly in an index, and unmanaged index returns do not reflect any fees, expenses or sales charges. 15Labor Market Taking a Back Seat
Crashes are longer, more extreme, and more likely to be followed by a recession
150 60
Conference Board Jobs Plentiful minus Jobs Hard to Get
140
40
130
U. of Michigan Consumer Sentiment
120
(Employment Conditions)
20
110
100 0
90
-20
80
70
-40
60
50 -60
1988 1991 1994 1997 2000 2003 2006 2009 2012 2015 2018 2021
Recession U. of Michigan Consumer Sentiment (LHS) Jobs Plentiful minus Jobs Hard to Get (Employment Conditions) (RHS)
Consumer sentiment has historically moved in tandem with perceptions of labor market
strength.
With inflation becoming a primary worry for many Americans, this relationship appears
to be breaking down.
Data as of Nov. 30, 2021, latest available as of Dec. 31, 2021. Source: FactSet, Conference Board, University of Michigan Survey of Consumers, National
Bureau of Economic Research. Past performance is not a guarantee of future results. Investors cannot invest directly in an index, and unmanaged index
returns do not reflect any fees, expenses or sales charges. 16What’s Driving Inflation
6%
5%
Contribution to Core CPI (YoY)
4%
3%
2%
1%
0%
-1%
Jan. 2018 Jul. 2018 Jan. 2019 Jul. 2019 Jan. 2020 Jul. 2020 Jan. 2021 Jul. 2021
OER Services ex-OER Goods ex-Used Cars Used Cars
Much of the upside in inflation relative to the pre-pandemic trend has come from
goods, particularly used cars.
Among G7 countries, 93% of growth in goods consumption since the onset of the
pandemic has come from the U.S.
OER stands for Owners Equivalent Rent, the amount of rent that would have to be paid in order to substitute a currently owned house as a rental
property. Data as of Nov. 30, 2021, latest available as of Dec. 31, 2021. Source: BLS, Bloomberg. Past performance is not a guarantee of future results.
Investors cannot invest directly in an index, and unmanaged index returns do not reflect any fees, expenses or sales charges. 17Goods Inflation Regime Shift?
Crashes are longer, more extreme, and more likely to be followed by a recession
Core CPI: Goods vs. Services Cumulative Inflation Since 2000
90%
80%
70%
60%
Cumulative Inflation
50%
40%
30%
20%
10%
0%
-10%
2000 2005 2010 2015 2020
Goods Services Core CPI
In the two decades prior to the pandemic, there was no goods inflation in the U.S.
While services inflation has picked up, sustained higher inflation would require a
regime shift in goods prices.
Data as of Nov. 30, 2021, latest available as of Dec 31, 2021. Source: BLS and Bloomberg. Past performance is not a guarantee of
future results. Investors cannot invest directly in an index, and unmanaged index returns do not reflect any fees, expenses or
sales charges. 18Is U.S. Debt Really an Issue?
Net Interest Payments in Budget as Share of GDP
4%
3%
2%
1%
0%
1980 1990 2000 2010 2020 2030
Net Interest Payments in Budget as Share of GDP Forecast
Despite a dramatic increase in government debt outstanding, total debt servicing costs as a
percent of GDP have declined due to falling rates.
While this could become a risk in the next decade, the intermediate-term outlook appears
less troubling.
Source: Congressional Budget Office. Past performance is not a guarantee of future results. Investors cannot invest directly in
an index, and unmanaged index returns do not reflect any fees, expenses or sales charges. 19Consumer Outlook Dependent on Wages
Compensation, Consumption, & CPI
30%
25%
20%
15%
13.5%
10% 9.5%
6.9%
5%
0%
-5%
-10%
-15%
2015 2017 2019 2021
Aggregate Weekly Payrolls Personal Consumption Expenditures CPI
Consumption is closely tied to changes in income, both of which have run ahead of
inflation in recent years.
Currently, compensation is easily outpacing inflation, which bodes well for above-trend
consumption continuing in 2022.
Data as of Nov. 30, 2021, latest available as of Dec. 31, 2021. Source: BLS, BEA, and Bloomberg. Past performance is not a
guarantee of future results. Investors cannot invest directly in an index, and unmanaged index returns do not reflect any fees,
expenses or sales charges. 20Not The Global Financial Crisis: Labor
U.S. Job Openings Household Cash in Months of After-Tax Income
12 7
Average 6.1
6 Income:
10 $50-100K
5 Average
Income:
$36K
Millions
8 4
Months
3.2
2.9
3
6 2.2
2.0 2.0
2 1.6
4 0.9 0.8 0.9
1
2 0
2004 2006 2008 2010 2012 2014 2016 2018 2020 Lowest 20% Second 20% Third 20% Fourth 20% Top 20%
Recession U.S. Job Openings Q4 2019 Q3 2021
Source: DOL, FactSet. Source: Jefferies, Haver, JEF Economics.
Job openings have surged following the COVID-19 crisis with approximately 3.5 million more
today relative to the prior peak.
Middle income households have accumulated 2 additional months worth of after-tax income
in cash.
As these cash reserves dwindle, many individuals should return to the workforce.
Data as of Nov. 30, 2021, latest available as of Dec. 31, 2021. Past performance is not a guarantee of future results. Investors cannot invest directly in an index,
and unmanaged index returns do not reflect any fees, expenses or sales charges. 21Aren’t Recessions Supposed to be Painful?
$160
$140
$120
U.S. Households Net Worth (Trillion)
$100
$80
$60
$40
$20
1997 1999 2001 2003 2005 2007 2009 2011 2013 2015 2017 2019 2021
Recession U.S. Households Net Worth
Historically, recessions have put a dent in household net worth.
Since the end of 2019 (pre-COVID), U.S. household net worth has increased
by $28 trillion (23.9%).
Data as of Sept. 30, 2021, latest available as of Dec. 31, 2021. Source: Federal Reserve Bank of St. Louis. Past performance is not
a guarantee of future results. Investors cannot invest directly in an index, and unmanaged index returns do not reflect any fees,
expenses or sales charges. 22Capex Takes the Baton
45% 25%
?
35% 20%
15%
25%
10%
S&P 500 12 Month Forward EPS
15%
U.S. Non-Residential Capex
5%
5%
0%
-5%
-5%
-15%
-10%
-25%
-15%
-35% -20%
-45% -25%
1997 1999 2001 2003 2005 2007 2009 2011 2013 2015 2017 2019 2021
Recession S&P 500 12-Month Forward EPS (% YoY, Forward 1Q) (LHS) U.S. Non-Residential Capex (RHS)
Capital expenditures typically follow earnings growth, as companies reinvest profits back into
their business.
The robust growth backdrop suggests a coming pickup in capital spending, which should drive
the next leg of economic growth.
Data as of Sept. 30, 2021, latest available as of Dec. 31, 2021. Source: Bloomberg, Factset, Federal Reserve System. Past performance is not a guarantee
of future results. Investors cannot invest directly in an index, and unmanaged index returns do not reflect any fees, expenses or sales charges. 23The New (Old) Normal?
8%
6% Best growth in 37 years
4% Best growth in 18 years (excluding 2021)
U.S. Real GDP
2%
0%
-2%
-4%
2021e
2022e
2023e
2024e
1986
1987
1990
1991
1994
1995
1999
2000
2003
2004
2007
2008
2011
2012
2015
2016
2020
1984
1985
1988
1989
1992
1993
1996
1997
1998
2001
2002
2005
2006
2009
2010
2013
2014
2017
2018
2019
Following the COVID-19 GDP collapse, 2021 is expected to see the strongest growth in 37 years.
This strength is currently expected to persist into 2022 with the best GDP growth since 2004
(excluding 2021).
Data as of Dec. 31, 2021. Source: BEA, FactSet. Past performance is not a guarantee of future results. Investors cannot invest
directly in an index, and unmanaged index returns do not reflect any fees, expenses or sales charges. 24Market Outlook
25Early Gains Have Been Digested
S&P 500 Rallies After Bear Markets
220
210
200
190
180
170
160
S&P 500
150
140
130
A Period of Consolidation at
120 this Point in the Cycle is
Common
110
100
90
80
0 5 10 15 20 25 30 35 40 45 50 55 60 65 70 75 80 85 90 95 100 105 110 115 120 125
Number of Weeks
Average Rallies Off 1966, 1970, 1974, 1982, 1987, 2003, 2009, 2018 Lows Rally Since March 2020
Following a substantial rally from the lows, equities typically experienced lackluster returns
as early gains were digested.
With process appearing to be complete, the markets have turned higher, consistent with
historical bull market behavior at this point.
Data as of Dec. 31, 2021. Source: FactSet, S&P Global. Past performance is not a guarantee of future results. Investors cannot
invest directly in an index, and unmanaged index returns do not reflect any fees, expenses or sales charges. 26Midterm Election Years Typically Choppy
80% Average Recovery: 32%
58
60%
1 Year After Correction
Market Performance
44
40
Recovery:
38 38 37
40% 33 33 34
29 31
24
20% 15
12
9
0%
Year of Midterm Elections
Market Correction During
-9 -9 -8 -7
-20% -14 -16
Drawdown:
-17 -19
-22 -20 -20
-27 -26
-40% -34
-38
Average Correction: 19%
-60%
1962 1966 1970 1974 1978 1982 1986 1990 1994 1998 2002 2006 2010 2014 2018
Midterm election years often experience outsized intra-year drawdowns.
Investors have historically been rewarded for capitalizing on this weakness with
robust returns (+32% on average) in the one-year period following the lows.
Source: Standard & Poor’s, Bloomberg. Past performance is not a guarantee of future results. Investors cannot invest directly
in an index, and unmanaged index returns do not reflect any fees, expenses or sales charges. 27Speedy Recovery, Shorter Expansion
140
2011
120 1994
Duration of Expansion (Months)
100
1984
80
2004
60 1976
40
1972
20 2021
0
15 20 25 30 35 40 45 50 55 60 65
Duration of EPS Recovery to Prior Cycle's Peak (Months)
Historically, faster earnings recoveries have led to shorter economic cycles.
The current cycle saw the fastest earnings recovery in modern history.
This could mean the current cycle may be shorter than investors have been accustomed to
in recent decades.
Data as of Nov. 30, 2021, latest available as of Dec. 31, 2021. Source: Bloomberg, National Bureau of Economic Research. Past
performance is not a guarantee of future results. Investors cannot invest directly in an index, and unmanaged index returns do
not reflect any fees, expenses or sales charges. 28Fed Liftoff, Market Breather
S&P 500 Price Change Around Initial Fed Rate Hike
Before Rate Hike After Rate Hike
Date of
-6 Months -3 Months +3 Months +6 Months +12 Months +18 Months
First Raise
Feb. 4, 1994 4.7% 2.7% -3.9% -2.4% 1.9% 19.0%
June 30, 1999 11.7% 6.7% -6.6% 7.0% 6.0% -3.8%
June 30, 2004 2.6% 1.3% -2.3% 6.2% 4.4% 9.4%
Dec. 16, 2015 -1.1% 3.9% -2.2% 0.2% 8.9% 17.4%
Average: 4.5% 3.7% -3.8% 2.8% 5.3% 10.5%
Markets have typically risen leading into the initial Fed rate hike.
After a period of choppiness following liftoff, the market has historically found its footing.
Source: FactSet. Data as of Dec. 31, 2021. Past performance is not a guarantee of future results. Investors cannot invest directly
in an index, and unmanaged index returns do not reflect any fees, expenses or sales charges. 29Higher Rates, Higher Equities
Stock Returns During Historical Rising Rate Environments (10-Year Yield Change > 1.5%)
S&P 500 Russell 2000
Rising Rates Rising Rates Duration Change in 10-Year
Gain/Loss Gain/Loss
Start Date End Date (Months) Treasury Yield
(Annualized) (Annualized)
Dec. 1962 Aug. 1966 45 1.7% 8.1% -
March 1967 Dec. 1969 34 3.6% 3.6% -
March 1971 Sept. 1975 55 3.2% -0.9% -
Dec. 1976 Sept. 1981 58 9.0% 7.3% -
May 1983 May 1984 13 3.9% -3.5% -11.8%
Aug. 1986 Oct. 1987 14 3.3% 13.6% 5.9%
Oct. 1993 Nov. 1994 13 2.9% 1.5% -3.1%
Jan. 1996 July 1996 6 1.5% 6.7% 10.1%
Oct. 1998 Jan. 2000 16 2.6% 35.5% 44.5%
June 2003 June 2006 37 2.1% 9.8% 16.3%
Dec. 2008 April 2010 15 1.9% 28.5% 35.7%
July 2012 Dec. 2013 18 1.6% 28.0% 35.5%
July 2016 Oct. 2018 27 1.9% 16.8% 17.2%
Average: 27 3.0% 11.9% 16.7%
% Positive: 100% 84.6% 77.8%
On average, during periods of rising rates, equities have historically delivered
above-average returns with particular strength in small cap stocks.
Source: FactSet. Past performance is not a guarantee of future results. Investors cannot invest directly in an index, and
unmanaged index returns do not reflect any fees, expenses or sales charges. 30Historic Earnings Surprise
Earnings Beats over the Last Year Have Been Extremely Strong
25%
20%
S&P EPS Surprise Relative to Expectations (%)
15%
10%
5%
0%
?
2Q10
4Q10
2Q12
4Q13
2Q14
4Q15
2Q17
4Q17
4Q18
2Q19
4Q20
2Q09
4Q09
2Q11
4Q11
4Q12
2Q13
4Q14
2Q15
2Q16
4Q16
2Q18
4Q19
2Q20
2Q21
4Q21
-5%
Earnings have handily beat expectations and helped power the market’s rally
over the past 6 quarters.
Data as of Sept. 30, 2021, latest available as of Dec. 31, 2021. Source: FactSet. Past performance is not a guarantee of future results.
Investors cannot invest directly in an index, and unmanaged index returns do not reflect any fees, expenses or sales charges. 31Retail Put Replacing Fed Put?
Global Equity Inflows By Year
$1,200
2021
YTD
$1,000 $913
$800
$600 1996-2020 Cumulative Global Equity Inflows = $179 Billion
Inflows (Billions)
$400
$200
$0
-$200
-$400
1996 1998 2000 2002 2004 2006 2008 2010 2012 2014 2016 2018 2020
Investors allocated more capital to equities in 2021 than over the previous 25 years
combined.
With retail investors stepping in to buy the dips, the market did not experience a
significant drawdown in 2021.
January typically experiences the largest inflows of any month, suggesting the retail
put remains in place as we enter 2022.
As of Nov. 30, 2021, latest available as of Dec. 31, 2021. Source: Goldman Sachs. Past performance is not a guarantee of future results.
Investors cannot invest directly in an index, and unmanaged index returns do not reflect any fees, expenses or sales charges. 32Strength Begets Strength
S&P 500 Index Returns After Greater than 20% Yearly Returns
S&P 500 Return
Year Return Next Year Return
1950 21.8% 16.5%
1954 45.0% 26.4%
1955 26.4% 2.6%
1958 38.1% 8.5%
1961 23.1% -11.8%
1967 20.1% 7.7%
1975 31.5% 19.1%
1980 25.8% -9.7%
1985 26.3% 14.6%
1989 27.3% -6.6%
1991 26.3% 4.5%
1995 34.1% 20.3%
1996 20.3% 31.0%
1997 31.0% 26.7%
1998 26.7% 19.5%
2003 26.4% 9.0%
2009 23.5% 12.8%
2013 29.6% 11.4%
2019 28.9% 16.3%
Average: 11.5%
% Positive: 84.2%
Average All Years 1950-2020: 9.2%
% Positive: 71.8%
Following 20%+ return years, the market has historically tended
to outperform its long-term average.
Price returns reflected in this table. The modern design of the S&P 500 stock index was first launched in 1957. Performance back
to 1955 incorporates the performance of predecessor index, the S&P 90. Source: FactSet, S&P Global. Data as of Dec. 31, 2021.
Past performance is not a guarantee of future results. Investors cannot invest directly in an index, and unmanaged index returns
do not reflect any fees, expenses or sales charges. 33Earnings to Take the Baton
Tech Bubble Global Financial Crisis COVID-19
80% At the end of the first
12-month period that
70% began 9 months after
market low, EPS and
P/E changes are
60%
following the historical
trends.
50%
40%
EPS increase
% Change
30% EPS increase ?
EPS increase
20%
10%
0%
-10% P/E decrease P/E decrease ?
P/E decrease
-20%
+9 Mo +12 Mo +12 Mo +12 Mo +9 Mo +12 Mo +12 Mo +12 Mo +9 Mo +12 Mo +12 Mo
S&P 500
27.9% 10.8% 11.7% 2.5% 62.0% 13.5% 1.9% 15.9% 67.9% 26.9% ?
Returns
EPS P/E
In the nine months following recessionary troughs, multiple expansion has been an outsized
contributor to returns.
As the recovery matures, earnings have typically driven stock upside as multiples contracted.
Data as of Dec. 31, 2021. Source: FactSet, S&P. Past performance is not a guarantee of future results. Investors cannot invest
directly in an index, and unmanaged index returns do not reflect any fees, expenses or sales charges. 34New Secular Bull Market?
S&P 500
16384
1980-2000
All-Time Highs: 500
4096 Cumulative Return:
1950-1970 1,261.2%
All-Time Highs: 365
S&P 500 Index (Log-Scale)
1024 Cumulative Return: 451.9% 2010-Present
All-Time Highs:
345
256 Cumulative
Return: 327%
64
16 1970-1980 2000-2010
All-Time All-Time
Highs: 35 Highs: 13
4 1930-1950 Cumulative Cumulative
All-Time Highs: 0 Return: Return:
Cumulative Return: -22.2% 17.2% -24.1%
1
1930 1940 1950 1960 1970 1980 1990 2000 2010 2020
Secular Bear: Average Drawdown -46.1%
Secular Bull: Average Drawdown -26.1%
In the 12 months following an all-time high, stocks have historically been up 9.0% on
average with positive returns 72% of the time.
Secular bear market average drawdown includes selloff beginning September 1929. Data as of Dec. 31, 2021. Source: Bloomberg, FactSet.
Past performance is not a guarantee of future results. Investors cannot invest directly in an index, and unmanaged index returns do not
reflect any fees, expenses or sales charges. 35Economic and Market Summary
First Quarter 2022
U.S. Economic Outlook U.S. Market Outlook
• U.S. recession risks are well below average • U.S. markets have often experienced choppiness as the
economy and accommodative policy transition from
• The economy should strengthen as Q1 progresses and
early-to mid-cycle
the Omicron wave fades
• Consumer Headwinds < Consumer Tailwinds • Current headwinds include tightening monetary policy,
midterm elections, negative fiscal impulse, and high
• Business investment (capex) should remain robust inflation
with strong global demand and more reliable
• In our view, any selloff would be a good opportunity to
supply chains
reposition for the middle innings of this market cycle
Recession Dashboard Overall Signal
Expansion
All opinions and data included in this commentary are as of the publication date and are subject to change. The opinions and views expressed herein are of the author
and may differ from other portfolio managers or the firm as a whole, and are not intended to be a forecast of future events, a guarantee of future results or investment
advice. This information should not be used as the sole basis to make any investment decision. 36International Outlook
37U.S. vs. International Equity Performance
3.5
U.S. U.S.
3.0 Outperformed Outperformed
174.9% 280.5%
Outperformed
U.S.
2.5
Differences Between Indexes
2.0 77.9%
1.5
1.0
0.5 390.5% 95.8%
International International
Outperformed Outperformed
0.0
1978 1983 1988 1993 1998 2003 2008 2013 2018
Geographic leadership has tended to persist for multiple years.
S&P 500 vs. MSCI EAFE. Data as of Dec. 31, 2021. Source: FactSet. Past performance is not a guarantee of future results.
Investors cannot invest directly in an index, and unmanaged index returns do not reflect any fees, expenses or sales charges. 38Global Consumers Flush
Cumulative Excess Savings as % of 2019 GDP
14%
12%
10%
8%
6%
4%
2%
0%
Japan
France
Germany
U.K.
Canada
Italy
U.S.
Netherlands
Sweden
Spain
Norway
Australia
The inability to spend, combined with government transfer payments, has resulted in
an abundance of savings globally.
As the global economy normalizes, some of these reserves will likely be drawn which
should further fuel the recovery.
As of Sept. 30, 2021, latest available as of Dec. 31, 2021.
Source: Goldman Sachs. Past performance is not a guarantee of future results. Investors cannot invest directly in an index, and
unmanaged index returns do not reflect any fees, expenses or sales charges. 39Regional Leadership Tethered to Pandemic
2.75
U.S. Outperformance
2.70
MSCI USA Index / MSCI Europe ex.-U.K. Index
2.65
2.60
Omicron
2.55
Delta
European Outperformance
2.50
2.45 Beta
2.40
2.35
Sep. 2020 Dec. 2020 Mar. 2021 Jun. 2021 Sep. 2021 Dec. 2021
As new variants have emerged, global growth prospects have dimmed. This has caused
an investor flight to safety, which has typically benefitted U.S. equities.
Should Omicron prove to be the last disruptive wave of the pandemic, European
leadership could reassert itself in 2022.
Data as of Dec. 31, 2021. Source: MSCI, FactSet. Past performance is not a guarantee of future results. Investors cannot invest
directly in an index, and unmanaged index returns do not reflect any fees, expenses or sales charges. 40Global Markets More Cyclical
Cyclical Exposure as Percent of Benchmark
80%
70%
Economic Sector - GICS Direct
60%
50%
40%
30%
20%
10%
0%
Canada Europe Japan Emerging Markets All Country Asia World United States
Most Cyclical Least Cyclical
Energy Financials Industrials Materials
In periods of accelerating economic growth, non-U.S. markets have tended to lead
given greater cyclical exposure.
Cyclical sectors: Financials, Materials, Industrials, Energy. Cyclical exposure by MSCI Region. Data as of Dec. 31, 2021. Source:
FactSet. Past performance is not a guarantee of future results. Investors cannot invest directly in an index, and unmanaged
index returns do not reflect any fees, expenses or sales charges. 41Weaker Dollar Supercharges Non-U.S. Stocks
Dollar’s Impact on Asset Classes Since 1974
40%
35.1
35%
30%
Rolling Annualized Return
25%
20% 18.8
15% 13.6
12.1
10% 8.2 7.6
5.7
5%
0%
-0.8
-5%
S&P 500 Gross Return Investment Grade Bonds MSCI EAFE MSCI EM (Since 2001)
Average when Dollar is Up Average when Dollar is Down
International equities have tended to outperform during periods of dollar weakness.
Data as of Dec. 31, 2021. MSCI EAFE and MSCI EM are net returns; MSCI EM data starts in 2001. Investment Grade Bonds refers to the
Bloomberg Barclays U.S. Corporate Investment Grade Bond Index. Source: FactSet. Past performance is not a guarantee of future
results. Investors cannot invest directly in an index, and unmanaged index returns do not reflect any fees, expenses or sales charges. 42Market Leadership
43Fundamentals Favor Value
Russell 1000 Growth P/E Minus Russell 1000 Growth vs. Value
Russell 1000 Value P/E
85%
45
73.6%
75%
30 65%
Current:
Relative P/E
18.4 55%
48.0%
15
Average: 9.1 45%
35%
0
25%
-15 15%
1995 2000 2005 2010 2015 2020 2020-2022 Consensus EPS Growth
Average Russell 1000 Growth Relative to Russell 1000 Value Growth Value
Source: FactSet. Source: FactSet, Russell.
On a 2-year stack, EPS growth favors Value despite an expected cooling in 2022.
Relative P/E and EPS growth still point to greater upside potential for Value stocks.
Each multiple point of relative P/E equates to approximately 4-5% of relative
performance between Growth and Value.
Data as of Dec. 31, 2021. Past performance is not a guarantee of future results. Investors cannot invest directly in an index, and
unmanaged index returns do not reflect any fees, expenses or sales charges. 44Rates Drive Growth/Value Debate
Crashes are longer, more extreme, and more likely to be followed by a recession
45 0.0
40 0.2
NASDAQ Composite Price Relative to R2000
0.4
U.S. Treasury 10-Year Yield (Inverted)
35
0.6
30
0.8
25
1.0
20
1.2
15
1.4
10
1.6
5 1.8
0 2.0
Dec. 2019 Mar. 2020 Jun. 2020 Sep. 2020 Dec. 2020 Mar. 2021 Jun. 2021 Sep. 2021 Dec. 2021
Ratio of NASDAQ to Russell 2000 (LHS) U.S. Treasury 10-Year Yield (RHS)
Since 2020, equity market leadership has moved in tandem with the 10-year Treasury yield.
Economic normalization as the Omicron wave subsides could lift rates and help reignite
cyclical/value leadership.
Data as of Dec. 31, 2021. Source: S&P, Russell, FactSet, and Bloomberg. Past performance is not a guarantee of future results.
Investors cannot invest directly in an index, and unmanaged index returns do not reflect any fees, expenses or sales charges. 45Up, Down, and Around
40%
Growth and Mega Cap
30%
Outperforming
20%
10%
0%
-10%
Value and Small Cap
Outperforming
-20%
-30%
-40% Initial Bounce Reopening + Vaccines Variants
Mar. 23, 2020 - Aug. 31, 2020 Aug. 31, 2020 - Mar. 31, 2021 Mar. 31, 2021 - Dec. 31, 2021
Growth Minus Value Mega Cap Minus Small Cap
Market cap and style leadership has seen three distinct phases since the March 2020 lows.
When the pandemic turns endemic, leadership may more closely resemble the
reopening + vaccines phase.
Growth is represented by the Russell 3000 Growth Index, Mega by the Russell 50 Mega Cap Index, Value by the Russell 3000 Value Index, and
Small Cap by the Russell 2000 Index. Source: FactSet. Data as of Dec. 31, 2021. Past performance is not a guarantee of future results.
Investors cannot invest directly in an index, and unmanaged index returns do not reflect any fees, expenses or sales charges. 46How Narrow is The Market?
% of Total Return from 10 Largest Stocks (S&P 500)
160%
100%
143%
80% 127%
63%
60%
47%
40% 37%
Average: 35%
30% 29%
23% 22%
18% 17% 19%
20% 16% 15%
13% 13%
11%
0%
-6%
-20%
2004 2005 2006 2007 2008 2009 2010 2011 2012 2013 2014 2015 2016 2017 2018 2019 2020 2021
The top 10 names represent an outsized share of the benchmark relative to history,
a commonly held concern.
However, the share of benchmark returns coming from these names is only modestly
above the historical average and has decreased from 2020 levels.
Data as of Dec. 31, 2021. Source: FactSet. Past performance is not a guarantee of future results. Investors cannot invest directly
in an index, and unmanaged index returns do not reflect any fees, expenses or sales charges. 47TINA: There Is No Alternative
9%
Shareholder
8% Yield Higher
Than Bond
Yields
7%
6%
5%
4%
3.4%
3%
2.1%
2%
1.5%
1%
0%
1998 2000 2002 2004 2006 2008 2010 2012 2014 2016 2018 2020
10 Year U.S. Treasury Yield Buybacks + Dividend Yield Investment Grade Corporate Yield
Total shareholder yield (Buyback Yield + Dividend Yield) remains well above the yield on
offer from both government and corporate bonds.
Should this dynamic remain in place, it will continue to support higher equity valuations
relative to history.
Source: S&P, Dow Jones, Bloomberg. Data as of Sept. 30, 2021. Past performance is not a guarantee of future results. Investors
cannot invest directly in an index, and unmanaged index returns do not reflect any fees, expenses or sales charges. 48Typical Market Leadership in a Downturn
Less Defensive Most
Defensive
Large Cap Value Large Cap Large Cap Growth
Large
-13.0% 41% -12.3% 76% -11.7% 69%
Avg. Perf. Hit Rate Avg. Perf. Hit Rate Avg. Perf. Hit Rate
Market Cap
Mid Cap Value Mid Cap Mid Cap Growth
Mid
-14.2% 24% -13.7% 31% -13.2% 35%
Avg. Perf. Hit Rate Avg. Perf. Hit Rate Avg. Perf. Hit Rate
Less Defensive
Small Cap Value Small Cap Small Cap Growth
Small
-14.8% 21% -14.2% 24% -13.7% 41%
Avg. Perf. Hit Rate Avg. Perf. Hit Rate Avg. Perf. Hit Rate
Least Value Blend Growth
Defensive
Investment Style
Note: Average performance: average performance during selloffs of 5% or more, Hit Rate: Hit rate of outperformance during 5%+ selloffs, 2005 – present.
Benchmarks used: Large Value: S&P 500 Value, Large Blend: S&P 500, Large Growth: S&P 500 Growth; Mid Value: S&P 400 Value, Mid Blend: S&P 400,
Mid Growth: S&P 400 Growth; Small Value: S&P 600 Value, Small Blend: S&P 600, Small Growth: S&P 600 Growth. Outperformance frequency calculated
relative to S&P 1500 index. Data as of Sept. 30, 2021. Source: S&P, Bloomberg. Past performance is not a guarantee of future results. Investors cannot
invest directly in an index, and unmanaged index returns do not reflect any fees, expenses or sales charges. 49Small Caps Unfazed by Inflation
Small Cap Stocks vs. CPI Inflation Rate
30% CAGR: 1930 - 2019
Small Caps: 14.0%
25.4% Inflation: 3.1%
25%
Compound Annual Rates of Return (By Decade)
20.7%
20%
17.5% 17.5%
15% 13.7%
12.8%
9.3% 9.6%
10%
7.1%
5.6% 5.6%
5%
3.0% 2.6%
2.1% 2.4%
1.4% 1.8%
0%
-1.9%
-5%
1930s 1940s 1950s 1960s 1970s 1980s 1990s 2000s 2010s
Small Cap Stocks CPI Inflation Rate
Since the 1930s, small cap stocks are the only major asset class to outperform
inflation in each decade.
Source: Ibbotson Small Cap Index-Morningstar, Bureau Labor Statistics. Past performance is not a guarantee of future results.
Investors cannot invest directly in an index, and unmanaged index returns do not reflect any fees, expenses or sales charges. 50Valuations Support Small & Mid Cap Stocks
Crashes are longer, more extreme, and more likely to be followed by a recession
25
SMID
20 Cap
Cheap
Relative
Forward P/E Ratio
to
Large
15
10
5
2004 2005 2006 2007 2008 2009 2010 2011 2012 2013 2014 2015 2016 2017 2018 2019 2020 2021
Large Cap (S&P 500) Small & Mid Cap (S&P 1000)
Small & mid cap stocks have historically traded at a premium to Large. This is not currently the
case.
Data as of Dec. 31, 2021. Source: FactSet, S&P. Past performance is not a guarantee of future results. Investors cannot invest directly in an index, and
unmanaged index returns do not reflect any fees, expenses or sales charges. 51Small & Mid Cap Leadership Typically Lasts Longer
Small vs. Large Cap Mid vs. Large Cap
First Second Next First Second Next
Recession End Recession End
12 Months 12 Months 12 Months 12 Months 12 Months 12 Months
Nov. 1982 10.4% -9.3% 0.1% Nov. 1982 3.4% -3.7% 1.8%
March 1991 9.7% 0.4% 10.6% March 1991 6.7% 5.2% 4.0%
Nov. 2001 5.6% 19.7% 5.2% Nov. 2001 6.8% 13.8% 6.2%
June 2009 6.9% 6.3% -5.7% June 2009 10.1% 6.9% -5.5%
April 2020 25.8% -13.2%* ? April 2020 10.1% -5.4%* ?
Average Average
(Prior 4 8.2% 4.3% 2.6% (Prior 4 6.8% 5.6% 1.6%
Recessions) Recessions)
*Second 12 Months since Apr. 2020 reflects stub performance through Dec. 31, 2021 *Second 12 Months since Apr. 2020 reflects stub performance through Dec. 31, 2021
Following a recession, small and mid cap stocks have typically outpaced their large cap
brethren over the next three years.
Given weakness in year two so far, an opportunity could exist if the historical trend holds.
Small Cap = Russell 2000 Index, Mid Cap = Russell Mid Cap Index, and Large Cap = Russell 1000 Index. Source: FactSet. Past performance is not a
guarantee of future results. Investors cannot invest directly in an index, and unmanaged index returns do not reflect any fees, expenses or sales charges.
Not a recommendation to buy or sell any security. 52Could Spreads Go Even Lower?
25 9%
8%
Average Spread (Basis Points) (Hundreds)
20
7%
6%
Average Default Rate
15
5%
Average Default Rate (1987-2003)
4%
10
3%
2%
5
1%
Average Default Rate (2004-Present)
0 0%
1987 1989 1991 1993 1995 1997 1999 2001 2003 2005 2007 2009 2011 2013 2015 2017 2019 2021
High Yield Spread (LHS)
While credit spreads are near the low end of their historical range, default rates have
been substantially lower since 2004.
Lower default rates mean investors may demand less compensation in order to take
credit risk.
Data as of Dec. 31, 2021. Source: Federal Reserve Bank of St. Louis, FactSet. Past performance is not a guarantee of future results.
Investors cannot invest directly in an index, and unmanaged index returns do not reflect any fees, expenses or sales charges. 53Glossary of Terms
BEA: Bureau of Economic Analysis
Bloomberg Barclays US Corporate Investment Grade Bond Index: an unmanaged index of U.S. investment-grade corporate bond securities
Capex (Capital expenditures): corporate spending on productive assets (such as buildings, machinery and equipment, vehicles) intended to increase capacity
or efficiency for more than one accounting period.
EPS (Earnings per Share): the portion of a company's profit allocated to each outstanding share of common stock.
GDP: Gross Domestic Product
GFC (Great Financial Crisis): the severe economic and market downturn experienced in 2007-2008.
LEI Index: Conference Board Leading Economic Indicators index.
MSCI All Country World Index: unmanaged index of large- and mid-cap stocks in developed and emerging markets.
MSCI EM Index: unmanaged index of large- and mid-cap stocks in 27 emerging market countries.
MSCI EAFE Index: unmanaged index of equity securities from developed countries in Western Europe, the Far East, and Australasia.
MSCI USA Index: unmanaged index of US large- and mid-cap equity securities.
NFIB (National Federation of Independent Business): a U.S. small business advocacy association, representing over 350,000 small and independent business
owners.
NFIB Small Business Optimism Index: measure of small business sentiment produced by the National Federation of Independent Business based on its
monthly survey of small business owners.
P/E Ratio: Price/Earnings ratio
PMI: Purchasing Manager’s Index
Quantitative easing (QE): Monetary policy implemented by a central bank in which it increases the excess reserves of the banking system through the direct
purchase of debt securities.
Russell 2000 Index: unmanaged index of small-cap stocks.
Shibor: Shanghai Interbank Offered Rate
S&P 500 Index: Unmanaged index of 500 stocks that is generally representative of the performance of larger companies in the U.S.
VIX: VIX is the ticker symbol and the popular name for the Chicago Board Options Exchange's CBOE Volatility Index, a popular measure of the stock market's
expectation of volatility based on S&P 500 index options.
Yield Curve: Comparison of interest rates at a point in time of bonds with equal credit quality but different maturity dates.
YoY: Year Over Year
U.S. Treasurys: Direct debt obligations issued and backed by the "full faith and credit" of the U.S. government. The U.S. government guarantees the principal
and interest payments on U.S. Treasuries when the securities are held to maturity. Unlike U.S. Treasury securities, debt securities issued by the federal agencies
and instrumentalities and related investments may or may not be backed by the full faith and credit of the U.S. government. Even when the U.S. government
guarantees principal and interest payments on securities, this guarantee does not apply to losses resulting from declines inthe market value of these securities.
54Additional Important Information
“Anatomy of a Recession” is a trademark of ClearBridge Investments, LLC. ClearBridge Investments, LLC is United Arab Emirates: Issued by Franklin Templeton Investments (ME) Limited, authorized and regulated
a subsidiary of Franklin Resources, Inc. by the Dubai Financial Services Authority. Dubai office: Franklin Templeton, The Gate, East Wing, Level 2,
Dubai International Financial Centre, P.O. Box 506613, Dubai, U.A.E., Tel.: +9714-4284100 Fax:+9714-
This material is intended to be of general interest only and should not be construed as individual 4284140.
investment advice or a recommendation or solicitation to buy, sell or hold any security or to adopt any
investment strategy. It does not constitute legal or tax advice. This material may not be reproduced, France: Issued by Franklin Templeton International Services S.à r.l., French branch, 55 avenue Hoche,
distributed or published without prior written permission from Franklin Templeton. 75008 Paris France. Hong Kong: Issued by Franklin Templeton Investments (Asia) Limited, 17/F, Chater
House, 8 Connaught Road Central, Hong Kong. Italy: Issued by Franklin Templeton International Services
The views expressed are those of the investment manager and the comments, opinions and analyses are S.à.r.l. – Italian Branch, Corso Italia, 1 – Milan, 20122, Italy. Japan: Issued by Franklin Templeton
rendered as at publication date and may change without notice. The underlying assumptions and these Investments Japan Limited. Korea: Issued by Franklin Templeton Investment Trust Management Co., Ltd.,
views are subject to change based on market and other conditions and may differ from other portfolio 3rd fl., CCMM Building, 12 Youido-Dong, Youngdungpo-Gu, Seoul, Korea 150-968. Luxembourg/Benelux:
managers or of the firm as a whole. The information provided in this material is not intended as a Issued by Franklin Templeton International Services S.à r.l. – Supervised by the Commission de
complete analysis of every material fact regarding any country, region or market. There is no assurance Surveillance du Secteur Financier - 8A, rue Albert Borschette, L-1246 Luxembourg - Tel:+352-46 66 67-1 -
that any prediction, projection or forecast on the economy, stock market, bond market or the economic Fax:+352-46 66 76. Malaysia: Issued by Franklin Templeton Asset Management (Malaysia) Sdn. Bhd. &
trends of the markets will be realized. The value of investments and the income from them can go down Franklin Templeton GSC Asset Management Sdn. Bhd. This document has not been reviewed by Securities
as well as up and you may not get back the full amount that you invested. Past performance is not Commission Malaysia. Poland: Issued by Templeton Asset Management (Poland) TFI S.A.; Rondo ONZ 1;
necessarily indicative nor a guarantee of future performance. All investments involve risks, including 00-124 Warsaw Romania: Franklin Templeton International Services S.À R.L. Luxembourg, Bucharest
possible loss of principal. Branch, at 78-80 Buzesti Str, Premium Point, 8th Floor, Bucharest 1, 011017, Romania. Registered with
Any research and analysis contained in this presentation has been procured by Franklin Templeton for its Romania Financial
own purposes and may be acted upon in that connection and, as such, is provided to you incidentally. Supervisory Authority under no. PJM07.1AFIASMDLUX0037/10 March 2016 and authorized and regulated
Data from third party sources may have been used in the preparation of this material and Franklin in Luxembourg by Commission de Surveillance du Secture Financiere. Telephone: + 40 21 200 9600
Templeton ("FT") has not independently verified, validated or audited such data. Although information Singapore: Issued by Templeton Asset Management Ltd. Registration No. (UEN) 199205211E and Legg
has been obtained from sources that Franklin Templeton believes to be reliable, no guarantee can be Mason Asset Management Singapore Pte. Limited, Registration Number (UEN) 200007942R. Legg Mason
given as to its accuracy and such information may be incomplete or condensed and may be subject to Asset Management Singapore Pte. Limited is an indirect wholly owned subsidiary of Franklin Resources,
change at any time without notice. The mention of any individual securities should neither constitute nor Inc. 7 Temasek Boulevard, #38-03 Suntec Tower One, 038987, Singapore. Spain: Issued by Franklin
be construed as a recommendation to purchase, hold or sell any securities, and the information provided Templeton International Services S.à r.l. – Spanish Branch , Professional of the Financial Sector under the
regarding such individual securities (if any) is not a sufficient basis upon which to make an investment Supervision of CNMV, José Ortega y Gasset 29, Madrid, Spain. Tel +34 91 426 3600, Fax +34 91 577 1857.
decision. FT accepts no liability whatsoever for any loss arising from use of this information and reliance South Africa: Issued by Franklin Templeton Investments SA (PTY) Ltd which is an authorised Financial
upon the comments, opinions and analyses in the material is at the sole discretion of the user. Services Provider. Tel:+27 (21) 831 7400 ,Fax:+27 (21) 831 7422. Switzerland: Issued by Franklin Templeton
Products, services and information may not be available in all jurisdictions and are offered outside the Switzerland Ltd, Stockerstrasse 38, CH-8002 Zurich. UK: Issued by Franklin Templeton Investment
U.S. by other FT affiliates and/or their distributors as local laws and regulation permits. Please consult Management Limited (FTIML), registered office: Cannon Place, 78 Cannon Street, London EC4N 6HLTel
your own financial professional or Franklin Templeton institutional contact for further information on +44 (0)20 7073 8500. Authorized and regulated in the United Kingdom by the Financial Conduct
availability of products and services in your jurisdiction. Authority. Nordic regions: Issued by Franklin Templeton International Services S.à r.l. , Contact details:
Franklin Templeton International Services S.à r.l., Swedish Branch, filial, Nybrokajen 5, SE-111 48,
Issued in the U.S. by Franklin Distributors, LLC, One Franklin Parkway, San Mateo, California 94403 -1906, Stockholm, Sweden. Tel +46 (0)8 545 012 30, nordicinfo@franklintemplet on. com, authorised in the
(800) DIAL BEN/342-5236, franklintempleton.com - Franklin Distributors, LLC, member FINRA/SIPC, is the Luxembourg by the Commission de Surveillance du Secteur Financier to conduct certain financial
principal distributor of Franklin Templeton U.S. registered products, which are not FDIC insured; may lose activities in Denmark, in Sweden, in Norway, in Iceland and in Finland. Franklin Templeton International
value; and are not bank guaranteed and are available only in jurisdictions where an offer or solicitation of Services S.à r.l., Swedish Branch, filial conducts activities under supervision of Finansinspektionen in
such products is permitted under applicable laws and regulation. Sweden.
Australia: Issued by Franklin Templeton Investments Australia Limited (ABN 87 006 972 247) (Australian Offshore Americas: In the U.S., this publication is made available only to financial intermediaries by
Financial Services License Holder No. 225328), Level 19, 101 Collins Street, Melbourne, Victoria, 3000. Franklin Distributors, LLC, member FINRA/SIPC, 100 Fountain Parkway, St. Petersburg, Florida 33716.
Austria/Germany: Issued by Franklin Templeton International Services S.à r.l.,Niederlassung Deutschland , Tel:(800) 239-3894 (USA Toll-Free),(877) 389-0076 (Canada Toll-Free), and Fax: (727) 299-8736.
Frankfurt, Mainzer Landstr. 16, 60325 Frankfurt/Main, Tel. 08 00/0 73 80 01 (Germany), 08 00/29 59 11 Investments are not FDIC insured; may lose value; and are not bank guaranteed. Distribution outside the
(Austria), Fax: +49(0)69/2 72 23-120, info@franklintempleton.de, info@franklintempleton.at Canada: U.S. may be made by Franklin Templeton International Services, S.a.R.L. (FTIS) or other sub-distributors,
Issued by Franklin Templeton Investments Corp., 200 King Street West, Suite 1500 Toronto, ON, M5H3T4, intermediaries, dealers or professional investors that have been engaged by FTIS to distribute shares of
Fax:(416) 364-1163, (800) 387-0830, www.franklintempleton.ca. Franklin Templeton funds in certain jurisdictions. This is not an offer to sell or a solicitation of an offer to
purchase securities in any jurisdiction where it would be illegal to do so. Please visit
Netherlands: Franklin Templeton International Services S.à r.l., Dutch Branch , World Trade Center www.franklinresources.com to be directed to your local Franklin Templeton website.
Amsterdam, H-Toren, 5e verdieping, Zuidplein 36, 1077 XV Amsterdam, Netherlands. Tel +31 (0) 20 575
2890. Copyright © 2022 ClearBridge Investments, LLC. All rights reserved.
CBAX481307 AOR GLPB 12/21
55You can also read