Diagnosis of tuberculosis in groups of badgers: an exploration of the impact of trapping efficiency, infection prevalence and the use of multiple ...
←
→
Page content transcription
If your browser does not render page correctly, please read the page content below
Epidemiol. Infect. (2016), 144, 1717–1727. © Crown Copyright. Published by Cambridge University Press 2016
             doi:10.1017/S0950268815003210

             Diagnosis of tuberculosis in groups of badgers: an exploration of
             the impact of trapping efficiency, infection prevalence and the
             use of multiple tests

             S. N. BUZDUGAN 1 , M. A. CHAMBERS 2 , 3 , R. J. DELAHAY 4                                                    AND     J. A. DREWE 1 *
             1
               Veterinary Epidemiology, Economics and Public Health Group, Royal Veterinary College, London, UK
             2
               Animal and Plant Health Agency, Weybridge, UK
             3
               School of Veterinary Medicine, University of Surrey, Guildford, UK
             4
               National Wildlife Management Centre, Animal and Plant Health Agency, Woodchester Park, Gloucestershire,
             UK

             Received 25 September 2015; Final revision 28 October 2015; Accepted 30 November 2015;
             first published online 6 January 2016

             SUMMARY
             Accurate detection of infection with Mycobacterium bovis in live badgers would enable targeted
             tuberculosis control. Practical challenges in sampling wild badger populations mean that diagnosis
             of infection at the group (rather than the individual) level is attractive. We modelled data spanning
             7 years containing over 2000 sampling events from a population of wild badgers in southwest
             England to quantify the ability to correctly identify the infection status of badgers at the group level.
             We explored the effects of variations in: (1) trapping efficiency; (2) prevalence of M. bovis; (3) using
             three diagnostic tests singly and in combination with one another; and (4) the number of badgers
             required to test positive in order to classify groups as infected. No single test was able to reliably
             identify infected badger groups if 80%
             sensitive, at least 94% specific, and able to be performed rapidly in the field.

             Key words: Diagnosis, disease control, epidemiology, tuberculosis (TB), wildlife.

             I N T RO D U C T I O N                                                               present a risk to human health. In England and
             Bovine tuberculosis (TB: infection with Mycobacter-                                  Wales, despite a variety of control measures (princi-
                                                                                                  pally based on the test and slaughter of reactor cattle),
             ium bovis) is a zoonotic disease with a worldwide
             distribution. It has a serious impact on livestock                                   eradication has not been achieved [1]. One impedi-
             profitability, cattle health and welfare, and may                                     ment to this is the presence of infection in wildlife,
                                                                                                  most notably the European badger (Meles meles)
                                                                                                  which is the principal wild maintenance host of bovine
             * Author for correspondence: Dr J. A. Drewe, Veterinary                              TB in the UK.
             Epidemiology, Economics and Public Health Group, Royal                                 Badgers are social mammals that live in stable
             Veterinary College, Hawkshead Lane, North Mymms, Hertfordshire
             AL9 7TA, UK.
                                                                                                  groups of 2–23 adults, but usually around six [2]. A
             (Email: jdrewe@rvc.ac.uk)                                                            social group will defend a territory which may contain

Downloaded from https://www.cambridge.org/core. IP address: 46.4.80.155, on 02 Feb 2022 at 08:45:02, subject to the Cambridge Core terms of use, available at https://www.cambridge.org/core/terms.
https://doi.org/10.1017/S0950268815003210
1718         S. N. Buzdugan and others

                      several setts (burrows), one of which is used as the main                           ability to correctly detect infection in live badgers liv-
                      sett. Badgers mark the boundaries of territories with                               ing in groups where not all individuals could be
                      their distinctive latrines, collections of shallow pits in                          sampled, and where the prevalence of infection may
                      which they leave their faeces. Land can be surveyed for                             vary. Analysis was conducted in two complementary
                      setts and latrines indicating the presence of badgers [3]                           parts; first, by examining the performance of tests at
                      and hence it is theoretically possible to target particular                         the individual level and then by examining test charac-
                      badger groups for disease investigation and control.                                teristics when interpreted at the group level.
                         Accurate recognition of the infection status of a
                      host is likely to significantly improve the effectiveness
                      of disease control interventions. In the case of M. bovis                           M AT E R I A L S A N D ME T H O D S
                      infection in live badgers, no gold standard diagnostic                              Study site and sample collection
                      test is available. However, it is possible to combine
                      available data on several existing but imperfect diag-                              Samples and data were collected from July 2006 to
                      nostic tests and thereby increase diagnostic certainty                              October 2013 from a population of wild badgers living
                      [4]. If this approach were applied at the badger                                    in Woodchester Park, an area of southwest England
                      group level, then targeted group-based interventions                                which is the focus of a long-term study into badger
                      may become realistic options for M. bovis control.                                  ecology and TB epidemiology (see [8, 9]). Badgers
                         Disease control measures in wildlife populations are                             were trapped using steel mesh box traps deployed at
                      challenging to apply owing to ecological complexities                               active setts, baited with peanuts and set after 4–8
                      and practical difficulties, including for example, the                               days of pre-baiting. Traps were located on or near
                      absence of effective diagnostic tools for wild hosts.                               to badger ‘runs’ at active setts. Trapped badgers
                      Additionally, wild animals tend to be difficult to                                   were anaesthetized with a mixture of ketamine hydro-
                      catch and sample, meaning only a (probably biased)                                  chloride, medetomidine hydrochloride and butorpha-
                      portion of the population (whose total size may be un-                              nol tartrate [10] and on first capture each was given
                      known) is available to contribute data. For example,                                a unique identifying tattoo which allowed individuals
                      trapping efficiencies have been estimated to range                                   to be identified thereafter [11]. The location, sex, body
                      from about 35% in low-density badger populations                                    weight and condition, reproductive status and age
                      [5] up to about 70% in higher density areas [6], mean-                              group of each animal was recorded.
                      ing that up to about two-thirds of badgers may be                                      Samples of faeces, urine, tracheal aspirate, oesopha-
                      missed. It is possible that polymerase chain reaction-                              geal aspirate and swabs from bite wounds (where pre-
                      based tests for M. bovis in badger faeces collected                                 sent) were collected for mycobacterial culture and up
                      from latrines may prove useful in the future [7], but                               to 12 ml jugular blood was taken for serological and
                      this approach – if sufficiently accurate, practical and                              gamma interferon (IFN-γ) testing (see below). After re-
                      cost-effective – would not necessarily result in a more                             covery from anaesthesia, badgers were released at the site
                      complete or representative sampling of the population.                              where they had been caught. Each social group was
                      Hence, decisions on population management, includ-                                  trapped four times per year. Trapping was suspended be-
                      ing how best to manage an endemic disease, are often                                tween 1 February and 30 April inclusive when most cubs
                      based on incomplete information. Consequently, it                                   are very young, confined to the sett, and/or totally de-
                      would be useful to quantify the impact of variations                                pendent on their mother (see [12]). During January
                      in trapping efficiency on the ability to correctly diag-                             (and, weather dependent, during December and May),
                      nose the infection status of badger groups.                                         when some females may be lactating, traps were checked
                         The aim of the present study was to explore and                                  during the night, and females deemed to be lactating or
                      quantify the potential benefits of using three existing                              pregnant on the basis of cursory examination, were
                      diagnostic tests, in isolation and in combination with                              released immediately without sampling.
                      one another, for the diagnosis of M. bovis infection
                      in live badgers at the individual and group levels.
                      This is a critical question for determining the potential                           Ethical standards
                      value of existing tests (or those that may be developed                             The authors assert that all procedures contributing to
                      in the future) to identify infected badger groups as                                this work comply with the ethical standards of the
                      part of any targeted disease control intervention.                                  relevant national and institutional guides on the care
                      The emphasis of our study was on determining the                                    and use of wild animals in research.

Downloaded from https://www.cambridge.org/core. IP address: 46.4.80.155, on 02 Feb 2022 at 08:45:02, subject to the Cambridge Core terms of use, available at https://www.cambridge.org/core/terms.
https://doi.org/10.1017/S0950268815003210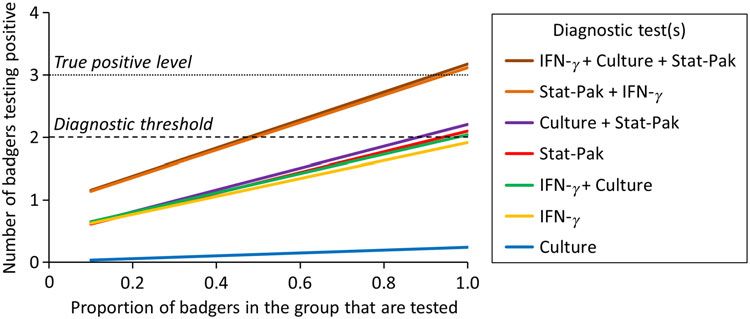
Diagnosis of TB in groups of badgers                          1719

             Diagnostic tests                                                                     test result influenced the diagnosis of infection in
             Three diagnostic approaches for use in live badgers                                  groups of live badgers. This allowed us to estimate
             were considered: Stat-Pak (Chembio Diagnostic                                        the usefulness of each test in contributing to detection
             Systems, USA); IFN-γ test; and culture of clinical                                   of infection at the sett or social group level. Where
             samples (see [4] for details). Briefly, Stat-Pak identified                            more than one diagnostic test was used at the same
             antibodies produced in response to antigens associated                               time on the same animal, two methods of interpreting
                                                                                                  test results were trialled: parallel interpretation, where-
             with M. bovis [13], giving a binary (positive or nega-
             tive) test result. The IFN-γ test measured the secretion                             by results from all tests were considered together and
             of the cytokine IFN-γ by T cells following stimulation                               an animal was categorized as infected if one or more
                                                                                                  of the tests yielded a positive result; and series inter-
             with purified protein derivatives of bovine (PPD-B)
             and avian (PPD-A) tuberculin [14]. Results from the                                  pretation, where all test results from the same animal
             IFN-γ test were available on a continuous scale as op-                               at any given capture event needed to be positive in
                                                                                                  order for the animal to be considered infected.
             tical density (OD) readings of IFN-γ production. For
             each badger, an IFN-γ OD value was calculated as the                                    A sample size of 15 animals per group was chosen
             amount IFN-γ response produced following stimula-                                    as the unit for analysis in order to allow the effect of
             tion with PPD-B minus the IFN-γ response produced                                    wide variations in the proportion of the group that
             by stimulation with PPD-A. Binary values for the                                     was sampled to be explored. In reality, this number
             IFN-γ test were produced by using an OD cut-off                                      is more likely to represent the total social group size
             value of 0·044, as reported previously [14]. The third                               (at the higher end of the expected range in high-
                                                                                                  density populations) rather than the number of occu-
             test was the mycobacterial culture of clinical samples
             [15] with a positive result recorded for any sample                                  pants of a single sett. The average number of badgers
             from which M. bovis was isolated.                                                    per social group in Woodchester Park has been esti-
                                                                                                  mated at 9·4 (range 4·9–12·4) [9] and so in reality
                                                                                                  two main setts in close proximity may be considered
             Test characteristics                                                                 together as the unit for this analysis. Results of tests
             The sensitivity and specificity of each diagnostic test                               were interpreted at an aggregated rather than an indi-
             was estimated in the absence of knowledge of true in-                                vidual animal level, meaning that two or more bad-
             fection status using Bayesian methods [16]. These test                               gers in a sett (or cluster of setts) would need to test
             characteristics were estimated for each of the three                                 positive in order for this ‘group’ to be considered
             tests when used in isolation and in combination with                                 infected. This threshold was chosen due to the imper-
             one another. Data were analysed using WinBUGS                                        fect specificity of some of the tests, and hence it
             freeware [17] to run a Markov chain Monte Carlo                                      reduced the chances of incorrectly identifying a sett
             (MCMC) model containing five overdispersed chains.                                    as positive when, in fact, there were no truly infected
             Priors for the sensitivity and specificity estimations of                             animals present (see also [19]).
             the three diagnostic tests were obtained from previ-                                    The performance of combinations of diagnostic
             ously elicited expert opinion [4]. Prevalence was                                    tests was examined across a range of values for TB
             expected to vary over the study period and so was esti-                              prevalence from 10% to 50%. Thus the ‘true’ number
             mated on an annual basis using uniform (0, 1) priors.                                of infected individuals used for comparison in each
             Estimates of sensitivity, specificity and prevalence                                  case was calculated by multiplying each prevalence
             were generated from 50 000 posterior samples collected                               level, at intervals of 10%, by the number of badgers
             after a burn-in of 5000 iterations. Convergence was                                  in the group. This ‘true’ number of infected animals
             assessed by visual checking of trace plots of all chains                             represents the situation that would be seen if the diag-
             for each parameter. We assumed independence be-                                      nostic tests were perfectly accurate (i.e. 100% sensitive
             tween the three diagnostic tests which was considered                                and 100% specific).
             appropriate because each test detects a different biologic-                             The influence of the proportion of badgers trapped
             al marker (i.e. antibody, cytokine, or bacteria [18]).                               on diagnostic accuracy was another important consid-
                                                                                                  eration, so we tested the effects of a range of trapping
                                                                                                  efficiency values (from 10% to 100%). The results
             Data analysis                                                                        from various combinations of tests were assessed by
             We modelled the empirical test result data by simulat-                               comparing the numbers of infected animals identified
             ing a range of approaches to examine how much each                                   by each combination of tests to the ‘true’ number of

Downloaded from https://www.cambridge.org/core. IP address: 46.4.80.155, on 02 Feb 2022 at 08:45:02, subject to the Cambridge Core terms of use, available at https://www.cambridge.org/core/terms.
https://doi.org/10.1017/S0950268815003210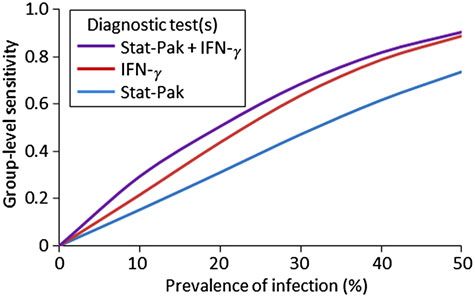
1720         S. N. Buzdugan and others

                      infected animals in the group (estimated at varying                                 the chosen threshold number of animals required to
                      prevalence intervals, and each time assuming 15 ani-                                test positive in order for a group to be considered
                      mals per group as the unit of study).                                               infected. Values of HSp provide information on how
                         Finally, we used an alternative complementary ap-                                often a typical group of badgers will incorrectly be
                      proach to examine the accuracy of the testing regimen                               declared infected when in fact it is disease-free, using
                      at the group level, by calculating the herd sensitivity                             diagnostic test(s) with a given HSe. HSp was calculated
                      and herd specificity. These are epidemiological terms                                using the same scenarios as for HSe, but this time as-
                      which refer to the ability of test(s) to correctly identify                         suming that infection was absent.
                      infected groups as positive and uninfected groups as                                   Three parameters were modelled at the herd
                      negative [20]. In this instance ‘herd’ is taken to mean                             (group) level to determine their impact on the diagno-
                      badger group, ‘herd sensitivity’ refers to the ability                              sis of infection. The first parameter was the apparent
                      of diagnostic test(s) to correctly identify badger                                  prevalence of infection, which ranged from 11% to
                      groups infected with M. bovis, and ‘herd specificity’                                52%. These figures equate to a true prevalence range
                      refers to their ability to correctly identify uninfected                            of 10–50%, based on the MCMC estimates of test sen-
                      badger groups. Herd-level sensitivity was calculated                                sitivity and specificity. Second, we considered trapping
                      when individual animal test results were interpreted                                efficiency (the proportion of badgers that are caught
                      at an aggregated (group) level. A certain (stated) num-                             and are therefore available to be sampled), expressed
                      ber of animals was required to test positive in order                               as the integer number of animals sampled per group,
                      for the herd to be considered positive. Herd-level sen-                             and ranging from 2 to 15. Group size was set at 15
                      sitivities and specificities were calculated as follows                              badgers (as before). The third parameter was the
                      (from [20]):                                                                        threshold (trigger) number of animals needing to test
                                                                                                        positive in order to classify a group as infected, and
                      AP = P ∗ Se + (1 − P) 1 − Sp ,                          (1)
                                                                                                          values ranged from 1 to 3 in the model. The upper
                                         k−1                                                             bound was constrained by diagnostic sensitivity (if
                      HSe = 1 −            0
                                                 ∗ Ck−1
                                                    n
                                                        ∗ APk−1 ∗ (1 − AP)n−(k−1) ,
                                                                                                          the threshold was set too high then infection would
                                                                                                (2)       rarely be detected) and to accommodate the possibility
                      H Sp = Spn , when k = 1,                                                  (3)       of very low levels of trapping efficiency. In order
                                                                                                          for three badgers from a group of 15 to test positive,
                                k−1                n−(k−1)        (k−1)
                      HSp =          0
                                           ∗ Ck−1
                                              n
                                                  ∗ Sp       ∗ 1 − Sp        ,                            at least 20% would need to be sampled. In reality, a
                                                                                                          better trapping efficiency than this can be expected
                               when k . 1.                                                      (4)
                                                                                                          [5, 6].
                      where AP = apparent prevalence (refers to the propor-
                      tion of animals testing positive which is usually not the
                                                                                                          R E S ULTS
                      same as the proportion of animals actually infected,
                      due to false-negative and false-positive results); P =                              A total of 2022 capture (sampling) events involving
                      true prevalence; Se = sensitivity of a diagnostic test                              541 individual badgers were recorded and analysed
                      (or combination of tests); Sp = specificity of a diagnos-                            in the study. Each sampling event generated results
                      tic test (or combination of tests); HSe = herd-level sen-                           on all three diagnostic tests for one badger.
                      sitivity (ability to detect infected groups); k =
                      threshold number of animals required to test positive
                                                                                                          Test characteristics
                      in order to consider the badger group to be infected;
                      n = number of animals tested; Ckn = number of combi-                                The sensitivity and specificity of each test for diagnos-
                      nations of k positives when n animals are tested; and                               ing M. bovis infection in live badgers, estimated using
                      HSp = herd-level specificity (ability to correctly iden-                             Bayesian methods in the absence of knowledge of any
                      tify uninfected groups). HSp is calculated assuming in-                             individual’s true infection status, are presented in
                      fection is absent [equations (3) and (4)].                                          Table 1. Sensitivity values ranged widely, from barely
                         As can be seen from these formulae, the value of                                 above zero (when all three tests were interpreted in
                      HSe is directly dependent on both the apparent preva-                               series) up to about 0·80 (when two or three tests
                      lence and the number of animals tested. Conversely,                                 were interpreted in parallel). Specificity values
                      HSp does not depend on infection prevalence, but is                                 remained high (>0·93) regardless of the method of
                      sensitive only to the number of animals tested and                                  interpretation.

Downloaded from https://www.cambridge.org/core. IP address: 46.4.80.155, on 02 Feb 2022 at 08:45:02, subject to the Cambridge Core terms of use, available at https://www.cambridge.org/core/terms.
https://doi.org/10.1017/S0950268815003210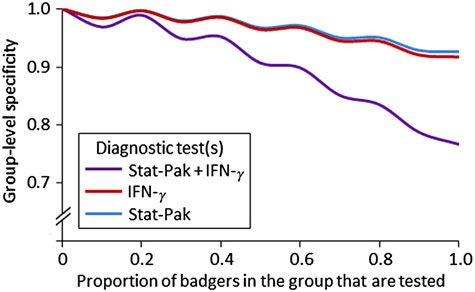
Diagnosis of TB in groups of badgers                          1721

             Table 1. Estimated values for the sensitivity (Se) and specificity (Sp) of three diagnostic tests for the detection of
             M. bovis infection in individual live badgers, when the tests were used in isolation and in combination. Values
             estimated using Bayesian modelling of empirical diagnostic test results from 2022 sampling events involving 541
             individual badgers trapped at Woodchester Park from July 2006 to October 2013

                                                                           Test or combination of                         Sensitivity                      Specificity
             Diagnostic approach                                           tests                                          (95% CI)                         (95% CI)

             (a) Use of each test on its own                               Stat-Pak                                       0·58 (0·53–0·63)                 0·97 (0·93–0·99)
                                                                           IFN-γ                                          0·52 (0·46–0·63)                 0·97 (0·94–0·99)
                                                                           Culture                                        0·08 (0·06–0·11)                 1·00 (0·99–1·00)
             (b) Use of two or three tests together                        IFN-γ + culture                                0·55                             0·97
              (parallel interpretation*)                                   Stat-Pak + culture                             0·61                             0·97
                                                                           Stat-Pak + IFN-γ                               0·79                             0·94
                                                                           Stat-Pak + IFN-γ + culture                     0·81                             0·94
             (c) Use of two or three tests together                        IFN-γ + culture                                0·04                             1·00
              (series interpretation†)                                     Stat-Pak + culture                             0·04                             1·00
                                                                           Stat-Pak + IFN-γ                               0·30                             1·00
                                                                           Stat-Pak + IFN-γ + culture                     0·02                             1·00

             CI, Confidence interval; IFN-γ, gamma interferon.
             * Separallel = 1 – (1 – Se1)*(1 – Se2) for two tests, and 1 – (1 – Se1)*(1 – Se2)*(1 – Se3) for three tests, where the subscript num-
             bers represent the different diagnostic tests; Spparallel = Sp1*Sp2 for two tests, and Sp1*Sp2*Sp3 for three tests.
             † Seseries = Se1*Se2 for two tests, and Se1*Se2*Se3 for three tests; Spseries = 1 – (1 – Sp1)*(1 – Sp2) for two tests, and 1 – (1 – Sp1)*
             (1 – Sp2)*(1 – Sp3) for three tests.

             Fig. 1. The comparative ability of three diagnostic tests, when used singly and in combination (parallel interpretation), to
             detect badger groups infected with Mycobacterium bovis. The scenario illustrated is a simulation using the empirical data
             described in the main text. In this example, there were three truly infected animals in a group of 15 badgers (20%
             prevalence) and a minimum of two animals were required to test positive to classify a group as infected. Under these
             assumptions, none of the tests when used in isolation was able to correctly identify all infected animals in the group. In
             contrast, when Stat-Pak and gamma interferon (IFN-γ) test results were interpreted in parallel at the group level, a group
             could be correctly identified as infected if only 50% of the animals were tested. The addition of culture added very little to
             the diagnostic accuracy.

             Ability of tests to detect infection at the group level                              used singly was able to correctly identify all infected
                                                                                                  animals in the group (Fig. 1). However, in a scenario
             Initially, tests were evaluated using a theoretical TB                               where the minimum threshold for a sett to be categor-
             prevalence of 20% and a group size of 15 animals.                                    ized as infected was for two individuals to test posi-
             Under these assumptions, none of the tests when                                      tive, then Stat-Pak would be able to detect infection

Downloaded from https://www.cambridge.org/core. IP address: 46.4.80.155, on 02 Feb 2022 at 08:45:02, subject to the Cambridge Core terms of use, available at https://www.cambridge.org/core/terms.
https://doi.org/10.1017/S0950268815003210
1722 S. N. Buzdugan and others
at the group level if 90% of badgers were tested, and over using Stat-Pak alone was that a group could be
IFN-γ would be able to detect infection at the group correctly identified as infected at lower (but not very
level if 100% of badgers were tested. Within the para- low) prevalence levels. Hence, whereas Stat-Pak
meters of this analysis, culture was not able to detect alone was unable to correctly identify an infected bad-
any infected animal (Fig. 1). ger group where the background prevalence was
In contrast, when all three diagnostic tests wereDiagnosis of TB in groups of badgers 1723
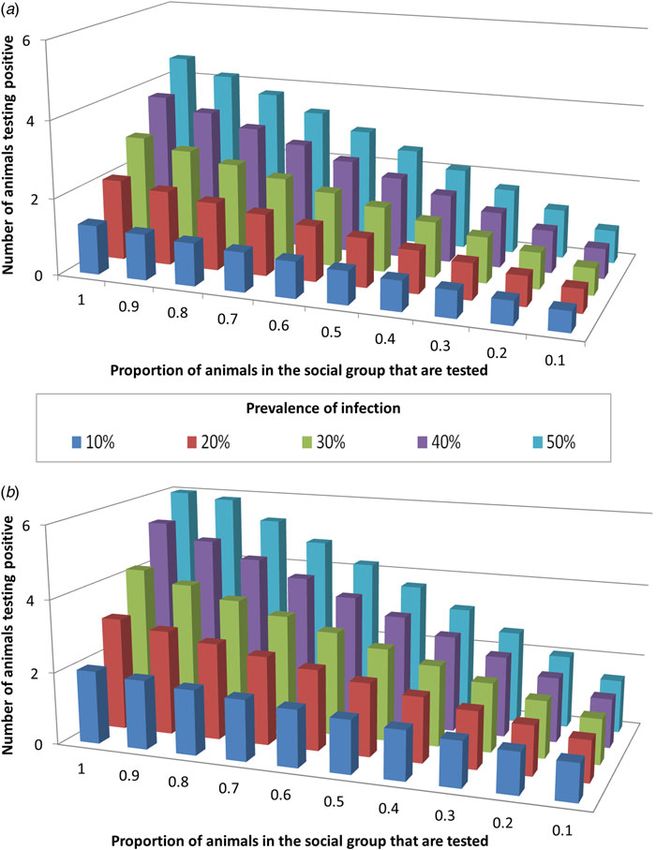
Fig. 2. The influence of Mycobacterium bovis infection prevalence and the proportion of a badger group that is sampled,
on the ability of diagnostic tests to identify infected badger groups. Graphs show the number of badgers identified as
test-positive across different values of background tuberculosis prevalence, using (a) Stat-Pak in isolation, and (b) Stat-Pak
and gamma interferon (IFN-γ) tests in combination (parallel interpretation). In this scenario, which is a simulation using
empirical data, two animals were required to test positive in order to identify infection in a group of 15 animals. The
combination of IFN-γ and Stat-Pak was able to correctly identify group-level infection status at any prevalence level, but
if true prevalence was low (10%) then a high proportion (90%) of the group needed to be tested. In contrast, Stat-Pak
alone was unable to correctly identify an infected group when true prevalence was1724 S. N. Buzdugan and others
Fig. 4. Variation in group-level sensitivity across a range
of infection prevalence values for three different ap-
proaches to diagnosing Mycobacterium bovis in badger
groups. The scenario shown is based on 50% of badgers in
a group being tested, with a threshold of two animals
required to test positive for the group to be considered
infected. Where two tests are used togther, results are
interpreted in parallel. IFN-γ, Gamma interferon.
infected; Fig. 3). Increasing the threshold for a posi-
tive diagnosis at the group level (i.e. more badgers
are required to test positive before a group is consid-
ered infected) reduced the chance of false positives
but also led to lower group-level sensitivity (Fig. 3).
Similar to our earlier analysis (Table 1), sensitivity
at the group level was higher when Stat-Pak and
IFN-γ were interpreted in parallel, than when either
was used in isolation. This difference was most pro-
nounced at lower levels of M. bovis prevalence
(Fig. 4).
Group-level specificity
Values of group-level specificity (HSp) increased as the
threshold number of badgers required to test positive
increased. For example, when interpreting Stat-Pak
and IFN-γ in parallel (when 50% of the group was
tested), the group would be incorrectly declared as
infected 38% of the time when using a threshold of
just one badger required to test positive, but only
Fig. 3. Effects of variations in prevalence, proportion of 9% of the time if at least two positive animals were
badgers sampled, and the threshold (minimum number
of badgers required to test positive) for concluding that a
required (Fig. 3). Conversely, group-level specificity
badger group is infected, on the group-level sensitivity and decreased as the proportion of the group that was
specificity of diagnosis of Mycobacterium bovis infection in tested increased (recall that HSp is calculated assuming
badgers. Coloured lines = group-level sensitivity at differ- the absence of infection, hence any positive results are
ent levels of infection prevalence; black lines = group- considered to be false positives and the frequency with
level specificity. Note that group-level specificity does not
which they occur increases with sample size). High
vary with prevalence. The examples shown involve the com-
bined use of Stat-Pak and gamma interferon (IFN-γ) values of group-level specificity (>95%) were obtained
with their results interpreted in parallel. Data shown based when 40% of the group was tested and a threshold of
on a group size of 15 badgers. two test-positive badgers was used (Figs 3 and 5).
Downloaded from https://www.cambridge.org/core. IP address: 46.4.80.155, on 02 Feb 2022 at 08:45:02, subject to the Cambridge Core terms of use, available at https://www.cambridge.org/core/terms.
https://doi.org/10.1017/S0950268815003210Diagnosis of TB in groups of badgers 1725
There was little difference in the specificities of the
Stat-Pak, IFN-γ test or the culture of clinical samples,
as all were within the range of 97–100%, and are com-
parable to previous estimates [21]. This suggests that
when used individually, no test would be expected to
have a false positive rate >3%, and positive results
can be considered to be reliable.
Parallel interpretation of the results of tests used in
combination was adopted because this improved sen-
sitivity, by multiplication of individual tests sensitiv-
ities. In contrast, the specificity of a combination of
tests was lower than that of individual tests. Series
Fig. 5. The influence of the proportion of a badger group
that is sampled and the choice of test(s) on group-level
test interpretation was also investigated but although
specificity for diagnosing Mycobacterium bovis. In this it improved the specificity of tests, this was at the
example, a threshold of two animals testing positive is cost of markedly lower sensitivity (Table 1) and conse-
required for a group to be considered infected. Where two quently the risk of missing cases of infection was un-
tests are used togther, results are interpreted in parallel. acceptably high.
Note that the y-axis is truncated. IFN-γ, Gamma inter-
The methods used to estimate the sensitivity and
feron.
specificity of each diagnostic test (Bayesian latent
class analysis [16]) did not require knowledge of true
infection status. The figures quoted in the present
The HSp achieved when using Stat-Pak and IFN-γ
study can be considered an update on the estimates
tests together and interpreting results in parallel was
previously published by Drewe et al. [4] which were
lower than that achieved when either test was used
based on the same methods and used the same
in isolation at any threshold value (Fig. 5). The oppos-
model priors. There are two notable differences in
ite was true if the two tests were used together but the
the estimates produced in the current study from
results were interpreted in series (i.e. both tests need-
those reported previously by Drewe et al. [4] and
ing to be positive for an animal to be considered
Chambers et al. [21], the latter who calculated sensi-
infected) due to the perfect specificity of this diagnos-
tivity and specificity by comparing test results to cul-
tic approach (Table 1). However, this absence of false
ture of M. bovis from tissues collected during
positives came at the expense of a high probability of
detailed necropsies. First, in the current analysis the
false-negative results (i.e. reduced sensitivity resulting
Stat-Pak was estimated to be slightly more sensitive
in missing cases of true infection: Table 1).
than previously calculated (i.e. 58% in the current ana-
lyses vs. 50% in Drewe et al. [4] and 50% (adults) and
56% (cubs) in Chambers et al. [21]). Second, the sen-
DI SC US S IO N sitivity of the IFN-γ test in the present study was esti-
We modelled empirical data from a long-term study of mated to be markedly lower than previously
TB epidemiology in a wild badger population to ex- calculated (i.e. 52% in the current analyses vs. 80%
plore the effects of infection prevalence, trapping in Drewe et al. and 85% (adults) and 57% (cubs) in
efficiency and use of three different diagnostic tests Chambers et al.). The likely explanation for differ-
on the ability to detect M. bovis infection in groups ences between the findings of Drewe et al. and those
of badgers. The sensitivity (ability to detect infected of the current study is the larger sample size which
individuals) of all three diagnostic tests was low would be expected to increase precision; Drewe et al.
when each test was used in isolation. Even the most [4] was based on fewer test results (875 capture events
sensitive test (Stat-Pak) would be expected to miss of 305 badgers caught over 2 years), whereas the cur-
about 40% of infected badgers. This level of false- rent study involved results from 2022 capture (sam-
negative test results would be expected to seriously pling) events involving 541 individual badgers
limit the effectiveness of any disease control pro- caught over 7 years. Further, the method used by
gramme which used the Stat-Pak (or a test of similar Chambers et al. [21] of estimating sensitivity and spe-
sensitivity) as the sole means of detecting infection cificity by comparing the results of Stat-Pak and
in individual live badgers. IFN-γ tests with tissue culture is likely to overestimate
Downloaded from https://www.cambridge.org/core. IP address: 46.4.80.155, on 02 Feb 2022 at 08:45:02, subject to the Cambridge Core terms of use, available at https://www.cambridge.org/core/terms.
https://doi.org/10.1017/S09502688150032101726 S. N. Buzdugan and others
test sensitivity because culture is itself of limited sensi- where badger groups are smaller. We do not consider
tivity, even when performed on necropsy tissues [22]. this to be a major limitation, however, because several
Although Chambers et al. employed a comprehensive nearby small groups could be treated as a cluster for
necropsy, histology and extended culture method, this analytical purposes (as we did here: 15 animals per
is unlikely to have had perfect sensitivity and this ‘group’ were used simply to make it easier to interpret
could be sufficient to account for the apparent discrep- results in terms of whole animals).
ancy with estimates from the present study. These findings help inform us on the desired charac-
The implications of our findings are that the inter- teristics that we may seek in novel diagnostic tests for
pretation of IFN-γ and Stat-Pak test results in parallel use in selective management of TB in badger popula-
would be advisable during the initial stages of a dis- tions. Hence, in order to improve on diagnostic per-
ease control programme when prevalence is high, be- formance at the group level beyond that potentially
cause in this scenario the proportion of test positives provided by existing tests, the sensitivity of any new
that are true positives is highest and the proportion test would need to be >80% (the level achieved when
of false positives is at its lowest. At this stage, where using Stat-Pak and IFN-γ in combination). Such a
detection of infection is important, a diagnostic ap- high level of sensitivity is likely to be difficult to
proach with a high negative predictive value (i.e. the achieve with a single test without compromising spe-
proportion of negative test results that are truly unin- cificity, and hence the use of a combination of two
fected) is likely to be preferred. As the control pro- (or even three) independent tests with slightly higher
gramme progresses so higher specificity becomes sensitivities than Stat-Pak or IFN-γ has the potential
more important, to minimize the false-positive frac- to make a substantial practical difference in our ability
tion by correctly identifying all negative animals, to detect infection in badger groups. For example, if a
and a diagnostic approach with a high positive pre- diagnostic sensitivity of 90% could be achieved, this
dictive value is likely to be preferred. As the preva- would allow a group to be correctly identified as
lence of infection is reduced, as would hopefully be infected when as few as 10% of badgers were tested
the case later during the disease control programme, (under the model assumptions of 20% prevalence
then it becomes increasingly undesirable to have and a group size of 15 badgers, and with the same
high numbers of false positives, particularly in relation threshold of two badgers required to test positive).
to demonstrating freedom from infection. The desired The benefits of increased sensitivity include a reduc-
sensitivity and specificity of diagnosis [and therefore tion in the proportion of badgers that need to be tested
the choice of which test(s) to use] should therefore and the ability to detect infection at lower prevalence.
be chosen in relation to the objectives of intervention In conclusion, of the options investigated, the most
and the stage of the disease control strategy. sensitive and specific diagnostic approach to detect
Importantly, sensitivity analyses suggested that for M. bovis in badgers at the group level using tests
the combination of IFN-γ and Stat-Pak tests to pro- which are currently available would appear to be to
vide accurate results at the group level (where a use the Stat-Pak and IFN-γ tests together, interpret
group consists of 15 badgers in either a single sett or their results in parallel, and use a threshold of two
a cluster of nearby setts), estimates of trapping badgers required to test positive. Importantly, this
efficiency derived from the Randomized Badger Culling would appear to be achievable at levels of trapping
Trial of 35–70% [23] would be sufficient when infec- efficiency that have been observed in previous field
tion prevalence levels are moderate or high (i.e. preva- studies, meaning that not every badger needs be
lence is in the region of 15–30%, as might be expected tested. However, there are considerable practical chal-
at the start of a disease control programme). However, lenges to this approach given the requirement for
as prevalence was reduced toDiagnosis of TB in groups of badgers 1727
obtained, then the group would be considered infected infection in an undisturbed high-density badger (Meles
and there would be no requirement for the IFN-γ test meles) population. Epidemiology and infection 2013;
141: 1445–1456.
to be run in such circumstances. An alternative, if one
10. de Leeuw AN, et al. Experimental comparison of keta-
were prepared to accept a lower diagnostic sensitivity, mine with a combination of ketamine, butorphanol
would be to use the Stat-Pak alone. This would mean and medetomidine for general anaesthesia of the
higher numbers of badgers would need to be tested in Eurasian badger (Meles meles). Veterinary Journal
order to detect infection and our model suggests 2004; 167: 186–193.
Stat-Pak would struggle to detect infected badger 11. Cheeseman CL, Harris S. Methods of marking badgers.
Journal of Zoology 1982; 197: 289–292.
groups at prevalences below ∼20%. Notwithstanding
12. Woodroffe R, et al. Welfare of badgers (Meles meles)
questions of cost-effectiveness and field readiness, in subjected to culling: development and evaluation of a
order to improve diagnostic performance at the closed season. Animal Welfare 2005; 14: 19–25.
same scale, any new test developed in the future 13. Chambers MA, et al. Validation of the BrockTB
would need to be more sensitive than the IFN-γ test Stat-Pak assay for detection of tuberculosis in
Eurasian badgers (Meles meles) and influence of disease
while maintaining a sufficiently high specificity. Even
severity on diagnostic accuracy. Journal of Clinical
better would be a single test that is more sensitive Microbiology 2008; 46: 1498–1500.
than the combined use of Stat-Pak and IFN-γ. 14. Dalley D, et al. Development and evaluation of a
gamma-interferon assay for tuberculosis in badgers
(Meles meles). Tuberculosis 2008; 88: 235–243.
ACK N OWL E D G E ME N T S 15. Clifton-Hadley RS, Wilesmith JW, Stuart FA.
Mycobacterium bovis in the European badger (Meles
This research was funded by Defra (project SE3265). meles): epidemiological findings in tuberculous badgers
RVC manuscript number: PPH_01113. from a naturally infected population. Epidemiology
and Infection 1993; 111: 9–19.
16. Branscum AJ, Gardner IA, Johnson WO. Estimation of
D E C L A RATI O N OF I NT E R E ST diagnostic-test sensitivity and specificity through
Bayesian modeling. Preventive Veterinary Medicine
None. 2005; 68: 145–163.
17. Spiegelhalter D, et al. BUGS 0·5: Bayesian Inference
Using Gibbs Sampling – Manual (version ii). Medical
R E FE RE NC E S Research Council Biostatistics Unit, Cambridge, 1996.
1. Defra and AHPA. (https://www.gov.uk/government/sta- 18. Cousins DV, Florisson N. A review of tests available for
tistics/incidence-of-tuberculosis-tb-in-cattle-in-great-britain). use in the diagnosis of tuberculosis in non-bovine species.
Accessed 17 August 2015. Revue Scientifique et Technique 2005; 24: 1039–1059.
2. The Mammal Society. (http://www.mammal.org.uk/ 19. Woodroffe R, Frost SDW, Clifton-Hadley RS. Attempts
species-factsheets/Badger). Accessed 17 August 2015. to control tuberculosis in cattle by removing infected
3. Delahay RJ, et al. The use of marked bait in studies of badgers: constraints imposed by live test sensitivity.
the territorial organization of the European Badger Journal of Applied Ecology 1999; 36: 494–501.
(Meles meles). Mammal Review 2000; 30: 73–87. 20. Dohoo I, Martin W, Stryhn H. Screening and diagnostic
4. Drewe JA, et al. Diagnostic accuracy and optimal use of tests. In: Veterinary Epidemiologic Research, 2nd edn.
three tests for tuberculosis in live badgers. PLoS ONE Charlottetown, Canada: VER Inc., 2009, p. 111.
2010; 5: e11196. 21. Chambers MA, et al. Performance of TB immunodiag-
5. Byrne AW, et al. Population estimation and trappability nostic tests in Eurasian badgers (Meles meles) of differ-
of the European badger (Meles meles): implications for ent ages and the influence of duration of infection on
tuberculosis management. PLoS ONE 2012; 7: e50807. serological sensitivity. BMC Veterinary Research 2009;
6. Woodroffe R, et al. Effects of culling on badger abun- 5: 1746–6148.
dance: implications for tuberculosis control. Journal of 22. Crawshaw TR, Griffiths IB, Clifton-Hadley RS.
Zoology 2008; 274: 28–37. Comparison of a standard and a detailed postmortem
7. Travis ER, et al. An inter-laboratory validation of a real protocol for detecting Mycobacterium bovis in badgers.
time PCR assay to measure host excretion of bacterial Veterinary Record 2008; 163: 473–477.
pathogens, particularly of Mycobacterium bovis. PLoS 23. Smith GC, Cheeseman CL. Efficacy of trapping during
ONE 2011; 6: e27369. the initial proactive culls in the randomised badger cul-
8. Delahay RJ, et al. The spatio‐temporal distribution of ling trial. Veterinary Record 2007; 160: 723–726.
Mycobacterium bovis (bovine tuberculosis) infection in 24. Reid N, et al. Badger survey of Northern Ireland 2007/
a high‐density badger population. Journal of Animal 08. Report prepared by Quercus and Central Science
Ecology 2000; 69: 428–441. Laboratory for the Department of Agriculture &
9. Delahay RJ, et al. Long-term temporal trends and esti- Rural Development (DARD), Northern Ireland, UK,
mated transmission rates for Mycobacterium bovis 2008, 40 pp.
Downloaded from https://www.cambridge.org/core. IP address: 46.4.80.155, on 02 Feb 2022 at 08:45:02, subject to the Cambridge Core terms of use, available at https://www.cambridge.org/core/terms.
https://doi.org/10.1017/S0950268815003210You can also read