Department Application Bronze and Silver Award - University ...
←
→
Page content transcription
If your browser does not render page correctly, please read the page content below
Department Application Bronze and Silver Award
ATHENA SWAN BRONZE DEPARTMENT AWARDS
Recognise that in addition to institution-wide policies, the department is working to promote gender
equality and to identify and address challenges particular to the department and discipline.

ATHENA SWAN SILVER DEPARTMENT AWARDS
In addition to the future planning required for Bronze department recognition, Silver department
awards recognise that the department has taken action in response to previously identified challenges
and can demonstrate the impact of the actions implemented.

Note: Not all institutions use the term ‘department’. There are many equivalent academic groupings
with different names, sizes and compositions. The definition of a ‘department’ can be found in the
Athena SWAN awards handbook.

COMPLETING THE FORM
DO NOT ATTEMPT TO COMPLETE THIS APPLICATION FORM WITHOUT READING THE ATHENA
SWAN AWARDS HANDBOOK.

This form should be used for applications for Bronze and Silver department awards.
You should complete each section of the application applicable to the award level you are applying for.

      Additional areas for Silver applications are highlighted
      throughout the form: 5.2, 5.4, 5.5(iv)

If you need to insert a landscape page in your application, please copy and paste the template page at
the end of the document, as per the instructions on that page. Please do not insert any section breaks
as to do so will disrupt the page numbers.

WORD COUNT
The overall word limit for applications are shown in the following table.
There are no specific word limits for the individual sections and you may distribute words over each of
the sections as appropriate. At the end of every section, please state how many words you have used
in that section.

We have provided the following recommendations as a guide.

                                                                                                          2
Department application                         Bronze     Silver
Word limit                                       10,500      12,000
 Recommended word count
 1.Letter of endorsement                          500        500
 2.Description of the department                  500        500
 3. Self-assessment process                       1,000      1,000
 4. Picture of the department                     2,000      2,000
 5. Supporting and advancing women’s careers      6,000      6,500
 6. Case studies                                  n/a        1,000
 7. Further information                           500        500

                                                                      3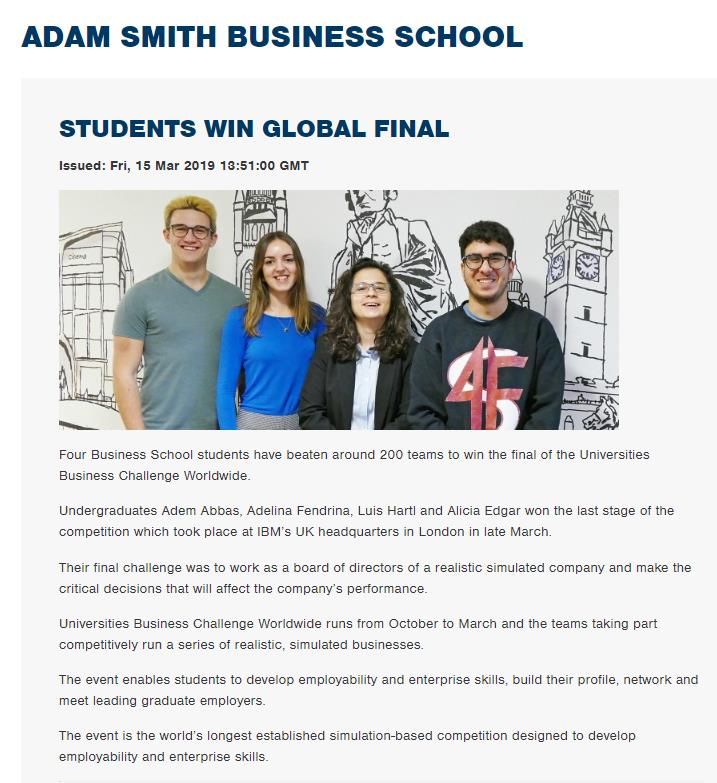
Name of institution               University of Glasgow
  Department                        Adam Smith Business School
  Focus of department               AHSSBL
  Date of application               April 2019
  Award Level                       Bronze
  Institution Athena SWAN award     Date: April 2016
  Contact for application           Dr Margaret Fletcher
  Must be based in the department
  Email                             Margaret.Fletcher@Glasgow.ac.uk
  Telephone                         0141 330 5939
  Departmental website              https://www.gla.ac.uk/schools/business/

1. LETTER OF ENDORSEMENT FROM THE HEAD OF DEPARTMENT
Recommended word count: Bronze: 500 words | Actual: 667

                                                                              4
Glossary of Acronyms

 AHSSBL           Arts, Humanities, Social Sciences, Business and Law
 AIB              Academy of International Business
 AACSB            Association to Advance Collegiate Schools of Business
 AMBA             Association of MBAs
 AccFin           Accounting and Finance
 AS               Athena Swan
 ASBS             Adam Smith Business School
 CABS             Chartered Association for Business Schools
 CAP              College Assessment Panel
 CIPD             Chartered Institute for Personnel and Development
 CoSS             College of Social Sciences
 ECDP             Early Career Development Programme
 E&D              Equality and Diversity
 EOD              Employee and Organisational Development
 ER               External Relations
 ESRC             Economic & Social Research Council
 GIC              Glasgow International College
 HE               Higher education
 HESA             Higher Education Statistics Agency
 HoS              Head of School
 HoSG             Head of Subject Group
 HR               Human Resources
 L&T              Learning and Teaching
 L, T, S          Learning, Teaching and Scholarship
 MVLS             College of Medical, Veterinary and Life Sciences
 P&DR             Performance and Development Review
 PG               Postgraduate
 PGR              Postgraduate research
 PGT              Postgraduate taught
 PS               Professional Services
 QEA              Quality Enhancement and Assurance
 RAE              Research Assessment Exercise
 REF              Research Excellence Framework
 RG               Russell Group
 R&T              Research & Teaching
 SAB              Strategic Advisory Board
 SAT              Self-Assessment Team
 SC               School Council
 SE               School Executive
 SoMDN            School of Medicine, Dentistry and Nursing
 SR               Success Rates
 UB               Unconscious Bias
 UCAS             Universities and Colleges Admissions Service
 UG               Undergraduate
 UofG             University of Glasgow
 WLM              Workload Model
 WP               Widening Participation

                                                                          5
2. DESCRIPTION OF THE DEPARTMENT
Recommended word count: Bronze: 500 words | Actual: 667
Please provide a brief description of the department including any relevant contextual information.
Present data on the total number of academic staff, professional and support staff and students by
gender.

The Adam Smith Business School (ASBS) was formed in 2010, bringing together the subjects of
Accounting and Finance, Economics and Management. Each subject is equivalent in size, in terms of both
staffing and students, and have approximately similar revenue and contributions; additionally, all
compete in terms of academic staffing in a highly competitive market, especially in Accounting, Finance
and Marketing. ASBS is one of five Schools within the College of Social Sciences (CoSS) and all ASBS staff
are co-located at the University’s Gilbert Scott Building.

The Head of School (HoS), Professor John Finch, took up post in January 2016. Since 2016, ASBS has
grown substantially (Chart 1) in terms of staffing (20% increase); currently 51% of staff are female, the
majority of women are employed in Professional Services (PS) (83% Female), with 39% in academic
positions.

Chart 1: ASBS Staff Numbers 2016 -2018 by Gender % (n)1

Expansion has brought new opportunities to recruit internationally diverse staff who bring a range of
diverse backgrounds and experiences from varying Higher Education systems. At the same time, this has
created challenges in how we recruit new colleagues, induct and on-board them properly to ensure they
are equipped to thrive in their new careers at the University, and maintain strong communication,
collegiality, and engagement across a growing and complex School. Diversity and inclusion, generally,
and gender equality, in particular, are common to each of these challenges. These issues are discussed
and addressed throughout our submission (see in particular, sections. 5.1(i)-(ii)-Recruitment strategies
and improving induction practice across ASBS; 5.3(iii) -ECDP and mentorship for new staff; and 5.6(i)-
(ii) Embedding AS Charter Principles into School structures and culture).

1
 We understand that in the AS handbook we only need to provide data for 1 year however we wanted to show
the expansion from 2016

                                                                                                             6
Student numbers are provided in Chart 2; they are consistent, for each student group, across the 3 years.
As Chart 2 demonstrates, ASBS delivers a significant PGT portfolio to circa 2k students. PGT cohorts are
predominantly international students who aspire to use their enhanced qualifications following
graduation to pursue professional careers in corporate sectors. The rapid expansion of PGT offerings to
a growing international student body, observed across most UK Business Schools, has prompted ASBS
to address and invest in enhancing intercultural communication, understanding, and pastoral and well-
being support across the student experience (see s.5.6(i)). There is a slight drop in female UG-PGR
participation, which we discuss and outline plans to address in s.4.1 (iii-iv).

Chart 2: Students by Level and Gender % (n)2

The School governance and committee structure is outlined in Figure 1. Subjects reflect disciplinary
coherence, providing a forum to discuss and consult with colleagues on staffing provision and workload.
Internal governance rests with the School Executive (SE) (3F:7M). ‘Alternate’ shadowing roles (7 females
and 3 males) and a three-year tenure for SE were recently introduced as part of workforce planning
measures to improve gender balance. The HoS introduced a formalised process of recruitment for
Executive roles in 2018. Vacant roles are advertised, internally, with expressions of interest sought and
followed by a formal interview process. The impact of this approach on the gender balance of SE will be
evaluated over the life of the Action Plan [Action 1.1].

    Action 1.1   Evaluate impact of workforce planning measure on gender balance of School Executive
                 (SE).

The School Council is comprised of all staff within the School and meets twice a year. It provides a forum
for the School to discuss strategies, plans, policies and helps to facilitate the fulfilment of the agreed
responsibilities of the SE, by considering reports and the development and delivery of the School
strategies.

2
 We understand that in the AS handbook we only need to provide data for 1 year however we wanted to show
the expansion from 2016

                                                                                                             7
School
                                       Subject Group    Council         Accreditations
                                         Meetings                        Committee

                           School
                        Research and
                                                                                          Admissions
                         Knowledge
                                                                                          Committee
                          Exchange
                         Committee

                      School
                   Learning and                         School                                 Health and
                                                                                               Safety and
                     Teaching                                                                  Wellbeing
                    Committee                          Executive                               Committee

                           School                                                            MBA
                          External                                                        Recruitment
                        Engagement                                                       and Marketing
                         Committee                                                        Committee

                                                                         Professional
                                         Rankings
                                                           Quality         Services
                                        Committee
                                                        Enhancement        Meeting
                                                         & Assurance
                                                            (QEA)
                                                         Committee

Figure 1: Governance and Committee Structure

Subject area remits are primarily based around teaching (delivery and resource); and the School has 10
Research Clusters (Table 1). These allow for the more detailed development and stewardship of the
research environment; leadership of these currently have a 50:50 gender mix.

Table 1: Research Clusters 2018
 RESEARCH CLUSTER                                                      CLUSTER LEAD
 Accounting                                                                  M
 Entrepreneurship, Development and Political Economy                         M
 Finance                                                                     M
 Human Resource Management and Organisational Behaviour                      F
 International Business and Enterprise                                       M
 Macroeconomics                                                              F
 Marketing                                                                   F
 Microeconomics                                                              F
 Services and Operations Management                                          F
 Strategy and Decision-making                                                M
 GRAND TOTAL                                                               50/50

The School works closely with its Strategic Advisory Board (SAB) to ensure the relevance of our business
education offering. SAB members are drawn from the business and professional community. ASBS has

                                                                                                            8
increased female representation on SAB from 12% in 2017/18 to 38% in 2019: 6/16 SAB members are
women, including Carolyn Currie, Chief Executive of Women Enterprise Scotland. ASBS will build on this
progress towards 50F:50M representation over the next 4 years (equivalent to 2 membership rotation
cycles) [Action 1.2].

 Action 1.2    Work with Strategic Advisory (SAB) Chair to improve gender balance on SAB towards
               50:50 male and female membership by 2023; in line with Gender Representation on
               Public Boards (Scotland) Act 2018.

                                                                                                         9
3. THE SELF-ASSESSMENT PROCESS
Recommended word count: Bronze: 1000 words | Actual 500

i. The self-assessment team (SAT)
The SAT comprises 11 academic staff (including the HoS as an active member), 4 PS staff and 1 PGR
student. The University Gender Equality Officer (Equality and Diversity Unit) is an external advisor. There
were 9 females and 7 males. Dr Belgin Okay-Somerville went on maternity leave in September 2018 and
her SAT role was covered by Dr Marjana Johansson (both are listed here). See Table 2 below.

The SAT is representative of all subjects and staff groups across ASBS. It includes participation from staff
with a range of career stages, experience of the University and work/life balance perspectives and caring
commitments.

To ensure a fair division of work, the SAT members were formed into 4 subgroups: students, staff,
flexible working and maternity and organisation and culture. Each subgroup had a voluntary lead who
co-ordinated analysis and feedback for each section of the application. Each subgroup reported back
their findings which were discussed and minuted at the SAT meetings.

Table 2: SAT membership
 Name                   Role                             F/M      SAT role/information
 Ms Lynn Bradley*       Lecturer (L,T,S) in              F        Lecturer, joined ASBS in 2014 after a
 Member of student      Accounting and Finance                    long career in professional practice. Her
 subgroup                                                         current non-executive positions out
                                                                  with the School reinforce her
                                                                  understanding of gender equality
                                                                  issues.
 Miss Kirsteen Daly*         Accreditations, Rankings    F        Joined the University from school, has
 Member of the staff         and Communication                    extensive PS line management
 subgroup                    Manager                              experience, responsibilities in various
                             Interim Joint Head of                job roles through advancement through
                             Professional Services                the ranks; joined the SAT to ensure
                                                                  enhancement of policies to ensure
                                                                  equality of opportunity and career
                                                                  development.
 Prof Iain Docherty          Director of External        M        Worked at UofG for 15 years, prior to
 Member of                   Engagement                           move to senior management position at
 Organisation and                                                 University of Stirling just before
 Culture subgroup (until                                          submission.
 leaving ASBS in March
 2019).
 Dr Katherine Duffy          Lecturer (R&T) in           F        Lecturer in Marketing since 2015, with
 Member of                   Management                           research expertise in consumer
 Organisation and                                                 behaviour and digital consumption.
 Culture subgroup.

                                                                                                               10
Name Role F/M SAT role/information
Prof John Finch Head of School M Head of School since 2016, responsible
Ex-officio member of for the strategic development of the
SAT School and line manager to academic
staff.
Dr Margaret Fletcher* Senior Lecturer (R&T) in F Holds the Equality and Diversity role on
Member of International Business the Executive of the UK & Ireland
Organisation and Athena SWAN SAT Chair Chapter of the Academy of
Culture subgroup. International Business (AIB) and mentor
for the Woman in AIB group. Past award
holder of European Social Funding for
Enterprise Education for women
returners.
Mr David Jones Internationalisation M Interested in promoting gender equality
Member of Officer and diversity in the Higher Education
Organisation and sector.
Culture subgroup.
Dr Marjana Johansson* Senior Lecturer (R&T) in F Research interests in gender, diversity
Member of Flexible Organisational and equality. Has published on the
working subgroup Behaviour careers and experiences of international
(Joined September female faculty working in UK business
2018). schools.
Mrs Paula Karlsson- Lecturer (L,T,S) in F Early career lecturer on a learning &
Brown Management teaching contract. Joined the University
Member of Flexible in May 2016. No previous experience of
working subgroup. equality issues.
Prof Charles Nolan Professor in Economics M Professor of Economics since 2010.
Member of the staff (Bonar MacFie Chair in Began career as economist at Bank of
subgroup. Economics) England. Returned to academia in 1998
and has held several senior
administrative posts.
Dr Belgin Okay- Lecturer (R&T) in F Research interests include efficient skills
Somerville Human Resource utilisation at work with implications for
Member of Flexible Management employee wellbeing.
working subgroup
(maternity leave
September 2018).
Prof Robbie Paton Director of M Extensive professional and accreditation
Member of the staff Accreditations and expertise, as well as Academic Fellow
subgroup. Rankings CIPD, all of which require awareness
and action re: diversity, inclusion and
equality.
11Name Role F/M SAT role/information
Miss Jan Shearer Accreditation Officer F Interested in gender equality within the
Athena SWAN work place and associated polices.
Professional Services Engagement Lead for PS staff, looking
Lead to improve equality in the workplace.
Dr Vasilios Sogiakas Lecturer (L,T,S) in M Lecturer in Finance. Director of the
Member of student Finance Graduate Centre of Economic and
subgroup (until leaving Financial Studies.
ASBS in December
2018).
Dr Evangelos Vagenas- Director of Graduate M Role includes promoting diversity and
Nanos Studies inclusion. Current research deals with
Member of the staff issues around gender pay in corporate
subgroup. finance.
Mrs Jacqueline Finance Manager F Finance and Operations Manager, a
Williamson qualified accountant with over 20 years’
Member of Flexible service.
working subgroup.
Miss Fan Wu PGR student F Full-time Ph.D. student with an interest
Member of student in leadership and international
subgroup. business.
External to the School- Advisor to SAT
Dr Katie Farrell Gender Equality Officer F Experience of UG-PGT-PGR-staff
transitions at UofG. In dual-career
relationship. Shared data, advice and
guidance on best practice and AS
process.
*Subgroup leader
SAT membership is recognised in the School Workload Model (WLM) whereby an overall administration
allocation of 150 hours per annum allows staff to take on roles and projects on a volunteer basis. The
SAT membership can be reported in the annual Performance and Development Review process (P&DR)
under leadership and citizenship. Additionally, allocation is made for the SAT chair (200 hours). This is
within a broad range of 150 to 350 hours allocated to other senior administrative roles.
ii. Account of the self-assessment process
All staff were invited to note interest in participating in the SAT by email. The SAT chair was appointed
in September 2017, and the process of recruiting a balanced SAT team commenced. From the notes of
interest staff were recruited to ensure a balance of gender, roles and grades. A document with a remit
containing the terms of reference, goals, responsibilities and reporting structure was prepared and
agreed with the HoS. Members were recruited and coalesced around the four sub-task groups.
The first SAT meeting was held on 1st December 2017 and the SAT have met a further 7 times, with
additional meetings and online communication between various members/subgroups and other
School staff to access information and data. All members of the SAT contributed to the drafting of this
application. The initial tasks were to prepare a staff survey, analyse the data and prepare a report.
Overall survey response rate (SRR) was 60% (54% Academic SRR; 80% PS SSR). 64% of Academic female
and 47% Academic male; and 74% PS female and 100% PS males responded. All meetings of the SAT
are formally minuted, and the minutes are sent by email to the members of the SAT. Minutes are also
published on SharePoint.
12Action 2.1 Increase Athena SWAN (AS) survey response rate to enhance engagement, which will
run every 2 years.
Internal Consultation:
At the start of the process, the ASBS SAT chair and PS lead met with the former SAT Chair from the
School of Medicine, Dentistry and Nursing (SoMDN). Like SoMDN, ASBS is a large School with 3 strong
and reasonably distinct ‘Subject’ areas, and this meeting provided useful insights.
Prior to submission, drafts were reviewed by the subgroups, HoS, and by members of the University
Gender Equality Steering Group.
External Consultation and Learning from Best Practice:
The SAT Chair, PS Lead members attended a number of events related to Athena Swan (AS) and
diversity; for example, University, Regional and National AS awareness, development and networking
events; Chartered Association of Business Schools (CABS) Diversity and Equality Workshop; Business
School AS network group; Association of Advanced Collegiate Business Schools (AACSB) Diversity
Summit; and a range of European Foundation of Management Development (EFMD) diversity
orientated events. Additionally, a critical friend at Imperial Business School and colleagues from the UK
Accreditation Group provided insights, guidance and reviewed our submission and Action Plan.
iii. Plans for the future of the self-assessment team
The SAT will continue to meet regularly, at least three times per year, to implement and review the
Action Plan, promote the AS agenda, and plan further activity. It will be the focus for School wide Equality
& Diversity planning.
Accountability for action points will be assigned to SAT members. AS progress will continue to be a
standing item at the School meetings, and subject to an annual progress/impact report, detailing AS
progress and other gender equality activities and disseminated via SharePoint. The SAT and associated
leadership role will be embedded within the School’s governance structures, with the Chair taking on a
broader, School wide, Equality and Diversity role [Action 2.2]. In addition, the SAT will oversee the
creation and development of an AS web page as well as monitoring and responding to equality and
diversity issues.
Action 2.2 SAT Chair to provide annual (AS) Equality and Diversity Summary as well as a quarterly
Progress Report to the SE; actions and outcomes to be communicated to all staff via
a standing item to School Council (SC).
134. A PICTURE OF THE DEPARTMENT
Recommended word count: Bronze: 2000 words | Actual 2309
4.1 Student data
(i) Access and Foundation Courses - Numbers of men and women on access or foundation courses
Widening Participation (WP) is a key strength at UofG and the central WP team at the University were
recognised for this at Scotland’s Herald Diversity Awards last academic year. ASBS is pleased to work
with WP offering courses on its Summer School. Pupils who attend benefit from an adjusted conditional
offer and assistance in preparing for university life. Data for the last 5 years shows an average of 55%
female and 45% male participation; with varied gender balance in progression to ASBS UG Economics
and Management programmes (Table 3). Progression to UG programmes for male and female students
was reasonably low over the 5-year period (14%F = 19/134; 27%M = 30/108)- ASBS will work with WP
to investigate the aspirations and plans of participants who sign-up for ASBS courses [Action 3.1].
Table 3 Summer School Participation in ASBS Courses
Summer School entrants to ASBS
Summer School participants
UG Programmes
FEMALE MALE TOTAL %F FEMALE MALE TOTAL %F
2014 28 9 37 76% 0 2 2 0%
2015 27 23 50 54% 3 2 5 60%
2016 26 32 58 45% 5 8 13 38%
2017 29 13 42 69% 8 6 14 57%
2018 24 31 55 44% 3 12 15 20%
5-year ave: 134 108 242 55% 19 30 49 39%
Moreover, AS self-assessment showed teaching inputs were almost totally male. In future, Summer
School delivery will be more gender-balanced, with appropriate recognition in the Workload Model, to
promote a range of role models [Action 3.1 and 3.2].
Action 3.1 Work with the University Widening Participation (WP) team to investigate the
motivations and intentions for future study of those participating in the Summer School.
Action 3.2 Ensure female gender representation in WP Summer School in workload planning and
allocation.
The Glasgow International College (GIC) also offers degree preparation courses for international
students in partnership with the UofG. GIC is integrated into the University campus and the School
accepts students to Economics and Management.
14Tables 4 and 5 show a generally consistent gender mix of UG and PG.
Table 4: Gender Profile – GIC Undergraduate 2016-17, 2017-17 & 2018-19
ECONOMICS MANAGEMENT TOTAL
FEMALE MALE TOTAL (F%) FEMALE MALE TOTAL (F%) FEMALE MALE
2016/17 54 41 95 (56%) 59 43 102(58%) 113 (57%) 84 (43%)
2017/18 45 53 98 (46%) 39 48 87 (44%) 84 (45%) 101 (55%)
2018/19 49 40 89 (55%) 52 38 90 (57%) 101 (56%) 78 (44%)
Table 5: Gender Profile – GIC Post Graduate Teaching across the three subject areas
GIC FEMALE MALE TOTAL (F%)
2016/17 115 125 240 (48%)
2017/18 159 173 332 (48%)
2018/19 83 100 183 (45%)
(ii) Numbers of undergraduate students by gender
Full- and part-time by programme. Provide data on course applications, offers, and acceptance rates,
and degree attainment by gender.
ASBS offers 4 UG degrees namely; Accountancy and Finance, Business and Management, Business
Economics, and Economics; in addition, it is possible to study Business and Management and Economics
as joint degrees.
UG Students Registered on ASBS Programmes
Table 6. All UG Students (n) by Gender
YEAR FEMALE MALE TOTAL %F
2013/14 740 806 1546 48%
2014/15 769 780 1549 50%
2015/16 768 760 1528 50%
2016/17 776 749 1525 51%
2017/18 762 737 1499 51%
RUSSELL GROUP (RG) BENCHMARK 45% 55%
Table 6 above shows the number of full-time UG has remained relatively consistent with broadly equal
F: M ratios; the proportion of female UGs has grown slightly but not significantly. There is more even
gender balance at ASBS than across the RG benchmark (51%F: 49%M compared to 45%F: 55%M).
Table 7 shows that only a small number of students study part-time; over the period, 50% have been
female which exceeds the RG benchmark of 44%.
15Table 7: UG Students by Academic Load and Gender
YEAR LOAD FEMALE MALE TOTAL
FULL-TIME 735 (48%) 798 (52%) 1533
2013/14 PART-TIME 5 (38%) 8 (62%) 13
FULL-TIME 766 (50%) 778 (50%) 1544
2014/15 PART-TIME 3 (60%) 2 (40%) 5
FULL-TIME 767(50%) 759 (50%) 1526
2015/16 PART-TIME 1 (50%) 1 (50%) 2
FULL-TIME 774 (51%) 748 (49%) 1522
2016/17 PART-TIME 2 (67%) 1 (33%) 3
FULL-TIME 761 (51%) 737 (49%) 1498
2017/18 PART-TIME 1 (100%) 0 (0%) 1
RG BENCHMARK FULL-TIME 45% 55%
PART-TIME 44% 56%
Table 8. UG Students (n) by Subject and Gender
SUBJECT YEAR FEMALE MALE %F
2013/14 222 221 50%
2014/15 223 230 49%
ACCOUNTING 2015/16 220 223 50%
& FINANCE 2016/17 213 215 50%
2017/18 194 200 49%
RG B/MARK 48%
2013/14 300 183 62%
2014/15 337 198 63%
BUSINESS & 2015/16 310 181 63%
MANAGEMENT 2016/17 306 185 62%
2017/18 309 191 62%
RG B/MARK 51%
2013/14 27 45 38%
2014/15 24 40 38%
BUSINESS 2015/16 30 31 49%
ECONOMICS 2016/17 24 28 46%
2017/18 31 38 45%
RG B/MARK 36%
2013/14 136 291 32%
2014/15 130 245 35%
2015/16 155 254 38%
ECONOMICS
2016/17 172 259 40%
2017/18 179 260 41%
RG B/MARK 36%
JOINT3 2013/14 55 66 45%
(N.B. No 2014/15 55 67 45%
equivalent RG 2015/16 53 71 43%
Benchmark 2016/17 61 62 50%
available) 2017/18 49 48 51%
3*JOINT Degrees relate to students studying more than one subject within the Business School as part of their academic plan
– e.g. MA in Economics and Business & Management. There are too many variations to provide meaningful data by further
disaggregating by each Joint programme.
16• In Accounting & Finance, the gender balance is generally equal and in line with the RG
Benchmark.
• Business & Management show a clear weighting towards female students at 62%. This is
higher than the RG Benchmark, which shows positive gender balance (at 51%F) [Action 31]
• In both Business Economics and Economics, the proportions of women studying both exceed
the RG Benchmarks and show an upward trend in female participation (from 38%F to 45%F in
Bus Economics and from 32%F to 41%F in Economics over the reporting period).
This is particularly encouraging. We know that Economics, as a discipline, struggles to attract women
and most recently that the Royal Economic Society has included ‘Improving Diversity’ (with ‘particular
emphasis on promoting economics to women and girls’) as a key strategic priority in its 2019-2023
Strategic Plan4. The 51% split may be due to a more gender balanced approach to open days,
recruitment fairs and promotional endeavours, which ASBS intends to continue to develop [Action 31].
Action 31 Ensure gender representation in both Academic and PS staff at UG Open Days, Offer
Holder Days and PGT recruitment sessions.
The gender split on Joint programmes has improved and now reflects a gender balance.
UG Admissions Data
Admissions are managed centrally by External Relations (ER) and are based on applicants meeting set
criteria (UCAS). As shown in Table 9 there are no significant differences in the numbers of females and
males applying, with near equal offer and acceptance rates.
Table 9: Admissions to ASBS UG Programmes- Apps/Offers/Accepts and Success Rates by Gender
Acceptance
Success Rate
Rate
ASBS ADMISSIONS APPLICATIONS OFFERS ACCEPTANCES APPS to
OFFERS to
OFFERS
ACCEPT
FEMALE 1595 46% 931 46% 241 46% 58% 26%
2013/14 MALE 1869 54% 1115 54% 284 54% 60% 25%
TOTAL 3464 100% 2046 100% 525 100% 59% 26%
FEMALE 1402 48% 855 50% 222 50% 61% 26%
2014/15 MALE 1503 52% 870 50% 221 50% 58% 25%
TOTAL 2905 100% 1725 100% 443 100% 59% 26%
FEMALE 1298 51% 803 52% 200 53% 62% 25%
2015/16 MALE 1267 49% 741 48% 174 47% 58% 23%
TOTAL 2565 100% 1544 100% 374 100% 60% 24%
FEMALE 1234 48% 755 48% 218 49% 61% 29%
2016/17 MALE 1323 52% 808 52% 227 51% 61% 28%
TOTAL 2557 100% 1563 100% 445 100% 61% 28%
FEMALE 1659 49% 1164 49% 267 49% 70% 23%
2017/18 MALE 1761 51% 1203 51% 281 51% 68% 24%
TOTAL 3420 100% 2367 100% 548 100% 69% 23%
4
https://www.res.org.uk/about/our-strategy.html
17UG Attainment
As shown in Table 10, female first-class awards have increased from 17% to 36% compared to males
15% to 22%. Both are above the RG benchmark. The majority of degrees conferred to male and female
students are at Upper Second Class honours level across the period.
Table 10: UG Attainment – All Degrees – by HESA Classification and Gender
UG Degree FEMALE MALE TOTAL
5 6
Outcomes by Gender no. % ↓ %→ no. % ↓ %→ no. % ↓
FIRST CLASS 25 17% 54% 21 15% 46% 46 16%
UPPER SECOND 106 70% 54% 92 66% 46% 198 68%
LOWER SECOND 17 11% 43% 23 17% 58% 40 14%
2013/14 THIRD CLASS 2 1% 50% 2 1% 50% 4 1%
ORDINARY/UNCLASSIFIED
HONS 1 1% 50% 1 1% 50% 2 1%
TOTAL 151 100% 52% 139 100% 48% 290 100%
FIRST CLASS 29 21% 55% 24 17% 45% 53 19%
UPPER SECOND 96 69% 52% 90 63% 48% 186 66%
LOWER SECOND 9 6% 25% 27 19% 75% 36 13%
2014/15 THIRD CLASS 1 1% 100% 0 0% 0% 1 0%
ORDINARY/UNCLASSIFIED
HONS 4 3% 80% 1 1% 20% 5 2%
TOTAL 139 100% 49% 142 100% 51% 281 100%
FIRST CLASS 52 24% 57% 39 17% 43% 91 21%
UPPER SECOND 131 61% 47% 149 67% 53% 280 64%
LOWER SECOND 28 13% 45% 34 15% 55% 62 14%
2015/16 THIRD CLASS 1 0% 50% 1 0% 50% 2 0%
ORDINARY/UNCLASSIFIED
HONS 2 1% 67% 1 0% 33% 3 1%
TOTAL 214 100% 49% 224 100% 51% 438 100%
FIRST CLASS 60 28% 58% 44 22% 42% 104 25%
UPPER SECOND 133 62% 51% 127 62% 49% 260 62%
LOWER SECOND 20 9% 42% 28 14% 58% 48 11%
2016/17 THIRD CLASS 1 0% 33% 2 1% 67% 3 1%
ORDINARY/UNCLASSIFIED
HONS 1 0% 25% 3 1% 75% 4 1%
TOTAL 215 100% 51% 204 100% 49% 419 100%
FIRST CLASS 59 36% 63% 34 22% 37% 93 29%
UPPER SECOND 83 51% 45% 101 66% 55% 184 58%
LOWER SECOND 20 12% 51% 19 12% 49% 39 12%
2017/18 THIRD CLASS 0 0% 0% 0 0% 0% 0 0%
ORDINARY/UNCLASSIFIED 0 0% 0% 0 0% 0% 0 0%
HONS
TOTAL 162 100% 51% 154 100% 49% 316 100%
5Compare vertically within gender
6 Compare horizontally across total population
18RG Benchmark: 2017-18
OVERALL FEMALE MALE TOTAL
UG Degree Outcomes by Gender %↓ %→ %↓ %→ %↓
FIRST CLASS 29% 51% 24% 49% 26%
UPPER SECOND 50% 46% 51% 54% 51%
RG LOWER SECOND 15% 42% 17% 58% 16%
B/Mark THIRD CLASS 3% 41% 3% 59% 3%
ORDINARY/UNCLASSIFIED HONS 4% 42% 4% 58% 4%
TOTAL 100% 46% 100% 54% 100%
Tables 11–14 detail performance by subject area. Females tend to gain proportionately more first-class
degrees than their male counterparts. Such performance discrepancies are investigated at a
programme level through both internal quality assurance and external (AACSB) assurance of learning.
These outcomes re: proportions achieving first class honours degree outcome reflect overall trends at
the University (31% F: 29%M) and CoSS (26%F: 22%M) level for 2017/18. The numbers of students
graduating in Joint Degrees and Business Economics, Table 15, are too low to draw any firm
conclusions.
19Table 11: UG Attainment – Accounting & Finance – by HESA Classification and Gender
Accounting & Finance FEMALE MALE TOTAL
UG Degree Outcomes by Gender no. % ↓ %→ no. % ↓ %→ no. % ↓
FIRST CLASS 11 22% 61% 7 16% 39% 18 19%
UPPER SECOND 27 54% 51% 26 60% 49% 53 57%
LOWER SECOND 10 20% 56% 8 19% 44% 18 19%
2013/14
THIRD CLASS 1 2% 33% 2 5% 67% 3 3%
ORDINARY/UNCLASSIFIED HONS 1 2% 100% 0% 0% 1 1%
TOTAL 50 100% 54% 43 100% 46% 93 100%
FIRST CLASS 10 20% 59% 7 15% 41% 17 18%
UPPER SECOND 30 61% 51% 29 63% 49% 59 62%
LOWER SECOND 5 10% 36% 9 20% 64% 14 15%
2014/15
THIRD CLASS 0 0% n/a 0 0% n/a 0 0%
ORDINARY/UNCLASSIFIED HONS 4 8% 80% 1 2% 20% 5 5%
TOTAL 49 100% 52% 46 100% 48% 95 100%
FIRST CLASS 16 26% 59% 11 17% 41% 27 22%
UPPER SECOND 34 56% 44% 44 70% 56% 78 63%
LOWER SECOND 10 16% 63% 6 10% 38% 16 13%
2015/16
THIRD CLASS 0 0% 0% 1 2% 100% 1 1%
ORDINARY/UNCLASSIFIED HONS 1 2% 50% 1 2% 50% 2 2%
TOTAL 61 100% 49% 63 100% 51% 124 100%
FIRST CLASS 15 25% 75% 5 8% 25% 20 17%
UPPER SECOND 41 67% 52% 38 64% 48% 79 66%
LOWER SECOND 4 7% 25% 12 20% 75% 16 13%
2016/17
THIRD CLASS 0 0% 0% 1 2% 100% 1 1%
ORDINARY/UNCLASSIFIED HONS 1 2% 25% 3 5% 75% 4 3%
TOTAL 61 100% 51% 59 100% 49% 120 100%
FIRST CLASS 12 28% 60% 8 18% 40% 20 23%
UPPER SECOND 23 53% 41% 33 75% 59% 56 64%
LOWER SECOND 8 19% 73% 3 7% 27% 11 13%
2017/18
THIRD CLASS 0 0% 0% 0 0% 0% 0 0%
ORDINARY/UNCLASSIFIED HONS 0 0% 0% 0 0% 0% 0 0%
TOTAL 43 100% 49% 44 100% 51% 87 100%
20Table 12 UG Attainment – Business & Management – by HESA Classification and Gender
Business & Management FEMALE MALE TOTAL
UG Degree Outcomes by Gender no. %↓ %→ no. % ↓ % → no. % ↓
FIRST CLASS 7 11% 64% 4 11% 36% 11 11%
UPPER SECOND 49 79% 68% 23 66% 32% 72 74%
LOWER SECOND 5 8% 42% 7 20% 58% 12 12%
2013/14
THIRD CLASS 1 2% 100% 0 0% 0% 1 1%
ORDINARY/UNCLASSIFIED HONS 0 0% 0% 1 3% 100% 1 1%
TOTAL 62 100% 64% 35 100% 36% 97 100%
FIRST CLASS 13 22% 76% 4 14% 24% 17 20%
UPPER SECOND 43 74% 69% 19 68% 31% 62 72%
LOWER SECOND 2 3% 29% 5 18% 71% 7 8%
2014/15
THIRD CLASS 0 0% 0% 0 0% 0% 0 0%
ORDINARY/UNCLASSIFIED HONS 0 0% 0% 0 0% 0% 0 0%
TOTAL 58 100% 67% 28 100% 33% 86 100%
FIRST CLASS 17 20% 77% 5 9% 23% 22 15%
UPPER SECOND 58 67% 58% 42 75% 42% 100 70%
LOWER SECOND 11 13% 55% 9 16% 45% 20 14%
2015/16
THIRD CLASS 0 0% 0% 0 0% 0% 0 0%
ORDINARY/UNCLASSIFIED HONS 1 1% 100% 0 0% 0% 1 1%
TOTAL 87 100% 61% 56 100% 39% 143 100%
FIRST CLASS 23 25% 77% 7 14% 23% 30 21%
UPPER SECOND 59 64% 61% 38 75% 39% 97 68%
LOWER SECOND 10 11% 63% 6 12% 38% 16 11%
2016/17
THIRD CLASS 0 0% 0% 0 0% 0% 0 0%
ORDINARY/UNCLASSIFIED HONS 0 0% 0% 0 0% 0% 0 0%
TOTAL 92 100% 64% 51 100% 36% 143 100%
FIRST CLASS 26 40% 79% 7 19% 21% 33 33%
UPPER SECOND 33 51% 59% 23 64% 41% 56 55%
LOWER SECOND 6 9% 50% 6 17% 50% 12 12%
2017/18
THIRD CLASS 0 0% 0% 0 0% 0% 0 0%
ORDINARY/UNCLASSIFIED HONS 0 0% 0% 0 0% 0% 0 0%
TOTAL 65 100% 64% 36 100% 36% 101 100%
21Table 13. UG Attainment – Business Economics – by HESA Classification and Gender
Business Economics FEMALE MALE TOTAL
UG Degree Outcomes by Gender no. % ↓ %→ no. % ↓ %→ no. % ↓
FIRST CLASS 0 0% 0% 1 11% 100% 1 8%
UPPER SECOND 4 100% 40% 6 67% 60% 10 77%
LOWER SECOND 0 0% 0% 2 22% 100% 2 15%
2013/14
THIRD CLASS 0 0% 0% 0 0% 0% 0 0%
ORDINARY/UNCLASSIFIED HONS 0 0% 0% 0 0% 0% 0 0%
TOTAL 4 100% 31% 9 100% 69% 13 100%
FIRST CLASS 1 20% 100% 0 0% 0% 1 7%
UPPER SECOND 3 60% 33% 6 67% 67% 9 64%
LOWER SECOND 0% 0% 3 33% 100% 3 21%
2014/15
THIRD CLASS 1 20% 100% 0 0% 0% 1 7%
ORDINARY/UNCLASSIFIED HONS 0 0% 0% 0 0% 0% 0 0%
TOTAL 5 100% 36% 9 100% 64% 14 100%
FIRST CLASS 2 22% 67% 1 13% 33% 3 18%
UPPER SECOND 6 67% 60% 4 50% 40% 10 59%
LOWER SECOND 1 11% 25% 3 38% 75% 4 24%
2015/16
THIRD CLASS 0 0% 0% 0 0% 0% 0 0%
ORDINARY/UNCLASSIFIED HONS 0 0% 0% 0 0% 0% 0 0%
TOTAL 9 100% 53% 8 100% 47% 17 100%
FIRST CLASS 1 25% 100% 0 0% 0% 1 14%
UPPER SECOND 2 50% 50% 2 67% 50% 4 57%
LOWER SECOND 1 25% 50% 1 33% 50% 2 29%
2016/17
THIRD CLASS 0 0% n/a 0 0% n/a 0 0%
ORDINARY/UNCLASSIFIED HONS 0 0% n/a 0 0% n/a 0 0%
TOTAL 4 100% 57% 3 100% 43% 7 100%
FIRST CLASS 4 57% 57% 3 33% 43% 7 44%
UPPER SECOND 2 29% 29% 5 56% 71% 7 44%
LOWER SECOND 1 14% 50% 1 11% 50% 2 13%
2017/18
THIRD CLASS 0 0% 0% 0 0% 0% 0 0%
ORDINARY/UNCLASSIFIED HONS 0 0% 0% 0 0% 0% 0 0%
TOTAL 7 100% 44% 9 100% 56% 16 100%
22Table 14. UG Attainment – Economics – by HESA Classification and Gender
Economics FEMALE MALE TOTAL
UG Degree Outcomes by Gender no. % ↓ %→ no. % ↓ %→ no. % ↓
FIRST CLASS 6 24% 50% 6 13% 50% 12 17%
UPPER SECOND 17 68% 33% 34 74% 67% 51 72%
LOWER SECOND 2 8% 25% 6 13% 75% 8 11%
2013/14
THIRD CLASS 0 0% 0% 0 0% 0% 0 0%
ORDINARY/UNCLASSIFIED HONS 0 0% 0% 0 0% 0% 0 0%
TOTAL 25 100% 35% 46 100% 65% 71 100%
FIRST CLASS 4 21% 27% 11 22% 73% 15 22%
UPPER SECOND 14 74% 32% 30 60% 68% 44 64%
LOWER SECOND 1 5% 10% 9 18% 90% 10 14%
2014/15
THIRD CLASS 0 0% 0% 0 0% 0% 0 0%
ORDINARY/UNCLASSIFIED HONS 0 0% 0% 0 0% 0% 0 0%
TOTAL 19 100% 28% 50 100% 72% 69 100%
FIRST CLASS 12 29% 43% 16 21% 57% 28 24%
UPPER SECOND 24 57% 33% 49 65% 67% 73 62%
LOWER SECOND 5 12% 33% 10 13% 67% 15 13%
2015/16
THIRD CLASS 1 2% 100% 0 0% 0% 1 1%
ORDINARY/UNCLASSIFIED HONS 0 0% 0% 0 0% 0% 0 0%
TOTAL 42 100% 36% 75 100% 64% 117 100%
FIRST CLASS 15 44% 36% 27 39% 64% 42 40%
UPPER SECOND 16 47% 31% 36 51% 69% 52 50%
LOWER SECOND 3 9% 33% 6 9% 67% 9 9%
2016/17
THIRD CLASS 0 0% 0% 1 1% 100% 1 1%
ORDINARY/UNCLASSIFIED HONS 0 0% 0% 0 0% 0% 0 0%
TOTAL 34 100% 33% 70 100% 67% 104 100%
FIRST CLASS 12 30% 44% 15 28% 56% 27 29%
UPPER SECOND 23 58% 43% 30 56% 57% 53 56%
LOWER SECOND 5 13% 36% 9 17% 64% 14 15%
2017/18
THIRD CLASS 0 0% 0% 0 0% 0% 0 0%
ORDINARY/UNCLASSIFIED HONS 0 0% 0% 0 0% 0% 0 0%
TOTAL 40 100% 43% 54 100% 57% 94 100%
23Table 15 UG Attainment – Joint Degrees – by HESA Classification and Gender
FEMALE MALE TOTAL
Joint %
UG Degree Outcomes by Gender no. % ↓ %→ no. %↓ → no. %↓
FIRST CLASS 1 10% 25% 3 50% 75% 4 25%
UPPER SECOND 9 90% 75% 3 50% 25% 12 75%
LOWER SECOND 0 0% 0% 0 0% 0% 0 0%
2013/14
THIRD CLASS 0 0% 0% 0 0% 0% 0 0%
ORDINARY/UNCLASSIFIED HONS 0 0% 0% 0 0% 0% 0 0%
TOTAL 10 100% 63% 6 100% 38% 16 100%
FIRST CLASS 1 13% 33% 2 22% 67% 3 18%
UPPER SECOND 6 75% 50% 6 67% 50% 12 71%
LOWER SECOND 1 13% 50% 1 11% 50% 2 12%
2014/15
THIRD CLASS 0 0% 0% 0 0% 0% 0 0%
ORDINARY/UNCLASSIFIED HONS 0 0% 0% 0 0% 0% 0 0%
TOTAL 8 100% 47% 9 100% 53% 17 100%
FIRST CLASS 5 33% 45% 6 27% 55% 11 30%
UPPER SECOND 9 60% 47% 10 45% 53% 19 51%
LOWER SECOND 1 7% 14% 6 27% 86% 7 19%
2015/16
THIRD CLASS 0 0% 0% 0 0% 0% 0 0%
ORDINARY/UNCLASSIFIED HONS 0 0% 0% 0 0% 0% 0 0%
TOTAL 15 100% 41% 22 100% 59% 37 100%
FIRST CLASS 6 25% 55% 5 24% 45% 11 24%
UPPER SECOND 15 63% 54% 13 62% 46% 28 62%
LOWER SECOND 2 8% 40% 3 14% 60% 5 11%
2016/17
THIRD CLASS 1 4% 100% 0 0% 0% 1 2%
ORDINARY/UNCLASSIFIED HONS 0 0% 0% 0 0% 0% 0 0%
TOTAL 24 100% 53% 21 100% 47% 45 100%
FIRST CLASS 5 71% 83% 1 9% 17% 6 33%
UPPER SECOND 2 29% 17% 10 91% 83% 12 67%
LOWER SECOND 0 0% 0% 0 0% 0% 0 0%
2017/18
THIRD CLASS 0 0% 0% 0 0% 0% 0 0%
ORDINARY/UNCLASSIFIED HONS 0 0% 0% 0 0% 0% 0 0%
TOTAL 7 100% 39% 11 100% 61% 18 100%
24(iii) Numbers of men and women on postgraduate taught degrees
Full- and part-time. Provide data on course application, offers and acceptance rates and degree
completion rates by gender.
There are 45 PGT degrees available across the three subjects; 5 Accounting and Finance, 16 Economics
and 24 Management PGT degrees. These include specialist and general MSc’s, MBA and Professional
Pathways. All MSc’s are full-time. Due to the high number of programmes the data is provided in
aggregate for each year. Table 16 shows a consistent two third female participation which is above the
RG average. This ratio is broadly similar across all PGT programmes, with female participation never
falling below 50%.
Table 16. All PGT Students (n) by Gender
YEAR FEMALE MALE %F
2013/14 1131 587 66%
2014/15 1007 606 62%
2015/16 1042 624 63%
2016/17 1126 647 64%
2017/18 1204 693 63%
Russel Group Benchmark 57%
PGT Student Admissions and Registration Data by Gender
Admissions are managed centrally, admissions volumes are monitored and managed through PGT
Admissions Committee or MBA admissions (the latter to reflect Association of MBA’s (AMBA),
requirement for an interview. They do not make decisions on individual applications, and diversity is
monitored in terms of nation from which the application comes. The MBA is slightly different as each
candidate is interviewed to ensure professional competency and an ability to engage with a diverse
learning community (in line with AMBA accreditation standards). Interviewers have completed the
University Unconscious Bias training course.
Table 17 shows that more females apply to PGT courses than males. However, males tend to be
marginally more successful at gaining offers and less likely to accept an offer. The average number of
registered PGT students over the period is 1,773. More females study PG courses than males, the
proportion who are female over the period ranged from 62% to 66%.
2013/2014 was an unusual year where we experienced an unexpected large increase in the volume of
applications for PGT courses. Rates returned to more normal levels for the remaining period.
25Table 17. Admissions to ASBS PGT Programmes- Apps/Offers/Accepts and Success Rates by Gender
Success Acceptance
Rate Rate
PGT ADMISSIONS APPLICATIONS OFFERS ACCEPTANCES
APPS to OFFERS to
OFFERS ACCEPTS
FEMALE 8771 63% 5060 66% 2378 68% 58% 47%
2013/14 MALE 5048 37% 2650 34% 1138 32% 52% 43%
TOTAL 13819 100% 7710 100% 3516 100% 56% 46%
FEMALE 7685 64% 1630 59% 1293 61% 21% 79%
2014/15 MALE 4290 36% 1146 41% 840 39% 27% 73%
TOTAL 11975 100% 2776 100% 2133 100% 23% 77%
FEMALE 7670 65% 1746 59% 1344 61% 23% 77%
2015/16 MALE 4182 35% 1220 41% 863 39% 29% 71%
TOTAL 11852 100% 2966 100% 2207 100% 25% 74%
FEMALE 6542 66% 1780 62% 1412 64% 27% 79%
2016/17 MALE 3302 34% 1091 38% 799 36% 33% 73%
TOTAL 9844 100% 2871 100% 2211 100% 29% 77%
FEMALE 8087 66% 1944 62% 1633 64% 24% 84%
2017/18 MALE 4143 34% 1185 38% 905 36% 29% 76%
TOTAL 12230 100% 3129 100% 2538 100% 26% 81%
26PGT Attainment:
PGT Degree Outcomes
The female and male attainment is similar; participants are most likely to achieve a Qualified outcome,
Table 18. As previously noted, attainment variations are monitored at a programme level and are subject
to both internal quality assurance review, and external accreditation review.
Table 18. PGT Attainment– by HESA Classification and Gender
PGT Degree FEMALE MALE TOTAL
Outcomes by Gender no. %↓ % → no. %↓ %→ no. %↓
DISTINCTION 47 4% 57% 35 6% 43% 82 5%
MERIT 459 41% 66% 232 41% 34% 691 41%
2013/14
QUALIFIED 604 54% 67% 300 53% 33% 904 54%
TOTAL 1110 100% 66% 567 100% 34% 1677 100%
DISTINCTION 52 5% 55% 43 8% 45% 95 6%
MERIT 384 40% 63% 230 41% 37% 614 40%
2014/15
QUALIFIED 526 55% 64% 290 52% 36% 816 54%
TOTAL 962 100% 63% 563 100% 37% 1525 100%
DISTINCTION 60 6% 61% 39 7% 39% 99 6%
MERIT 422 44% 64% 238 41% 36% 660 43%
2015/16
QUALIFIED 475 50% 61% 306 52% 39% 781 51%
TOTAL 957 100% 62% 583 100% 38% 1540 100%
DISTINCTION 55 5% 50% 54 9% 50% 109 6%
MERIT 474 44% 64% 265 44% 36% 739 44%
2016/17
QUALIFIED 560 51% 67% 279 47% 33% 839 50%
TOTAL 1089 100% 65% 598 100% 35% 1687 100%
DISTINCTION 132 11% 65% 70 11% 35% 202 6%
MERIT 578 50% 68% 267 42% 32% 845 44%
2017/18
QUALIFIED 442 38% 59% 302 47% 41% 744 50%
TOTAL 1152 100% 64% 639 100% 36% 1791 100%
27(iv) Numbers of men and women on postgraduate research degrees
Full- and part-time. Provide data on course application, offers, acceptance and degree completion
rates by gender.
PGR student numbers, see Table 19, increased over the 5 year period from 111 to 160; with average
female participation of 39%, which is below the RG Benchmark. Table 19.1 shows slight subject-level
variations, with participation in Business and Management more in line with benchmarks.
Table 20 presents registered students by academic load and reflects the overall demographics.
Table 19. All PGR Registered Students (n) by Gender
YEAR FEMALE MALE %F
2013/14 43 68 39%
2014/15 52 79 40%
2015/16 48 82 37%
2016/17 55 85 39%
2017/18 55 105 34%
RG B/Mark 45%
Table 19.1 All PGR Registered Students (n) by Gender and Main Subject
2013/14 2014/15 2015/16 2016/17 2017/18
F/M (F%) F/M (F%) F/M (F%) F/M (F%) F/M (F%)
ACCOUNTING & FINANCE 11/22 (33%) 10/24 (29%) 11/30 (27%) 18/30 (38%) 19/34 (36%)
ECONOMICS 12/23 (34%) 15/24 (38%) 17/26 (40%) 14/25 (36%) 11/34 (24%)
MANAGEMENT 18/22 (45%) 25/28 (47%) 20/26 (43%) 23/30 (43%) 24/36 (40%)
BUSINESS SCHOOL PVR 2/1 (67%) 2/3 (40%) 1/1 (50%)
RG B/Mark 45%
Table 20. PGR Students by Academic Load and Gender
YEAR LOAD FEMALE MALE TOTAL
FULL-TIME 37 (40%) 56 (60%) 93
2013/14 PART-TIME 6 (33%) 12 (67%) 18
FULL-TIME 44 (41%) 64 (59%) 108
2014/15 PART-TIME 8 (35%) 15 (65%) 23
FULL-TIME 40 (39%) 63 (61%) 103
2015/16 PART-TIME 8 (30%) 19 (70%) 27
FULL-TIME 45 (40%) 67 (60%) 112
2016/17 PART-TIME 10 (36%) 18 (64%) 28
FULL-TIME 47 (36%) 85 (64%) 132
2017/18 PART-TIME 8 (29%) 20 (71%) 28
FULL-TIME 47% 53%
RG B/Mark PART-TIME 39% 61%
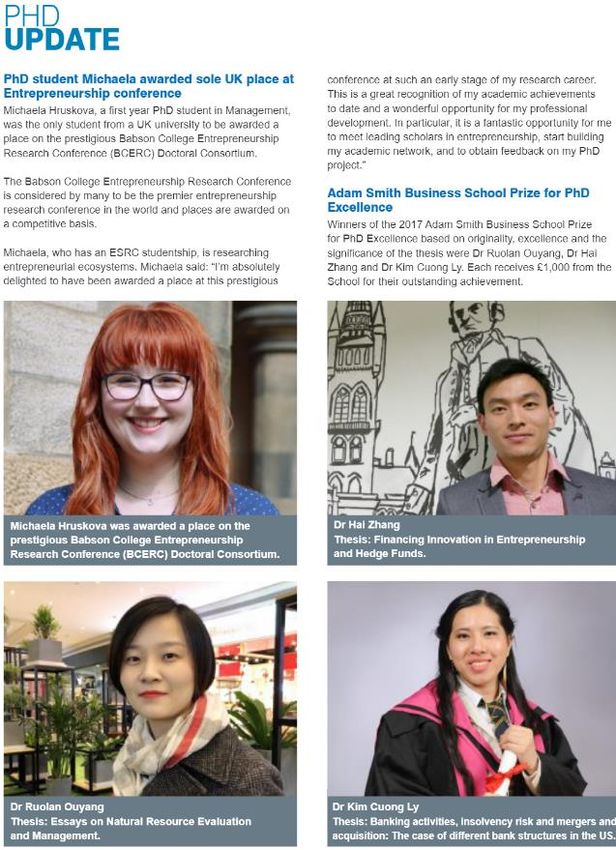
28We use opportunities to profile a diverse range of women in our PGR communications and in our School
newsletters and annual reviews:
PhD Update from 2017/18 ASBS Annual Review ‘Alumni Views’ on prospective PGR webpages
AS Self-assessment has shown that our ‘Alumni Views’ segments (one of the first page’s prospective
students might come to on the webpage) profiles female alumni well for PGR in Business and
Management. However, all alumni featured for Economics and Accounting and Finance are male.
Therefore, we aim to improve gender balance in recruitment and promotional activities and materials
[Action 4].
We also plan to mainstream diversity and inclusion within our PGR attraction strategies with External
Relations, as per our discussion of Admissions below [Action 5].
Action 4 Work with School PGR team and ER to improve the gender balance in all recruitment
and promotional activities and materials.
Action 5 Work with the School PGR team and ER to embed diversity and inclusion within
recruitment strategy towards increasing female applications/engagement.
29PGR Admissions Data:
Table 21 below shows that there are consistently more males than females applying for PhDs, with the
ratio of a third female applications. This pattern continues, whereby the offers and acceptances made
to females are lower and resulting in a lower ratio of PGR female students registered. The proportion of
male students ranged from 61% to 66%.
As noted above, Action 4 notes the need to address gender balance when recruiting. However, it will
not address nuances related to doctoral funding. Action 5 will aim to tailor specific PGR recruitment
initiatives. PGR recruitment is centralised, and only once a formal application and associated paperwork
has been gathered will the application be considered for supervision. Detailed data is not readily
available to the School.
Action 5 Work with the School PGR team and ER to embed diversity and inclusion within
recruitment strategy towards increasing female applications/engagement.
Table 21. Admissions to ASBS PGR Programmes- Apps/Offers/Accepts and Success Rates by Gender
Success Acceptance
Rate Rate
PGR ADMISSIONS APPLICATIONS OFFERS ACCEPTANCES
APPS to OFFERS to
OFFERS ACCEPTS
FEMALE 192 34% 38 40% 23 40% 20% 61%
2013/14 MALE 373 66% 56 60% 34 60% 15% 61%
TOTAL 565 100% 94 100% 57 100% 17% 61%
FEMALE 227 36% 48 47% 42 47% 21% 88%
2014/15 MALE 411 64% 55 53% 48 53% 13% 87%
TOTAL 638 100% 103 100% 90 100% 16% 87%
FEMALE 172 35% 34 35% 26 36% 20% 76%
2015/16 MALE 318 65% 62 65% 46 64% 19% 74%
TOTAL 490 100% 96 100% 72 100% 20% 75%
FEMALE 153 35% 30 42% 23 40% 20% 77%
2016/17 MALE 286 65% 41 58% 34 60% 14% 83%
TOTAL 439 100% 71 100% 57 100% 16% 80%
FEMALE 166 36% 38 41% 26 36% 23% 68%
2017/18 MALE 289 64% 55 59% 46 64% 19% 83%
TOTAL 455 100% 93 100% 72 100% 20% 77%
30PGR Completion Rates
Table 22 shows the completion rates. Overall there are no major differences with completion rates
varying between 70% and 100% for both genders.
Table 22. PGR Completion Rates (n) by Gender
MILESTONE
ADMIT ACHIEVED NOT ACHIEVED TOTAL % Completion
TERM FEMALE MALE FEMALE MALE FEMALE MALE FEMALE MALE
2008 5 8 2 3 7 11 71% 73%
2009 5 9 0 0 5 9 100% 100%
2010 5 7 0 3 5 10 100% 70%
2011 8 16 2 3 10 19 80% 84%
2012 15 23 1 4 16 27 94% 85%
2013 9 14 2 0 11 14 82% 100%
Although the PGR completion rates are on a par, there is no hard data relating to the causes of non-
completion. In conjunction with Action 5, this is intended to shed light on underlying progress issues and
if needed ensure the supervisory training course addresses any pertinent outcomes.
31(v) Progression pipeline between undergraduate and postgraduate student levels
Identify and comment on any issues in the pipeline between undergraduate and postgraduate
degrees.
The School hosts open sessions for our UG and PGT students as potential applicants to our PhD
programmes. Dissertation supervisors within the school encourage UG and PGT students to apply for
PhDs. All PGT students who are on track to gain above a ‘B’ are invited to attend an PhD open evening
where they meet PGR convenors, as well as current students across the subjects to discuss PhD
opportunities.
Chart 3: Pipeline data
For the School as a whole, the proportion of female students at PGT level is consistently higher than that
at UG and PGR level. At UG level there is gender balance, but PGR has significantly more males than
females. As outlined above, we will address the underrepresentation of women PGRs via: [Actions 4
and 5].
Action 4 Work with School PGR team and ER to improve the gender balance in all recruitment
and promotional activities and materials.
Action 5 Work with the School PGR team and ER to embed diversity and inclusion within
recruitment strategy towards increasing female applications/engagement.
324.2 ACADEMIC AND RESEARCH STAFF DATA
(i) Academic staff by grade, contract function and gender: research-only, teaching and reach or
teaching-only.
Look at the career pipeline and comment on and explain any differences between men and women.
Identify any gender issues in the pipeline at particular grades/job type/academic contract type.
ASBS’ staff body has grown year-on-year and from 118 (2013/14) to 162 (2017/18). This growth has
predominantly been to support increased PG teaching.
Table 23 and Chart 4 present overall gender composition of each subject. Academic women are
underrepresented overall, although the number has increased, the proportion remained at
approximately 36%. This data shows increasing underrepresentation of women in Accounting & Finance
(AccFin); in Economics there was an upward trajectory until 2017/18, where 4 women left; and in
Management an improvement over the period in women to 45% in 2017/18.
Census dates for data are July each academic year (i.e. July 2014 for 2013/14 etc.); a review of February
2019 data show the number and proportion of women in AccFin rose back to 36% (n=18); female
proportion remained the same for Economics at 28% (n=15); and increased slightly for Management at
46% (n=30).
Table 23: Academic and research staff number by gender and subject group
ACCOUNTING &
YEAR FINANCE ECONOMICS MANAGEMENT TOTAL
FEMALE MALE FEMALE MALE FEMALE MALE FEMALE MALE
2013/14 13 15 10 32 19 29 42 76
2014/15 13 21 14 33 19 27 46 81
2015/16 15 23 16 34 21 30 52 87
2016/17 15 27 18 35 22 32 55 94
2017/18 15 30 14 36 29 36 58 102
Chart 4: Staff number by gender and subject group (%)
33UofG has 3 main career tracks for Academic and Research staff:
• Research & Teaching (R&T)
• Learning, Teaching and Scholarship (L, T, S)
• Research-Only (Research)
Table 24 shows the Grades for each of the roles within each of the 3 tracks.
Table 24. Grade and Role Structure for Academic and Research Staff at University of Glasgow
GRADE R&T ROLES L, T, S ROLES RESEARCH ROLES
GRADE 6 N/A TEACHING ASSISTANT RESEARCH ASSISTANT
GRADE 7 LECTURER LECTURER RESEARCH ASSOCIATE
GRADE 8 LECTURER LECTURER ??ASSISTANT/ASSOCIATE
RESEARCH ASSOCIATE/FELLOW
GRADE 9 SENIOR LECTURER SENIOR LECTURER SENIOR RESEARCH FELLOW
LELELECTURER/READER
PROFESSOR PROFESSOR PROFESSOR PROFESSOR
The bulk of all Academic and Research Staff are on R&T contracts. Female numbers overall have
increased for R&T (increase of 10) and L, T, S staff (increase of 8). The female research only has
decreased. See Table 25:
Table 25: Breakdown of Academic Roles from 2013/14 – 2017/18
YEAR R&T L, T, S RESEARCH TOTAL
FEMALE MALE FEMALE MALE FEMALE MALE FEMALE MALE
2013/14 31 (30%) 71(70%) 6 (75%) 2(25%) 5 (63%) 3 (37%) 42 (36%) 76(64%)
2014/15 33 (31%) 72(69%) 6 (60%) 4(40%) 7 (58%) 5 (42%) 46 (36%) 81(64%)
2015/16 34 (32%) 71(68%) 11(65%) 6(35%) 9 (45%) 11 (55%) 54 (38%) 88(62%)
2016/17 39 (35%) 71(65%) 12(63%) 7(37%) 4 (20%) 16 (80%) 55 (37%) 94(63%)
2017/18 41 (36%) 72(64%) 14(50%) 14 (50%) 3 (16%) 16 (84%) 58 (36%) 102 (64%)
Table 26 below shows that women start to become underrepresented at Grade 9. Women are more
represented in Grades 7 and 8 roles across all years. The data also shows a significantly higher proportion
of male compared to female professors. This is low compared to the university average of 27%. It is
notable that in 2017/18 there has been a significant increase in the percentage of female professors to
23%. The increase in female professorial staff has been due to recruitment rather than promotion
rounds. Our recruitment and progression actions should further improve our female pipeline towards
progression to Grade 9 and Professorship [Actions 7.1-7.4 (recruitment) and Actions 9 -10
(progression)].
Action 7.1 Strengthen the equality statement in job adverts and candidate brochures for the
School to explicitly encourage women, an underrepresented group to apply (a
particular issue at Grade 9 and above).
Action 7.2 Challenge internal search committees to identify an equal list of potential male and
female candidates for senior posts and encourage applications.
Action 7.3 Highlight ASBS as an inclusive and supportive environment for career development
and progression: create profiles of male and female staff linked to recruitment
material.
34Action 7.4 Evaluate recruitment data to ensure that females are not appointed to the lower end
of grade spectrums (Grades 7-9).
Action 9 Hold annual promotion workshop covering criteria changes and process for all tracks
and career stages.
Action 10 Invite College HR and EOD to deliver on ways to use P&DR discussions in
progression planning.
Table 26. Academic and Research Staff by Grade and Gender 2013/14 – 2017/18
ACADEMIC 2013/14 2014/15 2015/16 2016/17 2017/18
&
RESEARCH F M %F F M %F F M %F F M %F F M %F
GRADE 6 0 1 0% 1 3 25% 4 7 36% 2 5 29% 1 2 33%
GRADE 7 8 9 47% 7 7 50% 14 10 58% 16 12 57% 16 18 47%
GRADE 8 13 8 62% 15 12 56% 14 9 61% 13 16 45% 13 17 43%
GRADE 9 14 20 41% 15 24 38% 14 25 36% 16 26 38% 17 29 37%
PROF 7 38 16% 8 35 19% 8 37 18% 8 36 18% 11 36 23%
Tables 27 shows the breakdown of grades within R&T roles. There is a higher proportion of females at
Grade 8 from 2013 to 2016, which dips in 2017.
Table 27. RT Staff by Grade and Gender 2013/14 – 2017/18
2013/14 2014/15 2015/16 2016/17 2017/18
RT
F M %F F M %F F M %F F M %F F M %F
GRADE 7 5 7 42% 3 4 43% 5 4 56% 8 5 62% 8 6 57%
GRADE 8 10 7 59% 11 11 50% 11 8 58% 11 13 46% 9 12 43%
GRADE 9 9 19 32% 11 22 33% 10 22 31% 12 23 34% 13 25 34%
PROF 7 38 16% 8 35 19% 8 37 18% 8 30 21% 11 29 28%
In 2016 the University introduced a L, T, S track for academics with clearly defined promotion criteria.
Since 2013 appointments to L, T, S staff have increased. There are more females than males in these
roles at all grade levels (Table 28). There is representation at Grade 9 but it is too early to comment on
the progression to L, T, S professorial roles given the recent introduction of it as a clear career ‘track’.
One L, T, S female professor was appointed in 2015 and has since moved to a College Assistant Vice-
Principal role.
Table 28. Learning, Teaching and Scholarship Staff by Grade and Gender 2013/14 – 2017/18
2013/14 2014/15 2015/16 2016/17 2017/18
TEACHING
F M %F F M %F F M %F F M %F F M %F
GRADE 7 2 0 100% 2 1 67% 6 2 75% 6 2 75% 6 6 75%
GRADE 8 0 1 0% 1 1 50% 1 1 50% 2 2 50% 4 4 50%
GRADE 9 4 1 80% 3 2 60% 4 3 57% 4 3 57% 4 4 57%
PROF 0 0 n/a 0 0 n/a 0 0 n/a 0 0 n/a 0 0 n/a
The proportion of staff in research only posts is low. This is due to the nature of the School’s research
which does not often require large research teams and does not tend to be funded in this manner (see
Table 29).
35Table 29. Research Staff by Grade and Gender 2013/14 – 2017/18
2013/14 2014/15 2015/16 2016/17 2017/18
RESEARCH
F M %F F M %F F M %F F M %F F M %F
GRADE 6 0 1 0% 1 3 25% 4 7 36% 2 5 29% 1 2 33%
GRADE 7 1 2 33% 2 2 50% 3 4 43% 2 5 29% 2 6 25%
GRADE 8 3 0 100% 3 0 100% 2 0 100% 0 1 0% 0 1 0%
GRADE 9 1 0 100% 1 0 100% 0 0 n/a 0 0 n/a 0 0 0%
PROF 0 0 n/a 0 0 n/a 0 0 n/a 0 5 0% 0 7 0%
(ii) Academic and research staff by grade on fixed-term, open-ended/permanent and zero-hour
contracts by gender
Comment on the proportions of men and women on these contracts. Comment on what is being done
to ensure continuity of employment and to address any other issues, including redeployment schemes.
At the School we have three contract types: open ended, open ended with funding end date and fixed
term. Generally, there is no pattern to suggest gender bias against women as the underrepresented
group by contract types shown in Table 30.
Table 30. Staff by Contract Type and Gender 2013/14 – 2017/18
OPEN ENDED Total
OPEN ENDED FIXED-TERM
(FUNDING END DATE)
YEAR F M F% F M F% F M F% F M F%
2013/14 37 67 36% 42 76 36%
2014/15 39 71 35% 46 81 36%
2015/16 41 71 37% 54 88 38%
2016/17 47 77 38% 55 94 37%
2017/18 52 84 38% 58 102 36%
Table 31 shows the split across the grades. Most academic staff have open-ended contracts. There is a
higher representation of females in Grades 7 & 8, which is reflected in the data for staff on these
contracts at those grades.
Table 31. Academic Staff on Open Ended Contracts by Grade and Gender 2013/14 -2017/18
GRADE 7 GRADE 8 GRADE 9 PROFESSOR
YEAR
F M %F F M %F F M %F F M %F
2013/14 7 7 50% 10 8 56% 13 20 39% 7 32 18%
2014/15 6 5 55% 11 12 48% 14 24 37% 8 30 21%
2015/16 8 5 62% 11 9 55% 14 25 36% 8 32 20%
2016/17 12 6 67% 11 15 42% 16 26 38% 8 30 21%
2017/18 13 9 59% 11 15 42% 17 29 37% 11 31 26%
For posts of fixed duration, the University strives to use open-ended-with funding-end-date contracts
where possible. These tend to offer more job security than rolling fixed-term contracts, which tend to
be used for roles of 1 year’s duration or less and for covering periods of maternity leave or sickness
absence. As shown in Table 32 the numbers in the School are low.
36There are relatively few fixed term contracts. Some of the appointments are subject to funding. Table
33 shows that only male professors are on fixed term contracts, where the other grades are both male
and female. Actions 7.1, 7.2, 7.3 below aim to improve the female pipeline towards professorship.
(iii) Academic leavers by grade and gender and full/part-time status
Comment on the reasons academic staff leave the department, any differences by gender and the
mechanisms for collecting this data.
The number of staff (across the 3 contract types) who have left over the last 5 years is 64 (33M: 31F)
(Table 34). The University routinely conducts exit surveys with leavers, Table 35 details the main
reasons for leaving differentiating between resignation and end of post. It doesn’t provide the
information that would be useful for identifying any E&D issues. There is no formalised policy in ASBS
for conducting exit interviews, however HoSGs normally offer informal exit interviews. Reasons given
by leaving staff are reported as straightforward career cycle, career progression and family/social
reasons across genders. We aim to conduct these routinely and recorded gender. Action 6 will help
enhance our understanding of any gender or inclusion-related leaving reasons:
Action 6 Formalise the School policy of conducting exit interviews by using the University HR
standard set of questions and institute a mechanism for recording and analysing
responses.
Table 32. Staff leavers by Grade, Gender and Full/Part-time status 2013/14 – 2016/17
2013/14 2014/15 2015/16 2016/17 2017/18
GRADE F M F M F M F M F M
FT PT FT PT FT PT FT PT FT PT FT PT FT PT FT PT FT PT FT PT
GRADE 6 - 1 - - 1 2 - 2 1 - - - 3 1 2 - 2 1 1
GRADE 7 2 - - - 2 - - - - - - 1 1 1 1 - 3 1 2 2
GRADE 8 - - 1 - - - - - - - 2 - 2 1 - - 2 - - -
GRADE 9 - - 1 - 1 - - - 2 - 1 - 1 - 1 - - - 2 -
PROF 1 - 2 1 - - 2 1 1 - 2 - - - 2 1 - - 1 -
TOTAL 4 5 4 5 6 6 9 8 8 9
Table 33. Staff leavers by Main Leaving Reason 2013/14 – 2016/17
2013/14 2014/15 2015/16 2016/17* 2017/18*
MAIN REASON FOR LEAVING
F M F M F M F M F M
RESIGNATION 3 3 2 0 3 4 4 5 7 4
*END OF POST/RETIREMENT 1 2 2 5 3 1 5 3 1 5
TOTAL 4 5 4 5 6 5 9 8 8 9
% RESIGN BY GENDER 75% 60% 50% 0% 50% 80% 45% 63% 64% 36%
% RESIGN BY OVERALL
66% 22% 58% 53% 65%
LEAVERS
37You can also read