Gender and Tone in Recorded Economics Presentations: Audio Analysis with Machine Learning
←
→
Page content transcription
If your browser does not render page correctly, please read the page content below
Gender and Tone in Recorded Economics Presentations:
       Audio Analysis with Machine Learning∗
                           Amy Handlan† and Haoyu Sheng†

                                       January 1, 2023
                                  Click here for most recent draft

                                             Abstract
          This paper develops a replicable and scalable method for analyzing tone in eco-
      nomics seminars to study the relationship between speaker gender, age, and tone in
      both static and dynamic settings. We train a deep convolutional neural network on
      public audio data from the computer science literature to impute labels for gender,
      age, and multiple tones, like happy, neutral, angry, and fearful. We apply our trained
      algorithm to a topically representative sample of presentations from the 2022 NBER
      Summer Institute. Overall, our results highlight systematic differences in presentation
      dynamics by gender, field, and format. We find that female economists are more likely
      to speak in a positive tone and are less likely to be spoken to in a positive tone, even
      by other women. We find that male economists are significantly more likely to sound
      angry or stern compared to female economists. Despite finding that female and male
      presenters receive a similar number of interruptions and questions, we find slightly
      longer interruptions for female presenters. Our trained algorithm can be applied to
      other economics presentation recordings for continued analysis of seminar dynamics.

Keywords: machine learning, audio analysis, gender, economics profession
JEL Codes: A1, C8, C45, J7

  ∗
     First, we thank NBER for providing data for this project. Without Jim Poterba, Alterra Milone,
Kristen Kenny, Debby Nicholson, and others on the NBER team, this project would not be possible. We
thank Joanna Lahey for her discussion and we thank Anna Aizer, John Friedman, Peter Hull, Soonwoo
Kwon, and Emily Moschini for their helpful conversations and suggestions. We thank Frank Chiu for his
research assistance.
   †
     Department of Economics, Brown University. Handlan email: amy handlan@brown.edu. Sheng email:
haoyu sheng@brown.edu

                                                 1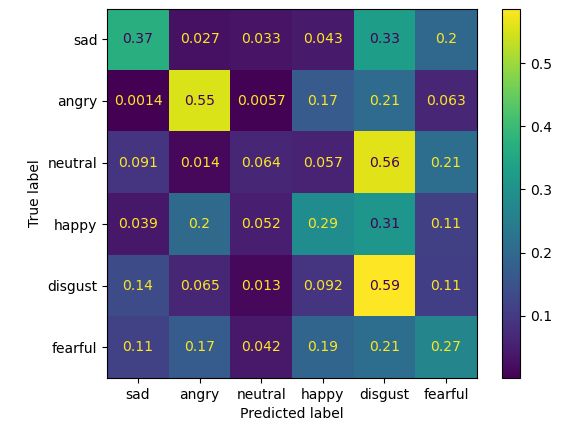
1     Introduction

Seminars and presentations are critical components in the development and dissemination
of one’s research. Presentations allow researchers to collect feedback, advertise projects, and
collect signals on how their work will be received by others. Recent work by Dupas et al.
(2021) quantifies that female and male economists have systematically different experiences
in presentations with different likelihoods to be interrupted and for those interruptions to
have more patronizing or hostile tones. A gender gap at the presentation stage of the research
pipeline can factor into additional differences downstream through publishing (Card et al.,
2020; Hengel, 2022; Hengel and Moon, 2022), attribution of credit in coauthored projects
(Hengel and Phythian-Adams, 2022; Sarsons, 2017; Sarsons et al., 2021), promotion (Bosquet
et al., 2019; Ginther and Kahn, 2021; Lundberg, 2022), recognition and awards (Card et al.,
2022), and more. Accordingly, measuring differences in the quality of presentations is an
important element for understanding the status of women in the economics profession.
    However, quantifying the quality of a presentation is not trivial. Should we measure the
presentation’s content or delivery, study the behavior of the presenter or the audience, or do
both? Ultimately, a presentation’s quality depends on both the presenter—what content they
choose to share and the manner in which they deliver that information—and the audience—
in how they engage with the presenter. For now, we focus on measuring variations in how
people speak with variations in tone throughout a presentation. Measures of tone over time
allow researchers to compare communication patterns across different speakers (presenters,
discussants, and speaking audience members) from different fields (as content quality will be
field specific). Accordingly, conditional on the presentation content being of similar quality,
if quantitative measures of how people speak are systematically different for female and male
economists, then this is indicative of gender bias in presentations.
    In this paper, we develop a machine learning approach that allows for both scalable
and time-consistent measures of the tone of speakers in recorded economic presentations.
We apply our algorithm to recordings of presentations at the National Bureau of Economic

                                              2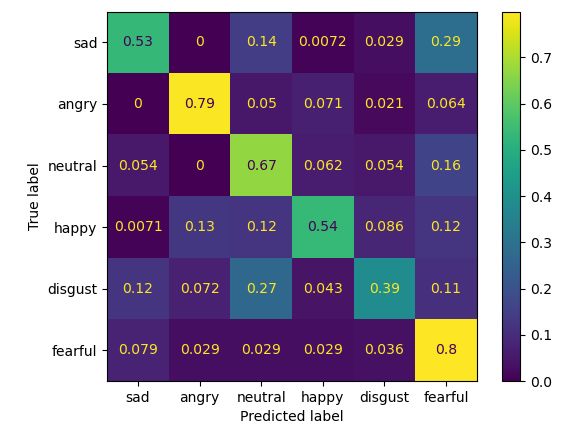
Research’s Summer Institute conference (hereafter, NBER SI), a prestigious multi-field eco-
nomics conference. We then use the imputed tone measures to study the dynamics of tone
within a speaker and between speakers during presentations. The data are aggregated and
anonymized to abstract from individual sessions and speakers and to focus on broader pat-
terns. We document which tones are more or less likely to be used by female versus male and
junior versus senior economists in seminars after controlling for aggregated fields (macroeco-
nomics and microeconomics). To study the seminar dynamics, we quantify changes in tone
over time as the discussion switches between the presenter and audience members. From
this, we estimate how past presenter-audience interaction changes future presenter tones.
We follow the footsteps of Dupas et al. (2021) in seeking to quantify and study gender and
economics presentation culture.1 We find that both male and female economists are less
likely likely to sound positive when responding to a female speaker. Finally, we outline
best practices for standardizing audio data and training robust machine learning models to
impute labels for economics research.
    To perform this imputation, we trained a convolutional neural network on public datasets
of audio clips with clearly defined emotion labels and speaker metadata that allows us to
impute labels from raw audio recordings. Since March 2020, many economics seminars
and conferences record presentations and publicly broadcast them, at least temporarily,
online. The NBER SI is one such conference that has started providing a hybrid option
and streaming the presentations online.2 We were able to work with recordings for 479
paper presentations from the 2022 conference and input the recordings into our algorithm to
produce anonymized measures of tone, gender, and age of all speakers—including presenters,
discussants, and speaking audience members.
    There are three innovations in our machine learning approach relative to a human-coding
   1
      See the related literature section for a more detailed discussion about how we relate to Dupas et al.
(2021); however, our novel machine learning approach allows us to provide both new empirical findings and
a methodological contribution.
    2
      Participants in the NBER SI are notified in their welcome letter that the conference will be streamed,
and they were also notified that the recordings would be used in research. Please see Section 2 for more
information.

                                                     3
approach. First, the machine learning approach allows for a scalable, hands-off approach to
labeling tone. With two researchers, we were able to measure tone for our entire sample
without sitting through all presentations, some of which occur simultaneously. Second, our
measures of tone include probability scores across six categories (happy, sad, angry, neutral,
sad, and disgust) rather than across discrete categorical labels, meaning we can analyze audio
segments as being more or less happy. Third, our measures of tone are high frequency in
that we evaluate tone at five-second intervals, allowing us to study tone variation at different
levels of analysis ranging from five-second intervals, to periods of uninterrupted speech, to
the presentation level. It also allows us to systematically assign tone labels to every utterance
by all speakers, including presenters, discussants, and audience members. These features of
our tone measures allow us to conduct novel empirical analysis on the dynamics of tone
in economics seminars. Furthermore, we are making our audio-tone imputation algorithm
publicly available as another contribution to the literature and the profession for continued
study of presentation dynamics in different settings but with the same metrics.
The main findings of our paper can be broken down into more detail by two levels
of analysis: within speaker and between speakers. We first produce summary statistics and
cross-sectional regression analysis about the gender, tone, and age of presenters and speaking
audience members in presentations. We then control for the research field (macroeconomics
or microeconomics), the presentation format (regular seminar or seminar with discussant),
and the overall share of female speakers in the presentation. Subsequently, we leverage the
high-frequency timing of our data to control for the lagged tone of speakers and to study
changes in tones between speakers.
We first find that the representation of female economists at the NBER SI has increased.
The representation of female presenters has increased dramatically to an almost equal split
compared to Chari and Goldsmith-Pinkham (2017). However, there is still evidence of same-
gender sorting: women in the audience are more likely to ask female presenters questions than
male presenters, and female presenters are more likely to be assigned female discussants. This
4effect remains even after controlling for the overall share of female speakers in a talk, which
we use as a proxy for female-dominated sub-fields in economics. One important point of
clarification is that our measure of audience participation slightly differs from the literature,
in that ours is based on speaking rather than on attendance.
Regarding interruptions, we find that there are similar number of interruptions for both
male and female presenters. This differs from Dupas et al. (2021), a closely related paper
in the literature studying economics seminar dynamics with hand-coded data, who find that
female presenters are interrupted more than their male counterparts and discussant format
presentations have fewer questions. Nevertheless, we do find some results that are consistent
with Dupas et al. (2021). For instance, we find that interruptions for female presenters last
longer than those for male presenters and that macroeconomics talks have more interruptions
and questions relative to microeconomics talks. We also find that there are similar amounts
of audience member participation in both regular format and discussant format talks at the
2022 NBER SI.
In addition to interruption counts and duration, we study variation in tone to further
analyze differences in seminar dynamics. Cross-sectionally, we find gender differences in tone
within speakers. On average, female speakers are more likely to sound positive or happy,
while male speakers are more likely to sound negative and serious or angry. This holds
whether we consider only presenters or only speaking audience members. Furthermore,
when we consider how speakers may change their tone over time, we find that tone is highly
persistent for both men and women. That is, if you sound happy and are uninterrupted, you
are likely to continue sounding happy.
This persistence is important when studying the effect of interruptions and dynamics
between speakers. Overall, we find that speakers sound more negative when responding to
women, whether the person is an audience member asking a question to a female speaker or a
presenter responding to a female audience member. When we look at the interaction between
presenter gender and audience gender, we find that female speakers respond more negatively
5to other women compared to how they respond to men. The gap in tone responding to men
versus women is larger for female speakers than for male speakers.
Here we think there are two effects at play: first, a common theory across social sciences
highlights that societal norms and heuristics lead to people having higher standards and
expectations for women while simultaneously having negative beliefs about female ability
(Chevalier et al., 2021; Hengel, 2022; Sarsons and Xu, 2021). This is one way to generate the
negative response to women and the negative interaction effect for women responding to other
women. Beyond the direct effects, there is also an indirect channel. Women may speak more
positively to men in an attempt to offset a larger negative bias from men compared to women.
This channel is similar to the finding in Hengel (2022), who argues that female economists
write better papers before submission to journals in anticipation of discrimination. In our
current methodology, we assign weights to the two channels and think both factor into
current tone dynamics.
Our findings also speak to how speaker age, field, and seminar type affect tones and
interactions. We find that speakers who sound older tend to sound happier and less serious.
Speakers in macroeconomics seminars are less likely to sound happy and serious and are
more likely to sound sad and neutral, and speakers in seminars without discussants are
more likely to sound serious. Presenters who sound older are less likely to respond happily
to audience members, and audience members who sound older are more likely to respond
happily to presenters in seminars with discussants. Presenters in macroeconomics seminars
with no discussant experience more large positive changes in how likely they are to sound
happy in response to an audience member’s question and even more large negative shifts.
These findings are consistent with what one might expect with regards to speaker seniority
and seminar culture across fields.
61.1 Related Literature
Our paper contributes to two broad strands of literature, with the first being the literature
on the applications of machine learning methods with audio data. Within this literature,
there is a vast interdisciplinary array of work that develops machine learning methods for
audio analysis. In relation to this literature, we follow recommendations from computer
science textbooks, such as Camastra and Vinciarelli (2015) and Hastie et al. (2009), and
commonly cited papers using convolutional neural networks for audio classification tasks
(Badshah et al., 2017; Issa et al., 2020; Lim et al., 2016; Zeng et al., 2019; Zhang et al.,
2018; Zisad et al., 2020). In our paper we use a supervised learning and ensemble learning
algorithm to be able to impute gender, tone, and age labels from raw audio recordings.
There are many papers in linguistics and computer science highlighting that machine
learning algorithms can learn unintended biases from training data. One example is Story
and Bunton (2015), which shows that working with the audio data of children’s speech
requires a separate model from adults due to their different vocal range and fluctuations.
In our paper, we show that training a joint model to impute tone from both female and
male speech will lead to a higher misclassification of tones for the same reason. Accordingly,
we develop separate, parallel algorithms for imputing tone for men and women as a way
to account for gender fixed effects of speech since gender differentiation has been shown to
increase speech emotion recognition accuracy for naive Bayes classifiers (Vogt and André,
2006).3
Outside of computer science, applications of audio analysis are common in medical and
biological settings. For example, biologists use machine learning to classify different species
by their sounds (Kahl et al., 2022). In healthcare contexts, practitioners and researchers
have studied how to use classification on audio data to aid in diagnosis of different diseases,
such as respiratory conditions (Aykanat et al., 2017; Xia et al., 2022).
3
We acknowledge that some economists do not identify as strictly male or female, but the training data
equates sex with gender and lacks non-binary data. Due to these data limitations, we focus on the differences
between male and female speakers.
7In economics, the number of papers using machine learning approaches for audio analysis
is increasing. There are a growing number of papers studying the voices of policymakers:
from the tone of Federal Reserve chairs in speeches that affect monetary policy (Alexopoulos
et al., 2022; Bisbee et al., 2022; Gorodnichenko et al., 2021) to distinguishing fake from real
presidential speeches (Alves et al., 2019). In labor economics, researchers have investigated
how audio analysis during job interviews can aid recruiters in screening candidates (Liem
et al., 2018; Naim et al., 2015; Nguyen et al., 2014; Teodorescu et al., 2022). In children
and education economics, researchers have used audio recordings of teacher and student
behavior to assess classroom climate and learning (James et al., 2018). Given the increased
application of these methods, one of the contributions of our paper is to provide some
guidelines for imputing labels from audio recordings, the main way economists will use this
tool. Our contribution here is not in developing an entirely new method but rather in aiding
other economists in appropriately using the available methods.
The second strand of literature we contribute to studies the status of women in the
4
economics profession and, more specifically, gender differences in presentations. The
Committee on the Status of Women in the Economics Profession (CSWEP) releases many
newsletters that cover how the representation of women in economics has evolved over time as
well as a yearly session at the ASSA conference highlighting papers studying this same topic.
Through newsletters issued by the CSWEP, published papers, and ongoing projects, this lit-
erature has documented systematic differences between female and male economists at every
stage of their academic career, including field selection (Avilova and Goldin, 2018; Dolado
et al., 2011; Sierminska and Oaxaca, 2021), hiring and promotion (Bosquet et al., 2019;
CSWEP Committee on the Status of Women in the Economics Profession, 2022; Ginther
and Kahn, 2021; Lundberg, 2022), and publication and recognition (Card et al., 2022; Hengel
and Phythian-Adams, 2022; Sarsons, 2017; Sarsons et al., 2021).5
4
There is a growing and important literature studying discrimination and the status of underrepresented
minorities (URM) in economics. Given that we cannot control for race or nationality, we cannot produce
measures for presentations by URM economists.
5
Abrevaya and Hamermesh (2012) find no gender differences in referee treatments of papers.
8Among these many dimensions, our work most closely relates to the analysis of gender dif-
ferences in economics presentations, which three other papers study—Chari and Goldsmith-
Pinkham (2017), Doleac et al. (2021), and Dupas et al. (2021). Chari and Goldsmith-
Pinkham (2017) document the representation of women at the NBER SI over time, from
2005 to 2016, through authorship of accepted papers and as session organizers. They find
that there is an increasing share of female-authored papers at the NBER SI over time, start-
ing with about 30 percent of papers having one female author in 2001–2004 and 40 percent
of papers having at least one female author by the 2016 NBER SI. They also find that pa-
pers with a female author are more likely to be in a session with a female organizer and
in a microeconomics field. One limitation of using NBER SI programs is that Chari and
Goldsmith-Pinkham (2017) cannot identify the presenting author.
Looking specifically at presenting authors but outside the NBER SI, Doleac et al. (2021)
find a similar increase in the representation of women as presenters in invited seminars at
top institutions from 2014-2019. They document that the share of female seminar speakers
increases from about 20 percent to over 30 percent by the end of their sample.6 Encompassing
both domains, Dupas et al. (2021) analyze presenters both at internal department seminars
and at the 2019 NBER SI. They find that 30 percent of presenters are women at the NBER
SI and at internal department seminars. They also consider recruiting seminars and find
an almost equal gender split for job market candidates presenting flyout seminars. Similar
to Chari and Goldsmith-Pinkham (2017), Dupas et al. (2021) find that microeconomics
seminars have a greater representation of female economists compared to macroeconomics
seminars. Measuring presenter representation is important to understanding the status of
women in the economics profession, but Dupas et al. (2021) take it a step further and also
quantify experiences within seminars.
Not all seminars are created equal, and deciding how to quantitatively measure dynamics
within a seminar is crucial to documenting, understanding, and addressing those differences.
6
In their paper, they conduct analysis by gender and underrepresented minority status, but here we
report the aggregated result for women.
9Dupas et al. (2021) take on this challenge and collect a large dataset of seminar dynamics
using almost 100 hand coders to cover all the presentations in their sample. In addition
to presenter characteristics, they produce a set of positive measures—audience size and
composition, and the quantity and type of interruptions—and normative measures—the
tone of the interruption.7 They find that female presenters experience more interruptions
than their male counterparts in job talks, in regular department seminars, and at the NBER
SI. However, it is unclear if more interruptions is inherently good or bad. Accordingly, they
also ask coders to label the tone of interruptions from a set of five tone labels: supportive,
patronizing, disruptive, demeaning, and hostile. For department seminars, coders assign
tone for 15 percent of interruptions in regular seminars and 8 percent of interruptions in job
talks. When matching this with presenter characteristics, they find that female presenters
are more likely to receive patronizing or hostile interruptions.
The quantitative measures from both positive and subjective elements in seminars have
greatly influenced discussions of how to improve the seminar culture in economics. Along
with other works, Dupas et al. (2021) have influenced the AEA’s guidelines for ensuring
constructive seminars and conferences8 . It is clear that the profession wants to measure tone
dynamics in seminars to gauge the effectiveness of promoting diversity and inclusivity.
Looking forward, we see there is room to expand on the important and pioneering work by
Dupas et al. (2021) through introducing a machine learning algorithm for coding seminars.
Training such an algorithm, applying it to economic seminars, and providing it for future
analysis is a key methodological contribution of our paper. Switching from hand coding to an
automated coding approach has advantages in terms of time and consistency. Hand coding
is costly in terms of the time needed for training, execution, management, and validation;
Dupas et al. (2021) detail these steps in their paper. Meanwhile, with a machine learning
7
Interruptions in Dupas et al. (2021) are coded with the interruption type (comment, criticism, sugges-
tion, clarification, or follow-up), the characteristics of the questioner, and how the presenter responded (i.e.,
did they answer or defer the question).
8
The guidelines can be found at https://www.aeaweb.org/ resources/ best-practices/ conducting-
research.
10algorithm, we scale up the labeling of speech and interruptions with only two researchers.9
Another advantage of using algorithmic tone assignment is that the same measuring tool is
used across presentations and can be consistent over years. The societal norms that influ-
ence human coders will inherently change over time and endogenously respond to updated
information on seminar experiences by gender.
However, there are trade-offs when using our machine learning approach relative to human
coders. For example, the tones we consider, such as happy, sad, and angry, are fairly generic
and are not tone labels specific to asking questions—like the tone of patronizing from Dupas
et al. (2021). The tone labels we use are limited by the public training data that we use.
More generally, with machine learning on audio data, we can only measure emotion and tone
independent of content, whereas human coders can incorporate both. That is, we measure
“how people said something,” not “what people said and how they said it.” A final trade-off
comes from seminar access: algorithms require recordings of presentations for analysis, while
human coders do not. Nevertheless, recordings would likely be beneficial to both computer
and human coders in that they would allow for replicability. As this literature continues to
grow, it is likely that a combined approach will allow for more nuance and provide more
precision to the analysis. We leave this to future research.
The rest of the paper proceeds as follows. Section 2 details our data sources and how we
produce the tone, gender, and age labels from audio data. Section 3 covers our summary
statistics and empirical analysis. Here we look at cross-sectional regressions and also leverage
the timing dimension of our data to look at tone within speaker and between speakers. In
Section 4, we discuss the broader implications of our approaches. Section 5 concludes.
9
We recognize that the analysis of Dupas et al. (2021) spans many universities and the spatial component
increased their required number of coders. Nevertheless, we argue that the algorithmic approach is still more
efficient with human labor considering there are many NBER SI sessions that happen concurrently.
112 Data and Measurement
In this section we discuss our data sources for both training our neural network and for our
analysis of economic presentations.
2.1 Data Sources
In this paper we use publicly available, labeled audio data to develop our machine learning
algorithm and apply our algorithm to recordings of economic presentations from the NBER SI
from the summer of 2022. To build our algorithm, we use two datasets commonly used in the
computer science literature: the Ryerson Audio-Visual Database of Emotional Speech and
Song (RAVDESS) and the Crowd-sourced Emotional Multimodal Actors Dataset (CREMA-
D) (Cao et al., 2014; Livingstone and Russo, 2018). Broadly speaking, these datasets include
audio recordings of hired actors speaking in the tone they were instructed to use—happy,
neutral, angry, sad, disgusted, or fearful—and information on the actors’ gender and age.
Across the datasets, we have about 8,500 short recordings. The data are balanced between
male and female actors, and the ages range from 20 to 74. While there are some variations
in accent, the datasets feature predominantly English words spoken in a neutral American
accent.
For our actual analysis, we use recordings of presentations from the NBER SI, a major
economics conference in the summer that spans three weeks with almost 500 presentations
from a variety of fields listed in Table 1. One reason we study seminar dynamics at the
NBER SI is that it allows us to have a representative sample of fields to study in our
analysis of gender and tone in economics presentations. Another reason is that gender biases
at high-stakes conferences have a clearer linkage to later-career outcomes. Presentations at
the NBER SI are highly regarded because they are thought to have a strong positive effect
on one’s academic work. Session organizers are influential, and prominent economists in
their fields and many top journal editors and referees participate as presenters, discussants,
12and audience members. Presenting at the NBER SI may affect your chances of publication,
invitations to other seminars, and overall recognition in the profession. For example, Chari
and Goldsmith-Pinkham (2017) find that papers in the NBER SI get published in top four
journals at a higher rate.10 Given the particular value our profession puts on presentations at
the NBER SI, producing detailed measures of the dynamics in presentations is particularly
important.
Due to the COVID-19 pandemic, the NBER SI was completely virtual for the 2020 and
the 2021 conferences. Participants presented, discussed, and asked questions via Zoom.
The 2022 NBER SI mostly returned to the in-person format but retained an option for
participants to attend virtually over Zoom. The presentations were also broadcast live from
the NBER’s YouTube page, and the recordings remained available for two weeks. Before
the conference, the NBER notified participants that the presentations would be available on
their YouTube page and studied:
This year’s meetings will be hybrid. The hybrid format offers expanded access
for those who are not able to attend in person, but it also brings new challenges.
Recordings of meetings will be posted on the NBER’s YouTube channel for two
weeks, where they can be accessed by students and other interested viewers. Au-
dio recordings from the YouTube postings are also going to be transformed to
anonymized data by a research team that is carrying out statistical analysis of
conference dynamics.
Even though these videos were temporarily publicly available online, there was an ex-
pectation of privacy in that the videos would eventually be taken down. Accordingly, we
submitted our project to the Institutional Review Board (IRB) at both Brown University
and NBER and received an exemption from review for our project due to the secondary
nature of the data. We took many additional steps to protect the anonymity of participants
at the NBER SI and to notify them that the recordings would be analyzed. The NBER SI
organizers also notified participants that we would be analyzing presentation dynamics from
10
Chari and Goldsmith-Pinkham (2017) find that 10 percent of papers at the NBER SI get into top four
journals, while Card and DellaVigna (2013) find that top journals only accept 6 percent of submitted papers.
13the recordings of presentations.11
The main unit of analysis for speaker dynamics is within a presentation. We do not track
speakers across presentations, and within sessions, we use anonymized labels of “speaker 1”
for the presenter, “speaker 2” for the discussant, and “speaker 3, i ” for the i th utterance by
an audience member. Furthermore, it is important to note that we can only create labels
for audience members who spoke, and thus we cannot speak to the composition of audience
members who were silent.
For presentation identifiers, we first aggregate sessions up to broad fields of “macroeco-
nomics” and “microeconomics” and only keep the broader field labels for each presentation.
We also document whether the presentation has a discussant format or a regular seminar-
style format, as this logically has an effect on presentation dynamics. Unlike the previous
literature, we do not have a separate “finance” field because there are not enough partici-
pants in each combination of field and presentation format, and thus we decrease the number
of field categories.
Subsequently, once we impute the labels for tone, gender, and age from feeding the audio
recordings into our neural network, we have our anonymized dataset. In the next section
we talk more about this imputation process. Once we have our labels, we delete all the
audio recordings and any linkages that can reconnect the data to the presentation session or
speaker in accordance with our agreement with NBER. We take privacy concerns seriously
in that we hope that our research will help support more equitable presentation experiences.
In the next section, we detail our machine learning approach to imputing gender, tone, and
age labels from raw audio recordings.
2.2 Imputation of Audio Labels
We impute gender, age, and tone labels for audio clips from the 2022 NBER SI given the
speaker roles we have hand classified. We first use a software transcription service called
11
Participants were given the option to not participate in our study. We were not given recordings for
participants who opted out, and therefore they are not included in our analysis.
14Trint to help us identify speakers and when speakers alternate. We then use convolutional
neural networks to impute the gender, age, and tone for each speaker and their utterances.
Specifically, we build gender-specific convolution neural networks to account for possible
algorithmic gender biases toward physiologically different frequency ranges across genders.
We go over the structure of our models and our imputation procedures in detail below.
To identify speakers and classify their roles, we use Trint (2022). Trint transcribes au-
dio clips and tags the different speakers based on pauses and shifts in voice characteristics.
Following the initial speaker tagging given by Trint, we manually go through all the audio
recordings and identify speakers as presenters, discussants, or audience members. Although
the transcript might offer useful information on how people interact, we ignore it for both pri-
vacy and accuracy concerns. The algorithm that Trint uses is not likely trained on economic
speech and accordingly mistranslates many words.12 With the speaker switches identified, we
assign an anonymous label of “speaker 1” for the presenter, “speaker 2” for the discussant,
and “speaker 3, i ” for the ith utterance by an audience member. In addition to speaker
roles, we have the timestamps on when speakers switch. This allow us to split seminar data
into speaker utterances and, subsequently, five-second intervals of speech.
To impute gender, age, and tone, we train a series of convolutional neural networks
that classify gender, age, and tone of speech. Convolutional neural networks are a class
of artificial neural networks, and they capture hierarchical relationships by applying layers
of convolutional kernels to a multi-dimensional feature matrix. The convolution operation
multiplies the kernels with local regions of the feature matrix element by element and sums
their products. This sum captures key information to summarize that local region. In our
application to audio data, these local regions can represent shifts in intonation or pitches,
whereas in images, the local regions can signify lines and edges. We consider this method to
be a great alternative to the multi-layer perceptron approach taken in Gorodnichenko et al.
(2021), as convolutions allow for local shift invariance, which means the model predictions
12
For example, “shocks” are often mistranslated as “sharks,” “MPK” is translated as “Olympic,” and
“Cournot” becomes “quinoa.”
15are robust to small shifts in input features.
The network structure we choose includes two layers of one-dimensional convolutional
layers, followed by a pooling layer and two more one-dimensional convolutional layers. This
hierarchy of convolutional layers can be seen as detecting feature characteristics at a gradually
more general level, going from small local fluctuations in pitches to an overall classification of
tones or age. We iterate the models over our training data 200 times, minimizing the cross-
entropy between the predicted labels and the true labels for classification tasks (gender and
tone) and the mean squared errors for regression tasks (age). We have three sets of models,
trained to predict age, emotions, and gender. For age and emotion, we train two gender-
specific models for each label. We do this because we want to eliminate potential gender
biases, such as classifying audio clips with a happier pitch as angry or happy, while women
speak at higher frequency domains than men. Thus, we have a total of five models: two for
age, two for emotion, and one for gender.
To impute age and tones for each gender, we must first classify the speaker’s gender.
While an inaccurate gender classifier might compound errors in downstream analysis, luckily,
gender classification is a relatively easy task, and we achieve near perfect accuracy in our
validation data. We feed our five-second audio clips into the gender classifier and classify
a speaker’s gender by taking the mode of predictions for all the audio clips spoken by the
speaker. Based on gender predictions, we then feed the audio clips into respective gender-
specific models to impute the probability distribution over the emotions, as well as the age,
which is continuous.
To ensure our predictions are robust, we cross-validate our model and split our datasets
into five folds of training and validation data. We then train a separate set of models for
each fold of the train/validation “splits.” At inference, we take the average of the predictions
generated by each of the five folds. To summarize, we first predict gender using the average
prediction from all five folds of the train/validation splits. We then apply gender-specific
models for tone and age for all five folds and average the prediction labels. Table 2 shows
16the accuracy and performance results averaged across all five folds of the models.
2.3 Additional Pre-Processing
In the 2022 NBER SI, there are three types of presentations: presentation with discussants,
regular seminar format presentations, and lightning round presentations. Since our goal is
to capture how gender impacts interactions in economics seminars, we drop all lightning
round presentations. We also drop all presentations that have multiple presenters because
there are too few presentations of this type that it could have been possible for someone
to identify the presentation. We group the presentations into two fields: macroeconomics
and microeconomics (henceforth, macro and micro). We choose not to include finance as a
separate field due to identifiability concerns and instead manually group the finance sessions
into micro and macro sessions. Table 1 documents how we group the programs. The resulting
dataset includes a total of 479 presentations, 234 of which are micro presentations.13
3 Empirical Analysis
Our empirical analysis has five steps. We first look at the representation of male and fe-
male economists as presenters, discussants, and audience members based on our imputed
gender variable. Then, we examine the cross-section of tones across speakers and analyze
how speaker characteristics and the field and seminar format impact how happy or sad the
speakers sound. We next look at the within-speaker dynamic and document the transition
and persistence of tones, and then look at the number of interruptions in a presentation.
Last, we examine the between-speaker interaction dynamics by looking at the impact of the
previous speaker’s tone on the current speaker and how this impact systematically differs
across speaker types, fields, and seminar types.
13
Sessions that are on the 2022 NBER SI program but are not on our list included participants who opted
out of having their session recorded.
17We conduct our analysis at three levels of aggregations, which stem from our data-
processing procedures. Through our processing, we split presentations into uninterrupted
speech segments, which we call “utterances.” Utterances are uniquely identified by the order
in which they appear in the presentations, and each one is assigned a speaker ID. They
vary in time—an utterance can be a 20-minute uninterrupted presentation or a “thank
you” statement that lasts for a few seconds. Since our models are trained on audio clips
three to five seconds long, we match the time duration during our imputation by splitting
all utterances into five-second splits. We generate labels for speaker- and utterance-level
observations by taking the average of the labels imputed at the five-second level across all
splits within the utterance or spoken by the speaker. Each level of aggregation comes with its
advantages and disadvantages, and we dive into the details when we go over the regressions.
3.1 Gender Representation
Overall, we find that about 60 percent of presenters are male and 40 percent are female.
When we break this down by field, the gender split in macro is almost equal—55 percent
male and 45 percent female— while the split in micro favors men—66 percent male and 33
percent female. Overall, the NBER speaker female share is larger than the female share by
rank for tenure-track positions documented in Chari and Goldsmith-Pinkham (2017), which
is below 30 percent for all economics departments and is even lower for top departments.
This finding suggests the program organizer put in effort to promote inclusion and equal
representation in the economics profession. Table 3 summarizes the distribution of gender
at the NBER SI.
Despite the increased number of female presenters, we still see segmentation of discussants
and audience members. Figure 1 documents the gender share of participants by presenter
gender and field. When the presenter is male, 70–80 percent of the discussants and audience
members who speak are men. In contrast, there is a higher fraction of female discussants
and female audience members who speak when there is a female presenter.
18When we remove presentations where only one gender speaks, we find that the share
of female-speaking audience members remains the same for macro talks but the gap for
micro talks disappears. This indicates that there is likely more unequal selection into micro
sub-fields by gender than in macro. Due to privacy concerns, we do not keep track of
sub-fields or individual session effects. To proxy for female-dominated sub-fields, we look
at the distribution of the female share of speakers over all of the NBER SI. We then flag
presentations with female shares over the 75th percentile as belonging to a female-dominant
talk.14 Table 4 shows the regression results with speaking audience members’ gender in
macro and micro talks as the dependent variable. Even when controlling for the female-
dominant talk, we still find an increased probability of a speaking audience member being
female if there is a female presenter.
Furthermore, the share of audience members and discussants of the presenter’s own gen-
der is still higher for male presenters than for female presenters for both fields. This likely
reflects that there are still more men in the economics profession than women. It is worth
noting that our approach relies on measuring audience participation by those who speak.
It is possible that presentation attendance with those who did not speak could be more
balanced or imbalanced than what we find.
3.2 Cross-Sectional Tone Analysis
Our measure of tone is imputed from the raw audio data and our trained neural network al-
gorithm. For each five-second interval, we have a probability distribution over six tones: sad,
angry, neutral, happy, disgusted, and fearful. The summary statistics of these probabilities
are described in Table 5. We view these as likelihoods of tone. Alternatively, one can con-
sider these probabilities as the intensity measures of each tone. We use both interpretations
in our discussion interchangeably.
We analyze how the cross-section of tones depends on speaker characteristics and field
14
The 75th percentile is a presentation where over 66 percent of the speakers are female. In later tone
regressions, we add female share as a control.
19and seminar types. Our underlying relationship of interest is
Tit = βf f i + βa ai + βm mi + βr ri + βs sϵit , (1)
where T denotes tone, f the female indicator, a the age, m the macro field indicator, s
the share of female speakers in the presentation, and r the regular seminar format indicator.
Note that we include the female share to control for the possible selection effects that certain
sub-fields have more women in general. Additionally, i denotes speaker-level characteristics,
and t denotes observation at the five-second level. We assume ϵit to be i.i.d with mean zero.
Our machine learning models provide unbiased estimates fˆi , T̂ti , and âi , where
fˆi = f i + ϵfi ,
âi = ai + ϵf ai ,
T̂ti = Tti + ϵf Tit .
We assume E[ϵfi ] = E[ϵf ai ] = E[ϵf Tit ] = 0. Note that we include f , which is the female indi-
cator in the error terms for âi and T̂ti , since the gender-specific models we use to predict tone
and age depend on predictions from the gender classifier. We can rewrite our relationship of
interest as
T̂ti =βf fˆi + βa âi + βm mi + βr ri − βf ϵfi − βa ϵf ai + ϵf Tit + ϵit . (2)
Here, a natural concern is that the error terms in âi and T̂ti are correlated with ϵf i . However,
as mentioned earlier, the gender classification model has a near 100 percent accuracy, and we
assume that fˆi = f i , meaning that ϵf i = 0 is uncorrelated with ϵf ai and ϵf T it . Additionally,
we assume ϵf ai and ϵf T it are independent, which guarantees consistent and unbiased estimates
of the βs. Note that we can generalize this to the utterance level and the speaker level, as
utterance- and speaker-level tone labels are averages of the five-second-level tone labels.
20Table 6 documents the estimation results for Equation 2 that illustrate how presenter
tones depend on presenter characteristics at the speaker level. It shows that female presenters
are on average 11 percentage points more likely to sound happy. Interestingly, presenters who
sound older are 2 percentage points less likely to sound happy. Note that we standardize ages
by gender, so the coefficients capture the correlation between a speaker’s tones and how many
standard deviations away they sound compared to the mean of their gender. In addition,
presenters are 7.8 percentage points more likely to sound angry in regular seminars and are
7.5 percentage points less likely to sound angry in macro seminars. This set of findings
reflects systematic differences in presentation styles across gender, age, field, and seminar
formats. For example, female presenters need to sound happier when communicating their
research, and presenters sound more serious when they are in regular seminars, which are
usually associated with more questions and back-and-forths.
Table 7 records the impact of audience characteristics on audience tones. Similar to
speaker tones, female audience members are 10.9 percentage points more likely to sound
happy. This indicates that female audience members can be more supportive and encouraging
to the presenters. Age now has an opposite effect on how likely the speaker is to sound happy:
economists that are one standard deviation older than the mean age for their gender are 0.9
percentage points more likely to sound happy. Audience members in macro seminars are
5.4 percentage points less likely to sound happy than audience members in micro seminars.
Interestingly, the share of female speakers in the presentations has a negative coefficient on
Happy, suggesting a strange phenomenon that in environments where more speakers are
female, audience members are less likely to sound happy.
Table 8 looks at how split-level cross-sectional tones depend on speaker, presentation
characteristics, and tones at the last split. We find that our previous results at the speaker
level remain qualitatively robust, as F emale still remains a statistically predictor for happy
tones. However, we also find that tones are persistent and explain a nontrivial fraction of
the variability we observe in the data. We formally investigate how tones transition in the
21next section.
3.3 Within-Speaker Tone Dynamics
In examining the within-speaker dynamics of tones, we are interested in learning about how
persistent the tones are and how they transition. We estimate a tone transition matrix for
speakers of different genders by regressing current tone as a function of previous tones by
estimating the following relationship:
Ttf i = βTtrans Tt−1
fi
+ ϵit , for f = 0 and 1,
which can be rewritten as
T̂tf i = βTtrans T̂t−1
fi
+ ϵit + ϵf T it − βTtrans ϵf T i,t−1 , for f = 0 and 1, (3)
where T denotes the vector of probability distribution of tones and βTtrans the vector of
corresponding transition probabilities. In practice, we drop one tone to avoid perfect multi-
colinearity since the distribution of tones sums up to one.
Table 9 and Table 10 document the gender-specific emotion transition matrix by esti-
mating Equation 3 with OLS. Angry, sad, and fearful seem to be more persistent for male
speakers and happy and neutral for female speakers. Additionally, female speakers have a
higher probability of switching from angry to happy, which suggests that they adjust more
positively from angry tones. As we can see, lagged tones are powerful tone predictors,
achieving R2 s ranging from 0.3 to 0.8.
3.4 Audience Interruptions
In this subsection we discuss patterns of interruptions to quantify how audiences interact
with male versus female presenters. We examine three aspects of interruptions: the timing,
22the duration, and the number of interruptions. Here, interruptions can be either prompted
or unprompted and thus cover the general category of audience comments and questions.
To focus on interruptions directed toward the presenter, we do not count any audience
interruptions that occur during discussions.
When we look at when interruptions happen, we find that the difference in timing is larger
across seminar formats than across fields and genders. That is, we see that interruptions
are more likely to occur near the end for presentations with discussants compared to more
evenly throughout a presentation in a regular seminar format.
The first two columns of Table 11 formalize this idea by showing that the first position
of interruptions are much earlier for macro seminars with regular format, and the average
position of interruptions are earlier for regular seminars and even earlier for regular macro
seminars. Although the regressions suggest that interruptions tend to occur later in sessions
with female presenters, this effect is not statistically significant.
The third column of Table 11 examines how the time share of audience utterances depend
on field, format, and speaker gender. We find that, on average, audience utterances account
for 22 percent of the total duration of utterances by presenters and all audience members.
This ratio is lower for presentations with discussants since sessions with discussions usually
have a shorter presentation by the presenter. Here, we see that female presenters are likely
to encounter a larger share of audience interruption. The coefficient for F emale is significant
at the 10 percent level.
We now turn to the number of interruptions. For discussion seminars, we count the
total number of interjections before the discussants speak. We also count the total number
of questions and comments given by audience members for both the discussion and the
regular seminars during the entire presentation. Table 12 shows the regression results for
the two measures of interruptions for both seminar formats. The first column shows there
are, on average, around two interruptions for micro seminars with discussants and four
for macro seminars before the discussant speaks. The second column shows there are an
23average of around 11 total interruptions for seminars with discussants, but the number of
total interruption does not vary across fields and the presenter’s gender. The third column
shows that, for macro seminars with a regular format, there are, on average, 8 more questions
or comments. Interestingly, none of the coefficients on F emale are statistically significant,
suggesting that field and seminar formats have more impact on the number of questions or
comments compared to the presenter’s gender.
3.5 Between-Speaker Tone Dynamics
We now turn to how speakers of varying characteristics interact. In this section, we analyze
how different type of speakers interact with each other and how these interactions depend on
speaker types, genders, and seminar types. In addition, we identify audience interruptions
that shift presenter tones, and we characterize the conditions under which more positive and
negative tone shifts are present.
We are interested in the different interactions speakers of different roles have across dif-
ferent seminar types. In particular, for speaker i and j, where i, j ∈ {Presenter, Discussant,
Audience}, we estimate the following:
T̂ti = βf fˆi + βa âi + βf−1 fˆj + βa−1 âj + βm mi + β̂T−1 T̂t−1
j
+ ηti . (4)
In words, we are interested in estimating how the tone of speaker i at time t depends on
speaker i’s characteristics, session characteristics, the previous speaker j’s characteristics,
and the tones of speaker j at time t − 1.
Table 13 and Table 14 estimate a specific case of Equation 4 by looking at how speaker
happy tones depend on characteristics of the current and the previous speakers for different
seminar types. In each table, each column examines a particular type of interaction i − j,
in which i is the role of the current period speaker and j is the role of the previous period
speaker. For example, the column “Presenter-Audience” in Table 13 is the same as estimating
24Equation 4 by setting i = Presenter and j = Audience. Additionally, we only consider cases
where t is the first five seconds of speaker i’s utterance and t − 1 is the last five seconds
of speaker j’s utterance. In other words, we are only focusing on the short ten-second
windows in which speakers switch. Our results are robust to changing the time window of
consideration to the entire utterance.
Across specifications, female presenters and audiences are 10 to 47 percentage points
more likely to sound happy, which reaffirms our previous results in Table 6 and Table 7.
We also see a consistently negative coefficient for F emale prev, which indicates that the
current speaker is less likely to respond happily when the previous speaker is female. This
effect is statistically significant and quantitatively large, suggesting there could be certain
biases when responses toward the previous speaker could be systematically different and
dependent on their gender. Somewhat surprisingly, in the “presenter-audience” regression
results in Table 13 and Table 14, the coefficient for the interaction between F emale and
F emale prev is negative, significant, and sizable, suggesting that female presenters are 7 to
12 percentage points less likely to respond in a happy tone to female audience members.
One possible explanation is that female audience members are more critical toward female
presenters.
Furthermore, we want to investigate under what circumstances the presenters experience
large swings in their tones. To do this, we identify extreme tone shifts by looking at con-
secutive utterances following a “presenter-audience-presenter” pattern. This enables us to
compute the change in tone for the presenter, which could be due to either random fluctu-
ations or audience interruptions. We then take the top and the bottom deciles of the tone
shifts, ranked by ∆T̂ i = T̂t+1
i i
− T̂t−1 , where i = presenter, across all presentations. We count
the number of top positive and negative tone shifts that each presenter encounters. We then
relate the number of extreme tone shifts to speaker and session characteristics, through the
25following regression:
Count of Extreme Tone Shifts = βf fˆi + βa âi + βE E i + βs ŝi + η, (5)
where i = presenter and s denotes the female share in the presentation that presenter i
presents in. Specifically, we consider extreme positive tone shifts and negative ton shifts
separately.
Table 15 estimates Equation 5 by looking at changes in the the probability of sounding
happy. We want to focus on the shift in presenter tones that can possibly be attributed to
audience member interruptions due to the timing of the event window. Thus, we compute
∆Happy i by subtracting the Happy probability at the last minute of a presenter’s first ut-
terance by their Happy probability at the first minute of their second utterance. Otherwise,
since presenter utterances can be long, especially if they are in the middle of giving a presen-
tation, computing ∆Happy i using whole utterances might dampen the effects the audience
interruption has, although, as we show in the appendix, our results are robust to using whole
utterances instead.
We find that presenters in macro are likely to experience more large positive and negative
swings in how likely they are to sound happy, with a slightly larger coefficient for the number
of most negative tone shifts. Additionally, female presenters tend to experience more large
positive shifts in the likelihood of their happy tone. The reason for this might be either that
female presenters are greeted with more encouragement or that they tend to respond more
happily when interacting with audience members.
We also investigate how the fraction of interruptions that dramatically shift the presen-
ter’s tone depends on speaker and session characteristics. The results are summarized in
Table 16. This controls for the fact that macro seminars are slightly longer and are more
likely to have more interruptions for the same time period. Nevertheless, we still find macro
presentations have more interruptions that cause the presenter to increase or decrease their
26probability of sounding happy drastically. That is, a macro talk relative to a micro talk
will have 1.3 percentage points more extreme positive shifts and 2.9 percentage points more
extreme negative shifts. However, when looking at the fraction of interruptions that are ex-
treme tone shifts, we now find female presenters being more likely to have extreme negative
tone shifts in addition to extreme positives shifts.
4 Discussion on Audio Analysis in Economics
In this section we discuss our recommendations for other researchers looking to perform
automated audio analysis. In our paper, one of the key methodological approaches is to
use gender-specific neural networks. Gender bias has been widely observed across areas of
machine learning. For example, in generating word embedding, which is a popular method of
representing text as numerical vectors, algorithms often learn to pick up gender stereotypes,
such as associating homemakers with women (Bolukbasi et al., 2016). In speech emotion
recognition, models often predict male emotions with higher accuracy, which can be due to
imbalances in the training data as well as possible systematic differences in male and female
voices (Gorrostieta et al., 2019).
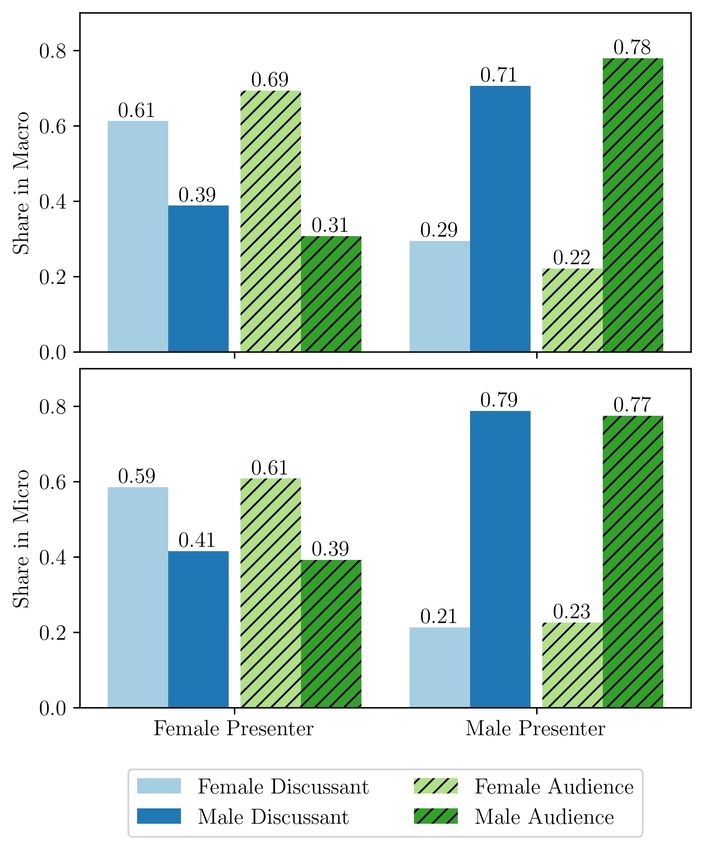
We suggest that using gender-specific neural networks is a suitable way of mitigating such
gender bias. To illustrate how male and female voices systematically differ, Figure 2 shows
the confusion matrix of utterances by female speakers in CREMA-D and RAVDESS on a
model that is trained on male-only utterances in the same dataset. The figure shows that,
even controlling for the same data quality, models trained on male-only data exhibit system-
atic misclassification patterns when applied to female audio clips. Specifically, the male-only
model overwhelmingly predicts “angry,” “happy,” and “disgust” for female speakers. Such
differences can be due to difference in pitches and amplitudes in male- and female-speaking
patterns. For comparison, Figure 3 shows the confusion matrix for a model trained on
female-only data, evaluated on the validation set, which the model has never seen before.
27You can also read