Defined chromosome structure in the genome-reduced bacterium Mycoplasma pneumoniae
←
→
Page content transcription
If your browser does not render page correctly, please read the page content below
ARTICLE
Received 4 Nov 2016 | Accepted 20 Jan 2017 | Published 8 Mar 2017                        DOI: 10.1038/ncomms14665             OPEN

Defined chromosome structure in the genome-
reduced bacterium Mycoplasma pneumoniae
Marie Trussart1,2, Eva Yus1,2, Sira Martinez1, Davide Baù3,4, Yuhei O. Tahara5,6, Thomas Pengo1,7,
Michael Widjaja8, Simon Kretschmer9, Jim Swoger1,2, Steven Djordjevic8, Lynne Turnbull8, Cynthia Whitchurch8,
Makoto Miyata5,6, Marc A. Marti-Renom2,3,4,10, Maria Lluch-Senar1,2 & Luı́s Serrano1,2,10

DNA-binding proteins are central regulators of chromosome organization; however, in
genome-reduced bacteria their diversity is largely diminished. Whether the chromosomes of
such bacteria adopt defined three-dimensional structures remains unexplored. Here
we combine Hi-C and super-resolution microscopy to determine the structure of the
Mycoplasma pneumoniae chromosome at a 10 kb resolution. We find a defined structure,
with a global symmetry between two arms that connect opposite poles, one bearing the
chromosomal Ori and the other the midpoint. Analysis of local structures at a 3 kb resolution
indicates that the chromosome is organized into domains ranging from 15 to 33 kb. We
provide evidence that genes within the same domain tend to be co-regulated, suggesting
that chromosome organization influences transcriptional regulation, and that supercoiling
regulates local organization. This study extends the current understanding of bacterial
genome organization and demonstrates that a defined chromosomal structure is a universal
feature of living systems.

1 EMBL/CRG     Systems Biology Research Unit, Centre for Genomic Regulation (CRG), The Barcelona Institute of Science and Technology, Dr Aiguader 88,
Barcelona 08003, Spain. 2 Universitat Pompeu Fabra (UPF), 08003 Barcelona, Spain. 3 Gene Regulation, Stem Cells and Cancer Program. Centre for Genomic
Regulation (CRG), The Barcelona Institute of Science and Technology, Dr Aiguader 88, Barcelona 08003, Spain. 4 CNAG-CRG, Centre for Genomic
Regulation (CRG), The Barcelona Institute of Science and Technology, Baldiri Reixac 4, Barcelona 08028, Spain. 5 Department of Biology, Graduate School of
Science, Osaka City University, 558-8585 Osaka, Japan. 6 OCU Advanced Research Institute for Natural Science and Technology (OCARNA), Osaka City
University, 558-8585 Osaka, Japan. 7 Advanced Light Microscopy Unit, Centre for Genomic Regulation (CRG), 08003 Barcelona, Spain. 8 The ithree
Institute, The University of Technology Sydney, Sydney, New South Wales 2007, Australia. 9 Department of Cellular and Molecular Biophysics, Max Planck
Institute of Biochemistry, 82152, Martinsried, Germany. 10 Institució Catalana de Recerca i Estudis Avanc¸ats (ICREA), 08010 Barcelona, Spain.
Correspondence and requests for materials should be addressed to M.A.M.-R. (email: martirenom@cnag.crg.eu) or to M.L.-S. (email: maria.lluch@crg.eu) or
to L.S. (email: luis.serrano@crg.eu).

NATURE COMMUNICATIONS | 8:14665 | DOI: 10.1038/ncomms14665 | www.nature.com/naturecommunications                                                        1
ARTICLE                                                                              NATURE COMMUNICATIONS | DOI: 10.1038/ncomms14665

S
       everal studies have revealed novel insights into chromatin        studied the chromosome organization of the genome-reduced
       dynamics and its effect on gene expression regulation             bacterium, Mycoplasma pneumoniae, which has minimal
       and replication1,2. Such interplay suggests that chromatin        genetic components and lacks several structural DNA-binding
organization might have a role in regulating gene expression             proteins29. It has been shown that changes in DNA supercoiling
at both the global and gene-specific levels3. In all kingdoms of life,    can control transcription in bacteria30, and in fact, this
genome organization occurs in a functional and dynamic manner,           could be more important in small-genome bacteria such as
packing the genome into the nucleus in the case of eukaryotes,           Mycoplasmas31 where, despite the absence of many structural
while packing it into the cell in the case of bacteria. Bacteria have    DNA-binding proteins29, both gyrases and topoisomerases are
evolved mechanisms such as DNA supercoiling4 and nucleoid-               present to control gene expression through changing the local
associated proteins (NAPs) mediated folding5 to condense their           DNA structure31. M. pneumoniae is one of the smallest
chromosomes. Negative supercoiling forms plectonemic loops of            self-replicating organisms32, has no cell wall, and causes
10–100 kilobases (kb)6,7, which are maintained by both gyrases           atypical pneumonia in humans33. It possesses an attachment
and topoisomerases6. Simultaneously, DNA-based processes such            organelle (AO) located at one of the cell poles that is involved
as transcription, replication and repair are all efficiently              in adherence, motility and cell division34. M. pneumoniae has
accommodated.                                                            only a few known NAPs, and the total copy number for the
   In the past, diffraction-limited resolution has impaired the          remaining proteins is smaller compared with other bacteria
detailed characterization of chromosome structures. However,             (Table 1 and Supplementary Data 1): MPN529, IHF-HU that
more recent developments in super-resolution localization                possibly affects DNA topology35; MPN426, an SMC family
microscopy8–12 and chromosome conformation capture                       protein; MPN229 and MPN554, proteins that bind single-
(3C)-based techniques13 have enabled the determination of                stranded DNA (ssDNA)36,37; and MPN002 a possible
the global chromosome organization of some bacteria14. High-             homologue of CbpA. It also has very few TFs and only two
throughput derivations of genome-wide 3C-based assays such as            sigma factors are found within its genome (Table 1)38. In
Hi-C technologies15 have been used to generate high-resolution           addition, M. pneumoniae has been systematically characterized in
contact maps of genomes, which when combined with modelling,             a quantitative manner by transcriptomics, proteomics and
can provide three-dimensional (3D) representations of genome             metabolomics studies39–44.
structures16–19. Studies of bacterial chromosome organization               Here, we used Hi-C to determine the 3D structure of the
and regulation using these afore mentioned combinatorial                 stationary M. pneumoniae chromosome at a 10 kb resolution,
techniques have been carried out in Caulobacter crescentus,              with local structures further resolved at 3 kb. This model is
resulting in a Hi-C map with a 13 kb resolution17, in Escherichia        validated by electron microscopy, 3D light microscopy recon-
coli with a 20 kb resolution20, and in Bacillus subtilis with            struction of the nucleoid, and super-resolution microscopy of
30, 10 and 4 kb resolutions21–23. These studies show that                exponential and stationary cells. We observed a general symmetry
for C. crescentus the genome structure is globally related to the        along the axis of the origin (Ori) and the midpoint of the
chromosome segregation process, while for E. coli it is more             chromosome. The Ori and the midpoint are located at the two
related to DNA replication and transcription. More recently,             opposite poles of the chromosome structure. Moreover we
a higher 10 kb resolution Hi-C map of C. crescentus18 revealed           detected that the chromosome is organized into 44 CIDs, ranging
that its genome is divided into 23 chromosome interacting                from 15 to 33 kb, which are smaller than the CIDs previously
domains (CIDs) or highly self-interacting regions, similar to the        described for C. crescentus18 and B. subtilis22,23. Inhibiting
topologically associating domains (TADs) found in                        supercoiling induced a decrease in the domain border strengths,
eukaryotes24,25. The size of these CIDs range from 30 to 400 kb          suggesting that supercoiling might play a role in the regulation of
in C. crescentus18, and from 50 to 300 kb (ref. 22) or 60 to 340 kb      these domains. Interestingly, we provide the first evidence that
(ref. 23) in B. subtilis, depending on the study.                        genes inside CIDs tend to be co-regulated, suggesting that
   Nonetheless, in C. crescentus, the strongest determinant of           chromosome organization could influence transcriptional
these domain boundaries was the presence of highly expressed             regulation. Our results, together with previous 3D structures
genes, whereas surprisingly the absence of the NAP heat                  of other bacterial chromosomes and data on eukaryotes, indicate
unstable (HU) histone-like proteins and structural maintenance           that chromosome organization in cells is a widespread
of chromosomes (SMC) proteins did not significantly affect the            phenomenon of life.
domain boundaries18. No such domains were described in
the lower resolution Hi-C map of E. coli. Nevertheless, it was
found that histone-like proteins such as factor for inversion            Results
simulation (Fis), integration host factor (IHF) and histone-like         From M. pneumoniae Hi-C maps to 3D chromatin structure.
nucleoid structuring (H-NS) do not contribute to the global              Here, we studied the M. pneumoniae genome organization during
organization of the E. coli genome20. Additionally, on a larger          stationary phase, performing Hi-C using four-cutter, HpaII, and
scale, it has been shown that the E. coli genome consists of four        six-cutter, HindIII, enzymes with average cutting frequencies of
macrodomain-like regions of about 1 megabase (Mb) each,                  450 and 1,810 base pairs (bp), respectively. Hi-C experiments
and two less constrained regions, all of which influence the              generate genome-wide libraries of ligation products, in which
segregation and mobility of the chromosome26.                            genomic loci that are positioned close in space contact frequently,
   The above mentioned bacteria all have large, complex genomes          and loci located far away rarely interact. Spatial distances
over 4 Mb in size, coding for hundreds of transcription factors          can then be inferred from genomic loci frequencies to reflect
(TFs)27, multiple DNA structural proteins and several sigma              the 3D structure of the genome. Although the Hi-C interaction
factors, each of which play key roles in the response to                 maps obtained at exponential and stationary phase display similar
physiological and environmental signals28. How such structural           features (Supplementary Fig. 6), the analysis of the exponential
organization is achieved and the impact that it has on                   phase data alluded to possible chromosome heterogeneity.
transcriptional regulation is unknown. Furthermore, whether              Therefore, as it is not possible to synchronize M. pneumoniae,
smaller bacteria with reduced genomes and reduced total copy             we concentrated on the stationary phase samples for 3D model-
numbers of structural proteins maintain a defined chromosome              ling. To analyse the Hi-C data sets, the paired-end library reads
structure is also undetermined. To address this question, we             were first uniquely mapped to the MPN129 reference genome

2                                                   NATURE COMMUNICATIONS | 8:14665 | DOI: 10.1038/ncomms14665 | www.nature.com/naturecommunications
NATURE COMMUNICATIONS | DOI: 10.1038/ncomms14665 ARTICLE
Table 1 | List of assigned transcription factors, sigma factors and structural proteins and essentiality with three distinct
categories: essential (E), non-essential (NE) and fitness (F).
Gene number Gene name Protein name Essentiality44
MPN002 cbpA Curved DNA-binding protein CbpA F
MPN003 gyrB DNA gyrase subunit B E
MPN004 gyrA DNA gyrase subunit A E
MPN122 parB DNA topoisomerase 4 subunit B E
MPN123 parC DNA topoisomerase 4 subunit A E
MPN124 hrcA Heat-inducible transcription repressor hrcA E
MPN229 ssbA SSB-binding ssDNA E
MPN239 gntR Probable HTH-type transcriptional regulator gntR E
MPN241 whiA Transcription factor with WhiA C-terminal domain F
MPN266 spxA Transcriptional regulator Spx E
MPN275 ybaB DNA-binding protein, YbaB/EbfC family F
MPN294 araC AraC-like transcriptional regulator NE
MPN332 lon ATP-dependent protease La (EC 3.4.21.53) E
MPN352 sigA RNA polymerase sigma factor rpoD (Sigma-A) (EC 2.7.7.6) E
MPN424 ylxM Putative helix-turn-helix protein, YlxM/p13-like protein NE
MPN426 smc SMC family, chromosome/DNA binding/protecting functions E
MPN478 yrbC YebC family protein (transcription factor of the tetR family) E
MPN529 ihf Histone-like bacterial DNA-binding protein F
MPN554 ssbB Putative single-stranded DNA-binding protein E
MPN572 pepA Probable cytosol aminopeptidase (EC 3.4.11.1) (leucine aminopeptidase) (LAP) E
MPN608 phoU Transcriptional regulator involved in phosphate transport system E
MPN626 mpn626 Alternative sigma factor NE
MPN686 dnaA Chromosomal replication initiator protein dnaA E
E, essential; F, fitness; LAP, leucine aminopeptidase; NE, non-essential; ssDNA, single-stranded DNA44.
a b Ori
Ori
800,000 1
5,000
750,000
10,000
700,000
12.90 15,000
650,000
Log2 Hi-C normalized interaction counts
Mycoplasma pneumoniae
816,394 bp 20,000
600,000
12.75 550,000
25,000
300,000
500,000
450,000 350,000
400,000
12.60
Midpoint
Midpoint
12.45 c Ori
12.30
12.15
12.00
Ori
Ori Midpoint Ori
Midpoint
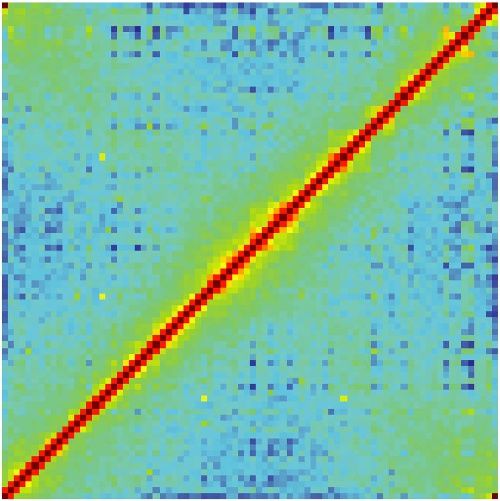
Figure 1 | Hi-C matrix and 3D models of the M. pneumoniae chromosome reveal a global symmetry with Ori and midpoint located at the two opposite
poles. (a) Normalized HpaII Hi-C contact map of M. pneumoniae, in stationary phase at a 10 kb resolution. The frequency of interactions between a given
pair of bins is found at the intersection of the row and column corresponding to those bins. The colour of the contact map, from blue to red, indicates the
log2 contact frequency. The bar underneath indicates position along the genome, with Ori being located at a genome coordinate of 0 and midpoint located
at B 400 kb. (b) Simplified genomic map showing the gene distribution across the chromosome, with black lines delimitating the genes. The colour
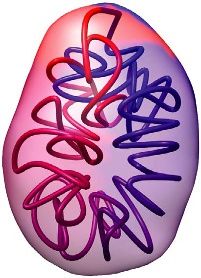
indicates the strand position, with pink being the strand and green the þ strand. (c) A 3D density map representation of the 516 superimposed
model structures from the first cluster of M. pneumoniae genome models. A central model, referred to as the centroid, is the model that is closest to the
mean x,y,z coordinates of all the other models. This centroid is shown as a coloured tube starting with particle 1 in blue and ending with particle 82 in red,
and uses the same colour code as the bar in a. The Ori and midpoint particles are highlighted with red and purple circles, respectively. The lighter colour
represents the space occupied by all the models in the cluster, that is, the variability across the cluster.
(NC_000912, NCBI) covering 816,394 bp. This was done using hiclib Python45 (Methods). Briefly, read pairs were classified as
Bowtie2, and further filtered and normalized as previously valid Hi-C products, non-ligation products, or self-ligation
described following the ICE iterative mapping strategy from the products, and only the valid Hi-C products were considered.
NATURE COMMUNICATIONS | 8:14665 | DOI: 10.1038/ncomms14665 | www.nature.com/naturecommunications 3ARTICLE NATURE COMMUNICATIONS | DOI: 10.1038/ncomms14665
We then constructed a genome wide matrix, M, of different built by an optimization protocol, where the loci were initially
resolutions (3, 5, 10, 15 and 20 kb) by dividing the genome into 3, placed randomly in 3D space and their positions were modified
5, 10, 15 and 20 kb bins respectively, and pooling interactions into iteratively using simulated annealing and Monte-Carlo sampling
their corresponding bins. The final interaction frequencies were to satisfy as many restraints as possible. Finally, we selected
represented as two-dimensional matrices, where M(i,j) indicates the 1,000 models having the least penalty for not satisfying the
the relative frequency of interaction between fragments in imposed restraints and clustered them based on their structural
bins i and j. similarity. We found two main clusters corresponding to mirror
The decision to use the resolution of 10 kb was determined based images of each other, one containing 516 models and the
on the correlation between 7 replicates at 3, 5, 10, 15 and 20 kb other 484 models. To represent the M. pneumoniae chromosome
resolutions (Supplementary Figs 1 and 2), as well as on structure model, we created 3D density maps in which
the matrix modelling potential (MMP) score of the resulting the volume occupied by each fragment indicates the variability
matrices (Supplementary Fig. 3 and Supplementary Table 1). The in the fragment’s positioning across the models within the
MMP score assesses the potential of an interaction matrix to cluster (Fig. 1c). This variability is homogeneous along the
determine accurate 3D models. At a 10 kb resolution, both the entire chromosome. Similar to what was observed for the
HindIII and HpaII data sets resulted in MMP scores ranging 3D organization of the C. crescentus genome17,18, our circular
from 0.71 to 0.74, with a maximum predicted model accuracy of chromosome has a global symmetry between the two
0.70 (0.58–0.81 at 95% confidence interval). In addition, the chromosomal arms that connect the Ori and the midpoint. The
matrices were highly reproducible between the five HpaII biological Ori and midpoint are located at the two opposite poles of the
replicates (r40.91, P valueo0.0001 Pearson’s correlation structure (Fig. 1c and Supplementary Movie 1).
coefficient; Supplementary Fig. 1) as well as between HindIII
and HpaII data sets (r40.81, P valueo0.0001 Pearson’s
Validation of chromosome dimensions by DAPI and EM imaging.
correlation coefficient; Supplementary Fig. 2). Even though no
To ensure that the predicted dimensions and volumes of the
significant differences were found between the two enzymes,
chromosome models fit within the M. pneumoniae cell, we
we decided to use the HpaII interaction matrix (computed as
examined cells by transmission electron microscopy (TEM)
the sum of the five HpaII replicates at a 10 kb resolution,
using the quick-freeze deep-etch replica method49 (Fig. 2c).
normalized by their respective number of reads) for modelling
We acquired tilted TEM images of cells and created
and subsequent analysis since the HpaII enzyme has a higher
a 3D reconstruction (Supplementary Movie 2). Although
cutting frequency.
technical limitations did not allow for a 3D reconstruction of
The resulting Hi-C interaction map has two diagonals
the whole cell, we were still able to detect a rotational symmetry
intersecting near the centre of the genome, hereafter referred
along the long cell axis, thereby allowing us to estimate the cell
to as the midpoint of the chromosome (at B400 kb; Fig. 1a).
volume. In stationary phase, the median cell volume estimated
The location of the Ori was predicted based on the position
from the TEM images is 0.075 mm3 (standard deviation,
of the DnaA boxes46, and validated by ChIP-seq experiments
s.d. of 0.03 mm3).
(Yus et al., manuscript in preparation); however, the exact
Also, chromosome dimensions were measured by
localization of the terminus of replication (Ter) has not yet
DNA staining of fixed cells using 40 6-diamidino-2-phenylindole
been experimentally determined in this bacterium. Since in
(DAPI) (Fig. 2a). As previously shown, M. pneumoniae does not
bacteria the Ter is generally located opposite to the Ori, we
have a defined nucleoid in its centre but rather the chromosome
predicted it to be at this intersection point, and in fact,
occupies most of the available volume34. We measured a median
two putative structural elements having no transcripts
chromosome length of 775 nm (s.d. of 234 nm) and a median
(380,176–380,637 bp; 410,901–411,097 bp) were found flanking
width of 482 nm (s.d. of 130 nm). This is comparable to median
this region44. The main prominent diagonal, characteristic of Hi-
chromosome length of 874 nm (s.d. of 20 nm) and median width
C maps, results from the local contact of proximal genomic
of 568 nm (s.d. of 2 nm) obtained from the 3D models (Fig. 2b).
regions. The second less prominent diagonal (from the upper left
In addition, using a super resolution fluorescence microscopy
to the lower right corner) reflects both the circularity of the
technique known as 3D-structured illumination microscopy (3D-
genome and the interactions between fragments located on the
SIM)50, we estimated the 3D chromosome volume by DAPI
opposite arm of the chromosome. All together this indicates
staining (Supplementary Movie 3), calculating a mean
that the chromosome has a global symmetry extending from
chromosome volume of 0.049 mm3 (s.d. of 0.03 mm3) (Fig. 2d).
the Ori-midpoint axis within the cell, a feature which is further
The two volumes calculated using microscopy techniques
reflected by the distances of genomic bins to the centre of
(0.075 and 0.049 mm3) are comparable to the chromosome
mass (Supplementary Fig. 4). Interestingly, such symmetry is
volume estimated from the 3D models (0.074 mm3) (Fig. 2d).
also observed in the linear organization of the genome, where
Altogether, these results support our 3D genome model
genes are distributed on opposite strands in both the left and the
by indicating that it fits within the biological dimensions of the
right arms of the chromosome (Fig. 1b).
M. pneumoniae cell.
Ori and midpoint are located at the two poles. To assess Validation of 3D models with fluorescence imaging.
whether the overall symmetry is also reflected in the spatial The orientation of the chromosome within the cell body was
organization of the genome, we built 3D models of the assessed by combining DAPI staining with immunofluorescence of
M. pneumoniae genome based on the filtered and normalized the P1 adhesin protein localized at the AO51. Distances between
10 kb resolution Hi-C matrix. Briefly, based on the hypothesis different genomic regions were determined by super-resolution
that chromatin interaction frequencies are a proxy for spatial localization microscopy on non-dividing cells in both the stationary
proximities between loci15, we used TADbit16,47,48 to convert the and exponential phase of growth (Fig. 3a,b and Supplementary
contact frequencies of genomic loci into spatial distances. Then Fig. 5). We measured distances between fluorescent DNA probes
we searched for the 3D conformations that best satisfied the (Fluorescence in situ hybridization imaging; FISH) mapped to
spatial distances between genomic loci inferred from the the Ori (0–1 kb), right (204 kb–205 kb), midpoint (390 kb–391 kb),
frequencies of our Hi-C matrix. A total of 5,000 models were left (612 kb–613 kb), N1 (99 kb–100 kb), N2 (299 kb–300 kb)
4 NATURE COMMUNICATIONS | 8:14665 | DOI: 10.1038/ncomms14665 | www.nature.com/naturecommunicationsNATURE COMMUNICATIONS | DOI: 10.1038/ncomms14665 ARTICLE
a b 2,000
Next, to assess whether the distances obtained from the
DAPI 3D models were congruent with the distances obtained
Models experimentally, we computed the Euclidian distances between
1,500 midpoint-Ori, midpoint-right, midpoint-left, midpoint-N1,
Distance (nm)
midpoint-N2 and midpoint-N3 given their respective coordinates
in the 3D models. The midpoint-N2 and midpoint-Ori distances
1,000
were, respectively, the smaller and larger estimated median
distances from both the 3D models (386 and 685 nm) and the
500 imaging data (16 and 109 nm; Fig. 3b). Although the distances
estimated from the 3D models are overall larger than the
experimental ones, a Pearson correlation of 0.85 is found between
0
the midpoint-left, midpoint-right, midpoint-N1, midpoint-N2,
midpoint-N3 and midpoint-Ori median distances estimated
h
th
h
th
t
t
ng
id
ng
id
W
W
Le
Le
from both the 3D models and the fluorescence imaging
c d (Fig. 3b). Thus, overall our imaging data qualitatively validate
2×10⁸
our 3D models. We conclude that, as was shown in both
EM B. subtilis and C. crescentus17,52, the folding of the chromosome is
Models
3DsimDAPI
consistent with the linear order of genes along the DNA (Fig. 3c).
2×10⁸
Volume (nm3)
1×10⁸
Genes are co-expressed within chromosome interaction domains.
In Hi-C interaction maps, a significant proportion of the signal
lies in the vicinity of the diagonal where most of the interactions
5×10⁷ occur. We have used this property to further increase the
resolution of our maps to 3 kb bins. Although such maps have
0
low scores for accurate 3D modelling (the MMP score of the
maps at 3 kb was 0.56; Supplementary Fig. 3), they can be used for
Figure 2 | Validation of chromosome dimensions and occupancy by DAPI studying the local organization of chromatin, omitting long-range
staining and EM imaging. (a) A DAPI-stained image showing the interaction data. We used the TADbit program16,47,48 to segment
subcellular localization of DNA in M. pneumoniae. Scale bar, 1 mm. the HpaII matrix (at 3 kb resolution) into 44 CIDs (Fig. 4a,b).
(b) Comparison of the estimated lengths and widths of both the DAPI and Moreover, TADbit assigned a confidence score to each domain
the estimated chromosome models in nanometre. Boxplot distribution and border ranging from 1 to 10, the higher the score, the higher
median values of length (775 nm) and width (482 nm) over 900 cells, here the confidence (Fig. 4a). The CID sizes ranged from 15 to 33 kb,
shown in orange, are estimated from the DAPI images. Boxplot distribution with a median size of 15 kb. This is smaller than those previously
and median values of length (874 nm) and width (568 nm), estimated over found in C. crescentus, which range from 30 to 420 kb (ref. 18).
1,000 chromosome models are shown in blue. (c) Quick-freeze deep-etch Moreover, we performed the alignment of domain borders across
replica TEM imaging of a M. pneumoniae cell. Scale bar, 200 nm. five HpaII replicates and confirmed that domain borders are
(d) Distribution and median volume of a M. pneumoniae cell based on conserved across replicates (P valueo0.0001 randomized
electron microscopy over 25 cells (0.075 mm3; in yellow), on an domains boundaries alignment test; Supplementary Fig. 7). To
estimation over 1,000 chromosome models (0.074 mm3; in blue), and on ensure that the identified domain borders were not artefacts
DAPI-based three-dimensional super-resolution microscopy over 130 cells arising from the location of restriction sites, we calculated the
(0.042 mm3; in orange). number of HpaII sites present in borders. The analysis confirmed
that the domain borders were not significantly enriched
with HpaII sites (permutation test P value ¼ 0.868). We
and N3 (499 kb–500 kb) loci (Supplementary Table 3), in also looked at other properties such as gene localization,
conjunction with immunofluorescence localization of P1 adhesin Clusters of Orthologous Groups function, TFs enrichment,
(Fig. 3a). The midpoint-AO measurements resulted in the smallest termination of genes, and methylation levels, but none were
median separation distance of 183 nm, while the right-AO, left-AO, found to be significantly enriched with the permutation test.
N3-AO and N2-AO distances were larger (258, 252, 200 and Interestingly, GC content was found to change significantly, with
199 nm, respectively). Finally, the Ori-AO and N1-AO distances a lower percentage value being found at the domain borders
had the largest separation, with a median distance of 292 and (permutation test P value ¼ 0.088). In addition, a significant
280 nm, respectively. We repeated some of the measurements number of both convergent (genes pointing towards each
on another localization microscope system (Nikon N-STORM) other in the direction of transcription in the two strands) and
in 3D. As illustrated for the midpoint-AO measurements similar divergent gene pairs (genes pointing in opposite directions of
results were obtained (Supplementary Fig. 9). In addition, we transcription in the two strands) were found at these borders
calculated approximate distances between midpoint-right, (permutation tests P value ¼ 0.026, P value ¼ 0.037, respectively).
midpoint-left, midpoint-N1, midpoint-N2, midpoint-N3 and To assess whether the local organization of the M. pneumoniae
midpoint-Ori by deducting the median midpoint-AO distance genome into CIDs is related to transcriptional regulation,
of 183 nm from their respective distances to the AO (Fig. 3b). we compared the absolute mean co-expression of pairs of
The fact that the Ori-AO measurements have a larger variability genes within and between domains. Interestingly, we found
compared with the others, particularly to the midpoint-AO that genes are significantly co-expressed within domains
measurements, suggests that the Ori is not attached to (t-test P value ¼ 0.0032; Fig. 4c). Specifically, higher mean
the opposite pole of the cell. The similarity between distances absolute co-expression values were observed for genes in 34 out
measured in stationary and exponential phases indicates that of the 44 domains (Fig. 4d). A border permutation test suggested
for non-dividing cells the chromosome structure may not in fact that a low co-expression is found at the border of these
differ (Supplementary Fig. 5). domains (P value ¼ 0.11 permutation t-test). Moreover, these
NATURE COMMUNICATIONS | 8:14665 | DOI: 10.1038/ncomms14665 | www.nature.com/naturecommunications 5ARTICLE NATURE COMMUNICATIONS | DOI: 10.1038/ncomms14665
results also indicate that the higher co-expression levels of genes these correlation trends are not observed when the genes are
within CIDs are not only due to genomic linear proximity located in different CIDs, that is, separated by a CID border.
(Fig. 4e). Indeed, independent of the CID in which the genes The M. pneumoniae transcriptome comprises 671 operons,
are located, proximal genes have higher co-expression than being mostly monocistronic or bicistronic, and 852 suboperons
distant genes53. However, the co-expression is stronger for with a median size of 605 bp and a maximum size of 9,197 bp.
proximal genes (o12 kb apart) when they are located within the In comparison, the domains identified in our study are larger,
same CID, while it is weaker for any proximal genes across the having a median size of 15 kbp. As an illustration of
whole genome (t-test P valueo0.0001; Fig. 4e). Interestingly, the distribution of operons across domains, we plotted the 20
and 14 suboperons found in CID 8 and 9, respectively
(Supplementary Fig. 8). The average number of operons and
a suboperons found within a domain is 15 and 18, respectively. Our
analysis shows that these different operons of the same domain
tend to be more co-regulated than operons between different
domains. Altogether, our results demonstrate that the mean
2,000
co-expression level observed for genes of the same domain is
higher than the mean co-expression level observed for genes
1,500 between domains, revealing that the genome is partitioned into
domains of co-expressed genes.
Distance (nm)
1,000 Inhibiting supercoiling reduces domain borders sharpness. To
study the effect of inhibiting supercoiling on chromosome
structure, we performed Hi-C on cells treated with novobiocin, a
500 drug that inhibits DNA gyrase and DNA negative supercoiling.
The outcome of DNA gyrase inhibition with novobiocin is the
relaxation of the DNA54. The novobiocin-treated cells resulted in
0 Hi-C interaction maps with 42 CIDs (Fig. 5a), ranging from 9 to
30 kb and with a median size of 18 kb (Fig. 5b). When comparing
AO
O
O
AO
AO
AO
AO
-A
r-A
CIDs in novobiocin-treated cells to the control, we found that
ri-
ft-
1-
2-
3-
ht
Te
O
Le
N
N
N
ig
R
15 CIDs were conserved. Interestingly, the TADbit median
b confidence score for the domain borders was five out of
Ori-midpoint 10 compared with 10 for non-treated cells (Fig. 5c). However,
N1-midpoint
Right-midpoint the domain densities, that is the relative number of interactions
N3-midpoint given the domain size (computed as the sum of Hi-C interactions
500
N2-midpoint in a domain divided by their expected interactions), were not
Left-midpoint significantly altered in novobiocin-treated cells (Fig. 5d). Taken
FISH distances (nm)
r =0.85
together, and as reported in C. crescentus18, novobiocin reduces
the sharpness of CID borders, thereby suggesting that
supercoiling may regulate domain formation in bacteria.
0 Discussion
Chromosome conformation capture based experiments
coupled with deep sequencing have been used to explore
bacterial genome organization and its role in transcriptional
regulation17,18,20,21. Here, we have analysed the 3D genome
organization of the M. pneumoniae bacterium, a model organism
0 500 with a small genome size and a simplified gene regulatory
Model distances (nm) network. Compared with other bacteria, M. pneumoniae not only
has considerably less TFs and NAPs, but also the total copy
c number of these proteins is proportionally lower. More
Ori
800 Left specifically, in M. pneumoniae there are only the SMC and
Right
Midpoint Figure 3 | Validation of 3D models with super-resolution imaging.
600 (a, top) FISH imaging with red (Alexa Fluor 568) indicating the genomic
y -coordinates (nm)
probes Ori, right, Midpoint, left, N1, N2 and N3, respectively, and green
(Alexa Fluor 488) representing the P1 adhesin attachment organelle
400 protein. Scale bar, 200 nm. (bottom) Boxplot distribution and median
distances estimated between the genomic probes and AO over B50–70
cells. (b) Ori-midpoint, N1-midpoint, right-midpoint, N2-midpoint,
200 N3-midpoint and left-midpoint estimated distances from chromosome
models in the x axis and experimental FISH imaging in the y axis. Black lines
indicate the variability within the estimated distribution. (c) 2D map
0 representation of the chromosomal models from the first cluster shown in
0 200 400 600 800 blue, with x and y coordinate positions shown in the x axis and y axis,
x -coordinates (nm) respectively. Ori, left, right and midpoint positions across the first cluster of
chromosome models are shown in red, pink, purple and green, respectively.
6 NATURE COMMUNICATIONS | 8:14665 | DOI: 10.1038/ncomms14665 | www.nature.com/naturecommunicationsNATURE COMMUNICATIONS | DOI: 10.1038/ncomms14665 ARTICLE
a 1.5
b
interac. freq.
Hi-C relative
1.0
interac. freq.
Hi-C relative
1.0 1 2 3 4 5
0.5 0.5
0.0 6 7 8 9 10
Ori Ori 0.0
Hi-C matrix
Hi-C matrix
3 kb res.
3 kb res.
c 1.0
d 0.8
Within
0.9
Between 0.7
0.8
Abs. mean co-expresion level
Abs. mean co-expresion level
0.6
0.7
0.5
0.6
0.5 0.4
0.4
0.3
0.3
0.2 Border strength
0.2 10
0.1 7.5
0.1
5
0.0 0.0
0
1
2
3
4
5
6
7
8
9
10
11
12
13
14
15
16
17
18
19
20
21
22
23
24
25
26
27
28
29
30
31
32
33
34
35
36
37
38
39
40
41
42
43
44
45
CID number
e 1.0
0.9
0.8
Abs. mean co-expresion level
0.7
0.6
0.5
0.4
0.3
0.2
0.1
0.0
0 3 6 9 12 15 18 21 24 27 30 0 3 6 9 12 15 18 21 24 27 30 3 6 9 12 15 18 21 24 27 30
Genomic distance (Kb)
Figure 4 | The M. pneumoniae chromosome is partitioned into domains of co-expressed genes. (a) Hi-C HpaII filtered and normalized contact map at
3 kb resolution, rotated 45° with domain density plots. Each domain is represented by a grey-filled arc and delimited by a coloured line. The height of the
domain is proportional to the relative number of interactions in this domain given its size. The colour code from blue to red, numbered 1–10, indicates the
border strength or confidence score of the identification of domains. The y axis displays the relative Hi-C interaction frequencies and the horizontal line at
y ¼ 1 indicates the expected frequency, given the domain size. If the Hi-C relative interaction frequency inside the CID is higher than 1, that is, higher than
expected according to its size, then the domain is coloured in dark grey. Dashed grey rectangle has been zoomed-in in b. (b) Zoom-in region from a of three
consecutive domains. Domain border are represented by grey lines in the Hi-C matrix. (c) Absolute mean co-expression distribution of gene pairs, when
both genes are located within the same domain as shown in green, or genes between two different domains as shown in blue. Co-expression refers to the
degree by which genes change in the same direction under different perturbations, between all pairs (i,j) of genes. Here, we compared the absolute mean
co-expression of pairs of genes within and between domains. (d) Detailed absolute mean co-expression distribution across the 44 domains. Point sizes are
proportional to border strength. The colour depicts, as before, the two cases of gene pairs within the same domain, shown in green, and gene pairs between
different domains, shown in blue. (e) Absolute mean co-expression distribution as a function of genomic distance, with distances between gene pairs
smaller than 30 kb for the same two cases as in b and any gene pairs across the whole genome, as shown in white.
histone-like IHF NAP proteins and two sigma factors responsible indicating that the chromosome structure has a role in
for coordinating gene transcription. By combining Hi-C and transcription regulation.
super-resolution fluorescence imaging, we were able to identify The M. pneumoniae genome contact map revealed a double
fundamental principles of genome organization, such as the diagonal intersecting near the centre of the genome. This
partitioning of a reduced genome into domains. Furthermore, we corresponds to the midpoint and reflects a global symmetry
provide evidences that genes inside CIDs tend to be co-regulated, of the genome along the Ori-midpoint axis. The 3D models
NATURE COMMUNICATIONS | 8:14665 | DOI: 10.1038/ncomms14665 | www.nature.com/naturecommunications 7ARTICLE NATURE COMMUNICATIONS | DOI: 10.1038/ncomms14665
a
1.5
3 kb res. interac. freq.
Hi-C matrix Hi-C relative
1.0 1 2 3 4 5
0.5
6 7 8 9 10
0.0
Ori Ori
b 35,000 c d 3.5
10
30,000 9 3.0
8
25,000 2.5
CID border strength
7
CID size (bp)
CID density
20,000 6 2.0
5
15,000 1.5
4
10,000 3 1.0
2
5,000 0.5
1
0 0 0.0
Control Novobiocin Control Novobiocin Control Novobiocin
Figure 5 | Inhibiting supercoiling decreases the sharpness of domain borders. (a) Same as Fig. 4a, but with Hi-C HpaII Novobiocin-treated contact map
at 3 kb resolution. (b–d) Boxplot distributions and median values of CID size, border strength and density distribution in wild-type (orange) and Novobiocin-
treated (yellow) cells. The CID density is computed as the sum of all the Hi-C interactions in a domain divided by the expected number of interactions,
where the expected number of interactions is computed as an average for each genomic distance71. The units of the CID density are thus interactions
normalized by the genomic distance.
generated of the genome conformation resulted in the Ori and a b c
midpoint loci being located at the two opposite poles of Ori Ori
the structure. In addition, our DAPI staining and TEM images
indicated that the 3D chromosome models fit within the
dimensions of the M. pneumoniae cell. It is important to Ori Ter
take into consideration that the limited resolution of DAPI
imaging impeded an accurate estimation of the nucleoid
occupancy. Midpoint
Using super-resolution fluorescence imaging, we corroborated Ter
our 3D models of chromosome conformation. The distances
Figure 6 | Models of bacterial chromosome organization. Models of
estimated from the 3D models obtained using Hi-C data were
nucleoid organization with Ori and Ter represented by red and purple
overall larger than the ones obtained from super-resolution
circles. (a) Model of the E. coli genome with the four macro-domains
imaging of cells. This can be explained by the limited resolution
Ori, Ter, left, right, represented by circles in red, purple, pink and blue,
of our models (10 kb), as the actual occupancy of a bin within
respectively. (b) Model of the B. subtilis genome adapted from ref. 52.
the cell has not been determined. Moreover, the fixation
(c) 3D models of the M. pneumoniae genome conformation.
and permeabilization treatments of cells for FISH can induce
shrinkage artefacts. Imaging indicates that the midpoint locus is
the closest of all tested loci to the AO in both stationary
and exponential phases. In M. pneumoniae, the duplication of the the FISH protocol only allowed the study of fixed cells,
AO was reported to be coordinated with cell division, which is thereby limiting a deeper understanding of cell division in
known to occur by binary fission55. Furthermore, during M. pneumoniae.
cell replication but before nucleoid separation, the migration Previously, a double diagonal was also observed in the contact
of the AO to the opposite pole of the cell has been observed in map of the phylogenetically, closely related gram-positive
fixed cells, suggesting a coordination between the AO duplication bacterium B. subtilis21–23, as well as in two gram-negative
and DNA replication34. Once a new organelle has formed, bacteria C. crescentus17,18 and Vibrio cholera21. Interestingly,
it remains attached to the surface while the old AO pulls this symmetry observed along the two replichores was not
the dividing cell away from the nascent organelle, positioning observed in E. coli, which has an open chromosome structure
itself at the opposite pole56. Similarly, as described for the (Fig. 6a)20,21, likely due to the orientation of the chromosome
closely related species Mycoplasma gallisepticum57, our findings within the cell. Indeed, in B. subtilis and C. crescentus, the Ori and
suggest a possible anchoring of the DNA to the AO near the Ter are preferentially located at opposite poles early on in the
midpoint. Unfortunately, the observed cell-to-cell variability in cell cycle17,52, and both have an origin proximal region
the Ori-AO and midpoint-AO distances did not allow us parS (partition system) that assists in the orientation of the
to demonstrate that the AO is attached to a specific chromosome during replication58,59. In the case of C. crescentus17
chromosome region as division occurs. Technical restraints of the Ter is situated at the new pole and the left and right extend
8 NATURE COMMUNICATIONS | 8:14665 | DOI: 10.1038/ncomms14665 | www.nature.com/naturecommunicationsNATURE COMMUNICATIONS | DOI: 10.1038/ncomms14665 ARTICLE
along the cell17 (Fig. 6b), whereas in E. coli the left and right are the CID boundaries, it is likely that additional factors contribute
situated towards the two poles and the Ori and Ter are closer to to the formation of such domain loops. Furthermore, since
the middle of the cell60 (Fig. 6a). The chromosome organization M. pneumoniae only has a handful of DNA-binding proteins and
of C. crescentus is similar to that of M. pneumoniae in the fact that very few TFs (Table 1), it is intriguing that it is capable of
the Ori and midpoint (or Ter in C. crescentus) are localized at establishing a well-defined chromosome structure as well as
the two opposite poles (Fig. 6c), but differ in the fact that the maintaining CID boundaries. We speculate that very few
chromosome of C. crescentus has an ellipsoidal form with factors (such as the SMC protein) are necessary to define
periodically arranged arms twisting around each other17. a 3D chromosome structure and provide evidence that other
Several published studies have previously shown that elements like supercoiling could regulate these domain
mammalian genomes are partitioned into TADs24,25, which boundaries, which are characterized by low GC-content and
range from 200 kb to 1 Mb and are conserved across different might be related to the physicochemical properties of DNA.
species and cell types. Our analysis allowed the detection
of bacterial TAD-like domains (CIDs) for the first time in Methods
M. pneumoniae. More specifically, M. pneumoniae is partitioned Overview of methodology. With the aim of reconstructing the 3D chromosome
into a total of 44 CIDs, which range from 15 to 33 kb in size of M. pneumoniae we first performed Hi-C experiments, which enabled the
and are smaller than those reported for C. crescentus18 and purification of ligation products and subsequent massive parallel sequencing15.
Next, all fragments of reads were mapped to the M. pneumoniae genome with the
B. subtilis22,23. These M. pneumoniae CIDs could be related to iterative mapping method ICE45, and then further filtered and normalized45 to
the 10 kb loops that are bounded by stochastic barriers as obtain a genome-wide chromatin contact map. Next, the MMP score of the
suggested for E. coli6,7 and Salmonella enterica61. In contrast, the matrix47 was computed to assess its modelling potential. Finally, 3D models of the
nested domains reported for C. crescentus18 and B. subtilis22,23 M. pneumoniae genome were generated using TADbit16,48. To validate the
may be more related to the macrodomain-like regions identified computed 3D genome architecture, fluorescence and electron microscopy were
performed to estimate the cell dimensions and cell volume, as well as the distances
in E. coli. These findings suggest that domains are an elemental between different chromosomal regions.
component of genome organization throughout the evolution of Hi-C protocol with a 6-cutter. To fix the long-range DNA interactions15,
all organisms. Future work using super-resolution imaging of 3 109 M. pneumoniae M129 cells were grown in 150 cm2 flasks for 6 h
CIDs could estimate how variable the CIDs in prokaryotic cells (exponential phase) or for 96 h (stationary phase), and cross-linked with
1% formaldehyde (methanol free, Pierce) for 10 min at room temperature (RT).
are compared with the previous results of TADs in eukaryotes62. The reaction was stopped with 0.125 M glycine and cells were washed before lysis.
Furthermore, it has not been shown that a specific chromosome Four millilitre of lysis buffer (10 mM Tris HCl pH 8.0, 10 mM NaCl, 0.2% NP-40,
structure is essential for genomic functions as large genome redu- protease inhibitors from Roche, 1 mM EGTA) was added and cells were broken
ction done in Mycoplasma mycoides63 or genome reorientation17 with the help of a syringe/G25 needle (5 ). The lysate was distributed into four
tubes and spun in a tabletop centrifuge at 2,500g for 5 min. The supernatant was
does not seem to compromise cell viability. Thus having a defined removed and three pellets frozen for later use. One chromatin pellet was washed
chromosome structure seems to be important, but it can be twice with 1.4 ml of NEBuffer 2/3 (HindIII). After resuspension in 1 ml of
altered. However, large genome DNA rearrangements can have NEBuffer 2/3, 10 ml of 10% SDS was added, mixed carefully and incubated at
important effects on the presence, order and expression of 65 °C for 10 min to allow accessibility of restriction enzymes. Tubes were placed
back on ice immediately after incubation. SDS was quenched by adding 110 ml of
genes64, suggesting that chromosome domains are a fundamental 20% Triton X-100 and mixed carefully. Chromatin was digested by adding
principle of genome folding. 100 ml of 20,000 U ml 1 HindIII þ 5 mM EGTA and incubated at 37 °C overnight
We also observed, as previously reported for C. crescentus18, (O/N) while shaking. The next steps included marking the DNA ends with biotin
that inhibition of supercoiling by novobiocin significantly and performing blunt-end ligation of crosslinked fragments. This last step allows
reduced the sharpness of CIDs. Our finding suggests ligation junctions to be posteriorly purified. To fill in the restriction fragment
overhangs and mark the DNA ends with biotin, 5 ml of a mixture containing
that supercoiling could be regulating domain formation in 10 mM dATP, dGTP and dTTP, 62.5 ml 0.4 mM biotin-14-dCTP, and 41 ml
bacteria. Interestingly, our analysis also indicates that genes 2 U ml 1 Klenow was added to the Hi-C tubes, mixed carefully and incubated
inside CIDs tend to be co-regulated, with lower co-expression for 45 min at 37 °C. To inactivate the enzymes, 250 ml of 10% SDS was added to the
levels being detected between genes at the domain boundaries. In Hi-C tubes, before incubation at 65 °C for exactly 30 min, placing on ice
immediately afterwards. The ligation was performed under extremely dilute
C. crescentus, it was previously reported that domain borders conditions in order to favour ligation events between the cross-linked fragments.
correlated with the presence of highly expressed genes, being as Working on ice, 9 ml ligation mix (0.5 ml 20% Triton X-100, 1 ml 10x T4 ligation
the DNA is kept free of plectonemic loops during active buffer, and 7.5 ml water) was added to a 50 ml falcon tube and the digested
transcription18. Although we did not observe such a correlation chromatin was incorporated into the mixture of the corresponding tube. After
mixing by inverting the tubes, the ligation was performed for 4 h at 17 °C.
in M. pneumoniae, we established that not only domain borders Crosslinks were reversed and proteins degraded by adding 50 ml of 20 mg ml 1
are correlated with the presence of convergent and divergent gene proteinase K per Hi-C tube and incubating the tubes O/N at 65 °C. An additional
pairs but also that borders are characterized by low GC content 50 ml of 20 mg ml 1 proteinase K was added per tube the following day and
levels. Promoter orientation has been related to gene expression incubated at 65 °C for another 2 h. The reaction mixture was cooled to RT and
DNA was purified by performing an extraction in Maxtract tubes (Qiagen) with
regulation and more particularly divergent transcription one volume of phenol pH 8.0, and then with phenol/chloroform/IAA (25:25:1)
could create negatively supercoiled or underwound DNA, while (at each step the tube was vortexed for 2 min, spun for 5 min, 1,500g, at RT and as
AT content has been previously related to the physical properties much as possible of the aqueous phase was carefully transferred to a new 50 ml
of DNA such as DNA curvature. Similarly, it has also been tube). Then DNA was precipitated by adding 2 ml glycogen, 0.1 volumes of
reported in E. coli and Salmonella typhimurium that the 3 M sodium acetate, pH 5.5 and 2 volumes ethanol, left 30 min at 20 °C and
spun 25 min at 12,000g (Beckman-Coulter 25,50 rotor) at 4 °C. The pellet was
localization of domain loop boundaries is found in AT-rich washed with B5 ml 75% ethanol and air-dried before dissolving it in 400 ml
regions65, and more recently in B. subtilis that a considerable TE (10 mM Tris HCl pH 8.0, 1 mM EDTA). The DNA mixture was transferred
number of domains barriers overlap with AT-rich sequences to a clean 1.5 ml centrifuge tube. Another round of purification was performed by
acquired through horizontal gene transfer22. Even though the doing one phenol/chloroform/IAA extraction and DNA precipitated by adding
0.1 volumes of 3 M sodium acetate, 2 volumes of ethanol and incubating
contribution of NAP and SMC proteins in the global genome 30 min at 80 °C. After spinning down the precipitated DNA, the DNA pellet was
organization was recently refuted in E. coli20, as well as their role washed with 70% ethanol and resuspended in 25 ml TE. To degrade any RNA that
in the formation of CIDs in C. crescentus18, the formation of these might be present, 1 ml of 1 mg ml 1 RNAse A was added per tube and incubated
domains was consistent with the distribution of histone-like for 30 min at 37 °C. As some fragments do not get ligated, the exonuclease
activity of T4 DNA polymerase was used to remove the biotin, thereby avoiding
proteins binding sites, such as H-NS, HU, Fis and IHF. As any unligated fragments getting pulled down later. This was done by mixing
M. pneumoniae however has a limited number of copies of the B5 mg (B25 ml) of Hi-C DNA with 1 ml of 10 mg ml 1 BSA, 10 ml of
histone-like IHF protein41, thereby making it difficult to maintain 10 NEBuffer 2, 1 ml of 10 mM dATP, 1 ml of 10 mM dGTP and 5 U of
NATURE COMMUNICATIONS | 8:14665 | DOI: 10.1038/ncomms14665 | www.nature.com/naturecommunications 9ARTICLE NATURE COMMUNICATIONS | DOI: 10.1038/ncomms14665
T4 DNA polymerase in a total volume of 100 ml and incubated at 12 °C for 2 h. mij ¼ mij * (total reads)/(total reads in bin i * total reads in bin j). The iterative
The reaction was stopped by adding 2 ml of 0.5 M EDTA pH 8.0. To purify the procedure was repeated until the maximum relative error of the total number of
DNA, a phenol/chloroform/IAA extraction followed by ethanol precipitation was Hi-C scores in a bin was less than 10 5. The total number of reads before and after
done as described above. The supernatant was discarded and the DNA pellets filtering are shown in Supplementary Table 2. In addition, using a control library
resuspended in 50 ml of water. Then the DNA was sheared and size selected, to without formaldehyde fixation, computed as the sum of three control replicates
obtain a uniform size suitable for high-throughput sequencing. The DNA must be (r40.6, P valueo0.0001 Pearsons’ correlation test), we filtered interactions
sheared to a size of 300–500 bp with a Covaris nebulizer (10% duty cycle, intensity: off-diagonal and off-diagonal plus one, which are not due to 3D contacts in the
2,200 cycles, 45 s at 4 °C) in a minimum of 55 ml of TE. The concentration was chromosome, representing B2.6% of the total number of cells in the matrix. These
measured with Qubit (DNA, High sensitivity, Invitrogen). To repair the sheared interactions were found in two regions with a high sequence similitude computed
DNA ends, the Next (NEB) protocol was followed (blunting and A tailing). by the Needleman-Wunsch global sequence alignment with EMBOSS Needle66,
Subsequently the junctions were enriched by biotin pull-down, thus allowing for which justifies possible PCR artefact amplification for repetitive sequences.
the identification of interacting chromatin fragments by paired-end sequencing, as The affected bins were: 2, 5, 7, 11, 12, 13, 14, 15, 17, 18, 19, 20, 21, 25, 34, 35, 42, 44,
follows: Ligation junctions were purified from the DNA pool, first, 150 ml of 45, 50, 57, 58, 61, 62, 71, 74, 78. Subsequent analysis and visualization was done
resuspended streptavidin Dynabeads (Invitrogen) beads were washed twice with using R scripts.
400 ml of Tween Buffer (TB: 5 mM Tris HCl pH 8.0, 0.5 mM EDTA, 1 M NaCl,
0.05% Tween). All washes were done in the same manner: (i) buffer added to the
beads; (ii) sample rotated for 3 min at RT; (iii) sample spun briefly to collect all Reproducibility of Hi-C data. To analyse the reproducibility between all the
of the suspension; (iv) beads recovered using a magnetic particle concentrator; and HindIII and HpaII replicates in stationary phase, and between HpaII in exponential
(v) supernatant removed and beads resuspended in 600 ml of No Tween Buffer and stationary phase, we decomposed the two-dimensional matrices of normalized
(NTB: 5 mM Tris-HCl pH 8.0, 0.5 mM EDTA, 1 M NaCl) plus Hi-C DNA and filtered data sets into two, one-dimensional vectors row-by-row and computed
(B500 ng). Binding was allowed by incubating the mixture at RT for 15 min with the Pearson correlation coefficient between the two vectors with R (Supplementary
rotation, and recovering the DNA-bound streptavidin beads as above, before Methods).
washing in 400 ml of NTB followed by 100 ml of T4 ligase buffer (NEB). Finally the
beads were resuspended in 50 ml of ligation buffer and Illumina paired end adapters
were ligated (ratio: 1 ml of 2 mM primers per 10 ng of DNA) with 1,200 Units of Matrix modelling potential using MMP score. We computed the MMP score of
T4 DNA Ligase (NEB) for 2 h at RT. Non-ligated adapters were removed by the matrix to assess its potential for modelling, and also computed the predicted
recovering the Hi-C DNA bound beads and washing them twice with 400 ml of TB, accuracy of the models, named distance Spearman correlation coefficient, using the
once with 200 ml of NTB, and finally once with 200 ml and then 50 ml of NEBuffer 2. MMP score python script47. MMP score is based on the matrix size, the
After the last wash, the beads were resuspended in 25 ml of NEBuffer 2. The library contribution of significant eigenvectors in the matrix and the skewness and kurtosis
was PCR amplified with Phusion (Next kit, NEB): 2 ml of the suspension in a 50 ml of the z-scores distribution of the matrix.
reaction, and 1.0 and 2.1 Illumina primers (1 ml, 10 uM), for 16 cycles and
sequenced in the HiSeq Illumina platform.
Hi-C protocol with a 4-cutter. Chromatin was prepared as above20. When
Integrative 3D modelling with TADbit. The HpaII Hi-C matrix was used for
indicated, 100 mg ml 1 of novobiocin (Sigma) was added directly to the
modelling at a resolution of 10 kb after filtering by hiclib methodology45 and
medium 30 min before fixation. Cells were lysed with 4 ml of Hi-C Lysis buffer
additional filtering using a control library as previously mentioned. To build the
(10 mM Tris HCl pH 8.0, 10 mM NaCl, 0.2% NP-40, 5 mM EGTA and protease
3D models, we applied a restraint-based modelling approach using the TADbit
inhibitors) at 4 °C, passed 5 through a syringe/G25 needle and chromatin
python library16,47,48. The genome was defined by 82 particles, determined by the
collected by centrifugation (2,500g for 5 min, 4 °C, tabletop centrifuge). Only one
resolution of the contact map at 10 kb. Each particle had a radius of 100.5 nm that
pellet was used (the rest were frozen at 80 °C), and was washed twice in 1 ml of
was determined empirically with the scale parameter of 0.0201 nm per bp.
NEBuffer 1 plus 5 mM EGTA at 4 °C. Before digestion, chromatin was solubilized
First, TADbit identified empirically three optimal parameters using a grid search:
by adding 300 ml of NEBuffer 1, 5 mM EGTA and 0.1% SDS, incubated for 1 h at
(i) the proximal distance between two non-interacting particles set as 250 nm;
37 °C, and stopped with TX-100 (2% final). Afterwards, 100 U of HpaII was added
(ii) a lower-bound cutoff to define particles that do not interact frequently, set as
and incubated O/N at 37 °C. The reaction was stopped adding SDS to a final
0.6; and (iii) an upper-bound cutoff to define particles that do interact
concentration of 1.3% and incubated for 1 h at 50 °C. Half of the sample was
frequently, set as 0.2. Subsequently, considering an inverse relationship between
ligated by adding 5 ml of 10 NEB T4 Ligase buffer, 2.5 ml of 20% Tx-100,
the frequencies of interactions of the contact map and the corresponding spatial
0.5 ml of 0.5 M EGTA, in a final volume of 50 ml, and ligated with 20 U (50 ml)
distances, TADbit translated the frequencies of interactions into spatial restraints
of T4 DNA ligase (NEB), O/N at 16 °C. To de-crosslink the sample, 375 ml
between particles. Two consecutive particles were spatially restrained at an
of 20 mg ml 1 proteinase K was added for 2 h at 65 °C and purified by
equilibrium distance that corresponds to the sum of their radii. Non-consecutive
phenol extraction, Maxtract resin, and ethanol precipitated as above. Further
particles with contact frequencies above the upper-bound cutoff were restrained at
fragmentation was performed with Covaris to reduce the size of the DNA to
an equilibrium distance, while those below the lower-bound cutoff were
B200–500 bp (Duty cycle: 10%, int.: 2,200 cycles, 20 s at 4 °C). DNA was
maintained further than an equilibrium distance. Second, TADbit used a Monte
submitted to the CRG Ultrasequencing facility for standard Illumina library
Carlo simulated annealing sampling procedure to identify 3D models that best
preparation and paired-end sequencing.
satisfy all of the imposed restraints. The contact map obtained from the final
Genomic DNA preparation. For the controls without formaldehyde fixation,
models resulted in a Pearson correlation of 0.83 with the input Hi-C interaction
genomic DNA was prepared as in (Yus et al.)40 and digested and religated as above
matrix, which is indicative of good model accuracy47.
(without the need for de-crosslinking). The same equivalent concentration was
used in order to keep the infinite dilution conditions.
3D reconstruction of TEM imaging and cell volume. Mycoplasma cells were
scraped into fresh growth medium at 50-fold the concentration of the original
Generation of contact matrices. To construct the interaction maps of the culture. The cell suspension was put on a 3 3 mm piece of glass and left at
M. pneumoniae genome, read pairs of 50 bp were uniquely mapped to the MPN129 37 °C for 15 min. The cells on the glass were fixed with 1% glutaraldehyde in
reference genome (NC_000912, NCBI) covering 816,394 bp, using Bowtie2, and PBS containing 75 mM sodium phosphate (pH 7.3) and 68 mM NaCl for 3 min at
following the iterative mapping strategy ICE from the hiclib Python library45. RT, rinsed with 0.2 ml PBS once and then thoroughly washed in water.
The optimal start and end positions for mapping were determined using the The fixed cells were frozen at a liquid nitrogen temperature using CryoPress
fastq quality of the read, and set to 4 and 44, respectively. The minimal size for (Valiant Instruments, St Louis, MO), deep-etched, rotary-shadowed by platinum
mapping was set to 25 bp. The iterative mapping procedure starts with a read at an angle of 30°, and backed with carbon in a jet freezing device vacuum (JFDV)
length of 25 bp and increases by steps of 3 bp until a maximal read length of freeze-etching machine (JEOL Ltd, Akishima, Japan). Replicas were floated from
40 bp is reached. Only read pairs for which both reads uniquely aligned to the the glass by slowly immersing the surface into full-strength hydrofluoric acid,
genome were considered in subsequent steps. The MPN129 genome was divided cleaned with commercial bleach, rinsed in water, and picked up onto Formvar-
into restriction fragments (449 HindIII fragments, or 1,411 HpaII fragments) and coated 400-mesh copper grids as described67. Series of replica images were taken by
each read of a read pair was sorted into its corresponding restriction fragment. tilting the sample stage over 30° to both sides in 5° intervals, using a transmission
Read pairs were classified as valid Hi-C products, non-ligation products, or electron microscope (JEM1010, JEOL) at 80 kV.
self-ligation products, and only the valid Hi-C products were subsequently TEM images tilted with angles 30, 25, 20, 15, 10, 0, 5, 10, 15, 20,
considered below. We then constructed a genome wide matrix, M, of different 25, 30 were registered by cross-correlation with Matlab and rotated to ensure
resolutions (3, 5, 10, 15 and 20 kb) by dividing the genome into 3, 5, 10, 15 and a vertical rotation axis. The outline of the cell in each image was determined by
20 kb bins, and pooling interactions into their corresponding bins. To correct for thresholding using Fiji, followed by manual removal of background contamination
possible Hi-C artefacts, the matrix was then filtered and normalized using the and filling of gaps inside the bacteria. From these binarized images the sample area
methodology of iterative correction from the hiclib Python library45 as done could be extracted by counting pixels within the cell area. The volume of the cell
in a previous study for C. crescentus18. Essentially, the number of interactions, was then calculated by assuming each cell is rotationally symmetric along its long
or read counts was converted into Hi-C scores by applying the following axis (Supplementary Movie 3). The cell was segmented into cylinders and cones
equation and iteratively repeating it for the resulting contact map after each cycle: along this axis, and the volume was computed as the sum of both the cylinder and
10 NATURE COMMUNICATIONS | 8:14665 | DOI: 10.1038/ncomms14665 | www.nature.com/naturecommunicationsYou can also read