Repression of CHROMOMETHYLASE 3 prevents epigenetic collateral damage in Arabidopsis
←
→
Page content transcription
If your browser does not render page correctly, please read the page content below
RESEARCH ARTICLE

                                     Repression of CHROMOMETHYLASE 3
                                     prevents epigenetic collateral damage in
                                     Arabidopsis
                                     Ranjith K Papareddy1†*, Katalin Páldi1†, Anna D Smolka1, Patrick Hüther1,2,
                                     Claude Becker1,2, Michael D Nodine1,3*
                                     1
                                      Gregor Mendel Institute (GMI), Austrian Academy of Sciences, Vienna Biocenter
                                     (VBC), Dr. Bohr-Gasse 3, Vienna, Austria; 2Genetics, LMU Biocenter, Ludwig-
                                     Maximilians University, Martinsried, Germany; 3Laboratory of Molecular Biology,
                                     Wageningen University, Wageningen, Netherlands

                                     Abstract DNA methylation has evolved to silence mutagenic transposable elements (TEs) while
                                     typically avoiding the targeting of endogenous genes. Mechanisms that prevent DNA
                                     methyltransferases from ectopically methylating genes are expected to be of prime importance
                                     during periods of dynamic cell cycle activities including plant embryogenesis. However, virtually
                                     nothing is known regarding how DNA methyltransferase activities are precisely regulated during
                                     embryogenesis to prevent the induction of potentially deleterious and mitotically stable genic
                                     epimutations. Here, we report that microRNA-mediated repression of CHROMOMETHYLASE 3
                                     (CMT3) and the chromatin features that CMT3 prefers help prevent ectopic methylation of
                                     thousands of genes during embryogenesis that can persist for weeks afterwards. Our results are
                                     also consistent with CMT3-induced ectopic methylation of promoters or bodies of genes
                                     undergoing transcriptional activation reducing their expression. Therefore, the repression of CMT3
*For correspondence:                 prevents epigenetic collateral damage on endogenous genes. We also provide a model that may
rpapareddy1@g.ucla.edu (RKP);        help reconcile conflicting viewpoints regarding the functions of gene-body methylation that occurs
michael.nodine@wur.nl (MDN)          in nearly all flowering plants.
†
 These authors contributed
equally to this work

Competing interests: The             Introduction
authors declare that no
                                     Methylation of DNA encoding transposable elements (TE) is required to silence their expression and
competing interests exist.
                                     consequently prevent them from mobilizing and mutagenizing genomes (Kato et al., 2003;
Funding: See page 18                 Law and Jacobsen, 2010). Complex mechanisms have evolved to balance the high degree of sensi-
Received: 13 April 2021              tivity needed to direct methylation and silencing of TEs with the precision required to prevent
Accepted: 21 July 2021               ectopic methylation of endogenous genes (Antunez-Sanchez et al., 2020; Ito et al., 2015;
Published: 23 July 2021              Papareddy et al., 2020; Saze and Kakutani, 2011; Williams et al., 2015; Zhang et al., 2020). How-
                                     ever, little is known about the mechanisms of epigenome homeostasis during embryogenesis when
Reviewing editor: Richard
Amasino, University of Wisconsin
                                     organisms are particularly vulnerable to TE-induced mutagenesis, as well as the establishment of
Madison, United States               potentially deleterious epimutations that can persist through many cell divisions and even across
                                     generations (Henderson and Jacobsen, 2007; Mathieu et al., 2007; Probst et al., 2009;
   Copyright Papareddy et al.
                                     Saze et al., 2003; Mittelsten Scheid et al., 1998).
This article is distributed under
                                         In Arabidopsis thaliana (Arabidopsis), most TEs are found in pericentromeric regions of the
the terms of the Creative
Commons Attribution License,         genome to which RNA polymerases have limited access (Arabidopsis Genome Initiative, 2000;
which permits unrestricted use       Lippman et al., 2004; Zhang et al., 2006). These TE-enriched constitutive heterochromatic regions
and redistribution provided that     are characterized by high densities of cytosine methylation in symmetric (CG or CHG; H 6¼ G) and
the original author and source are   asymmetric (CHH) contexts, as well as histone H3 lysine dimethylation (H3K9me2) and other tran-
credited.                            scriptionally repressive chromatin marks (Cokus et al., 2008; Lister et al., 2008; Stroud et al.,

Papareddy, Páldi, et al. eLife 2021;10:e69396. DOI: https://doi.org/10.7554/eLife.69396                                         1 of 25
Research article Genetics and Genomics Plant Biology
2014). Symmetric DNA methylation and H3K9me2 also facilitate the stable propagation of silenced
states through cell divisions (Jackson et al., 2002; Lindroth et al., 2001; Stroud et al., 2013,
Stroud et al., 2014). METHYLTRANSFERASE 1 (MET1) maintains CG methylation through mitotic
and meiotic cell divisions with high fidelity due to VARIANT IN METHYLATION 1/2/3 (VIM1/2/3) pro-
teins that recognize hemi-methylated CG and recruit MET1 to methylate daughter strands
(Feng et al., 2010; Finnegan and Dennis, 1993; Ning et al., 2020; Woo et al., 2008). CG methyla-
tion can also recruit RNA Polymerase IV complexes required to produce 24-nt small interfering
RNAs (siRNAs) that are then loaded onto Argonaute proteins and guide them to target loci by base-
pairing with nucleic acids (Blevins et al., 2015; Herr et al., 2005; Papareddy et al., 2020;
Zhai et al., 2015; Zilberman, 2003). This leads to the recruitment of DOMAINS REARRANGED ME
THYLTRANSFERASES 1/2 (DRM1/2) and results in de novo methylation of cytosines in all sequence
contexts, including CHH, which is a hallmark feature of RNA-directed DNA methylation (RdDM)
(Cao and Jacobsen, 2002; Stroud et al., 2013; Wierzbicki et al., 2008). However, RdDM is typically
restricted from constitutive heterochromatin because it is inaccessible to DNA-dependent RNA poly-
merase IV and methyltransferases required for RdDM (Papareddy et al., 2020; Zemach et al.,
2013). Instead, CHH methylation of constitutive heterochromatin is mediated by CHROMOMETH
YLASE 2 (CMT2) that binds to H3K9me2 deposited by KRYPTONITE (KYP) and closely related
SUPPRESSOR OF VARIEGATION 3–9 HOMOLOGUE PROTEIN 5/6 (SUVH5/6) methyltransferases
(Stroud et al., 2014; Zemach et al., 2013). CHROMOMETHYLASE 3 (CMT3) also forms interlocking
positive feedback loops with H3K9 methyltransferases (Du et al., 2012; Jackson et al., 2002;
Lindroth et al., 2001) but is more closely associated with the cell cycle and mediates CHG methyla-
tion (Ning et al., 2020).
CMT3-mediated CHG methylation is largely deposited on TEs. However, CMT3 can also induce
the ectopic methylation of protein-coding genes (Wendte et al., 2019). Moreover, the introduction
of Arabidopsis CMT3 transgenes into Eutrema salsugineum, which lost CMT3 millions of years ago
(Bewick et al., 2016), could occasionally reconstitute CG methylation on genes (Wendte et al.,
2019). The resulting gene-body methylation (gbM) could be stably maintained independent of the
CMT3 transgene for several generations (Wendte et al., 2019). However, it remains largely unknown
how CMT3 is restricted to targeting heterochromatin, as well as the consequences of CMT3-induced
hypermethylation of genes. Moreover, the functional significance of gbM in animals and plants has
been intensely debated. Because methylated cytosines are mutagenic due to associated cytosine
deamination (Shen et al., 1992; Sved and Bird, 1990), features associated with gbM have been
interpreted as evidence that gbM provides selective advantages that counterbalance this mutagene-
sis-imposed fitness penalty. For instance, gbM is depleted from transcription start and end sites
(Tran et al., 2005; Zhang et al., 2006; Zilberman et al., 2007), and it has recently been reported
that gbM helps prevent transcription initiation from cryptic promoters located in gene bodies as ini-
tially proposed (Choi et al., 2020; Zilberman et al., 2007). Moreover, gbM tends to be enriched on
constitutively expressed genes (Lister et al., 2008; Niederhuth et al., 2016; Takuno et al., 2017;
Zhang et al., 2006), which would be consistent with gbM stabilizing gene expression by excluding
certain histone variants (i.e. H2A.Z) from genes (Coleman-Derr and Zilberman, 2012) and generally
enhancing gene expression (Muyle and Gaut, 2019; Shahzad et al., 2021). Nevertheless, accumu-
lating evidence is also consistent with gbM being a heritable by-product of CMT3-induced epimuta-
tions (Bewick et al., 2016; Bewick et al., 2019; Wendte et al., 2019).
Consistent with the need to fine-tune the amount of CMT3 activities required to both silence TEs
and prevent epimutations on genes, mechanisms exist that transcriptionally (Ning et al., 2020) and
post-translationally (Deng et al., 2016) regulate CMT3, as well as remove H3K9me2 specifically from
expressed genes (Inagaki et al., 2010; Saze et al., 2008). These and additional mechanisms are
likely of utmost importance during embryo development when a proliferative morphogenesis phase
produces the most fundamental cell lineages of the plant, including those that will eventually gener-
ate the gametes. Yet, how DNA methylation pathways are regulated during this phase of dynamic
cell division to exquisitely balance the need for TE methylation with the prevention of potentially del-
eterious and stably inherited epimutations is virtually unknown.
Papareddy, Páldi, et al. eLife 2021;10:e69396. DOI: https://doi.org/10.7554/eLife.69396 2 of 25Research article Genetics and Genomics Plant Biology
Results
Cell division is linked with CG and CHG methylation through distinct
mechanisms
MET1 and VIM1/2/3 are required for the faithful transmission of mCG across cell cycles (Feng et al.,
2010; Finnegan and Dennis, 1993; Ning et al., 2020; Woo et al., 2008) and accordingly had
increased transcript levels in rapidly dividing early embryos that also correlated well with transcripts
encoding cell-cycle activators throughout embryogenesis (Figure 1A; Hofmann et al., 2019;
Papareddy et al., 2020). More specifically, MET1 and VIM1/2/3 transcript levels peaked at the early
heart stage and were reduced afterwards before plummeting at the mature green stage. These tran-
script developmental dynamics were also characteristic of transcripts encoding proteins involved in
licensing DNA replication (e.g. Cyclins A2/B1, CDKB1-1, MINICHROMOSOME MAINTENANCE2),
heterochromatin maintenance (e.g. DDM1) and DNA methylation (e.g. CMT3), but not randomized
controls (Figure 1B, Figure 1—figure supplement 1A). Therefore, genes required for DNA methyla-
tion and heterochromatin maintenance are tightly correlated with cell-cycle activity during
embryogenesis.
To test whether the patterns observed for transcripts regulating DNA methylation reflect DNA
methylation dynamics, we computed differentially methylated cytosines (DMCs) across flowers,
embryos and leaves (see Materials and methods). Similar to previous observations (Bouyer et al.,
2017; Lin et al., 2017; Papareddy et al., 2020), 70% of DMCs occurred in the CHH context
(Figure 1C). Consistent with dynamic expression patterns of MET1 and CMT3, substantial fractions
of DMCs occurred in CG (20%) or CHG (10%) contexts, respectively. Therefore, DNA methylation is
dynamically reconfigured in all sequence contexts during embryogenesis. In total, these symmetric
DMCs represented 1185 CG (Supplementary file 1) and 1398 CHG (Supplementary file 2) differen-
tially methylated regions (DMRs) covering 201 kb and 185.8 kb, respectively (Figure 1D,
Supplementary file 1; see Materials and methods). Although a significant fraction of CG and CHG
DMRs overlapped (n = 183; 7.1% of total), the vast majority of CG and CHG DMRs were located in
non-overlapping genomic regions corresponding to euchromatic gene-rich and heterochromatic TE-
rich regions of the genome, respectively (Figure 1D). Because CHG methylation can require CG
methylation (Stroud et al., 2013), we tested whether the 15.1% of CHG DMRs overlapping CG
DMRs require CG methylation. Leaves deficient in CG methylation did not have reduced CHG meth-
ylation in CHG DMRs regardless of whether or not they overlapped with CG DMRs (Figure 1E,F;
data from Stroud et al., 2013). This indicates that CHG DMRs occur in distinct genomic regions and
are largely independent of CG methylation.
Relative to floral bud samples, CG DMRs have slightly reduced methylation in preglobular
embryos, followed by increased methylation until after the torpedo stage, when levels dramatically
reduce in mature green embryos and recover in leaves (Figure 1G). By contrast, methylation levels
of CHG DMRs are relatively stable between floral buds and early embryos, then decrease in late
embryos, reaching a minimum in leaves (Figure 1H). Accordingly, changes in CG and CHG DMR
methylation levels during development were significantly correlated with MET1 (Pearson’s R = 0.8; p
value = 0.03) and CMT3 (Pearson’s R = 0.74; p value = 0.05) transcript levels, respectively (Figure 1—
figure supplement 1B,C). Therefore, although cell division rates are correlated with symmetric DNA
methylation dynamics, distinct mechanisms reconfigure CG or CHG methylation genome-wide dur-
ing embryogenesis.
Genome-wide coordination of symmetric DNA methylation
Because DNA methylation is concentrated on TEs (Stroud et al., 2013; Zhang et al., 2006), we next
investigated global developmental dynamics of TE methylation. CG methylation on both euchro-
matic and heterochromatic TEs was slightly reduced in pregobular embryos and then restored to the
levels found in floral buds by the early heart stage (Figure 2A,B). Whereas CG methylation of
euchromatic TEs was relatively constant for the remainder of embryogenesis, heterochromatic TEs
had significantly increased methylation during late embryogenesis compared to post-embryonic tis-
sues. Consistent with heterochromatin becoming highly condensed during embryo maturation
(van Zanten et al., 2011), we found that CG hypermethylation in mature green compared to bent
cotyledon embryos predominantly occurred in pericentromeric genomic regions rather than gene-
Papareddy, Páldi, et al. eLife 2021;10:e69396. DOI: https://doi.org/10.7554/eLife.69396 3 of 25Research article Genetics and Genomics Plant Biology
Figure 1. Cell division is linked with CG and CHG methylation through distinct mechanisms. (A) Bar chart
depicting total abundance (top) and heat map of individual relative transcript levels (bottom) of genes involved in
CG methylation in three biological replicates each of flowers, embryos, and leaves (Hofmann et al., 2019). fb,
floral buds; pg, preglobular; gl, globular; eh, early heart; lh, late heart; et, early torpedo; lt, late torpedo; bc, bent
cotyledon; mg, mature green; lf, leaf. (B) Heatmap showing developmental dynamics of permuted gene set (top)
median values (i.e. 1000 iterations of random sampling of 25 genes) and top-25 genes co-varying with MET1,
VIM1, VIM2, and VIM3 obtained by employing nearest neighbor algorithm calculated based on Euclidean distance
between genes and centroid expression of MET1, VIM1, VIM2, and VIM3 (bottom). (C) Sequence logo
representing nucleotide probability relative to differentially methylated cytosines (DMC). (D) Proportion of CG and
CHG differentially methylated regions (DMRs) overlapping genomic features. Venn diagram showing overlap
between CG and CHG DMRs. Significance overlap of DMRs determined by Fisher’s Exact test p value < 0.0001 is
indicated by ****. (E and F) Violin plot showing CG (top) and CHG (bottom) methylation differences between
mutant and WT leaves for CHG DMRs overlapping (E) or not overlapping (F) with CG DMRs (Stroud et al., 2013).
(G and H) Box plots of average weighted methylation of CG DMRs (n = 1185) and (G) CHG DMRs (n = 1398)
during development. fb, floral buds; pg, preglobular; eh, early heart; tp, torpedo (6 DAP) Pignatta et al., 2015;
bc, bent cotyledon; lt-mg, late torpedo-to-early mature green Hsieh et al., 2009; mg, mature green
Bouyer et al., 2017; lf, leaf. fb, pg, eh, bc and lf were from Bouyer et al., 2017; Hsieh et al., 2009;
Papareddy et al., 2020; Pignatta et al., 2015. Unless stated as not significant (ns), all combinations are
significant with p values < 0.001 obtained by Mann-Whitney U test. Shaded horizontal line in the background
represents the median methylation value of floral buds.
The online version of this article includes the following figure supplement(s) for figure 1:
Figure supplement 1. Characteristics of genes and differentially methylated regions co-expressed with symmetric
methyltransferases.
rich chromosomal arms (Figure 2C). CG methylation was required for the production of 24-nt
siRNAs from euchromatic TEs, but only marginally for heterochromatic TEs (Figure 2—figure sup-
plement 1A, data from Lister et al., 2008). Conversely, the loss of 24-nt siRNAs in nrpd1a mutants
only had negligible effects on CG methylation of both heterochromatic and euchromatic TEs (Fig-
ure 2—figure supplement 1B,C). Therefore, siRNA production from euchromatic regions of the
genome requires CG methylation, but not vice versa.
Papareddy, Páldi, et al. eLife 2021;10:e69396. DOI: https://doi.org/10.7554/eLife.69396 4 of 25Research article Genetics and Genomics Plant Biology
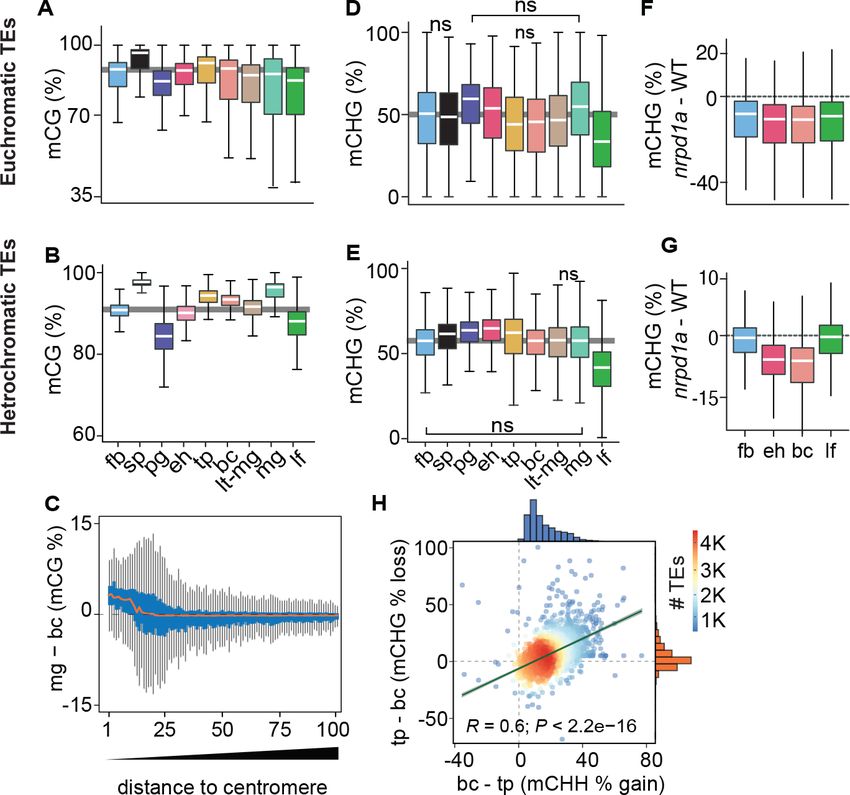
Figure 2. Genome-wide coordination of symmetric DNA methylation. (A and B) Boxplots of CG methylation
percentages on euchromatic (A) and heterochromatic (B) TEs during development. fb, floral buds; sp, sperm
(Ibarra et al., 2012); pg, preglobular; eh, early heart; tp, torpedo (6 DAP); bc, bent cotyledon; lt-mg, late torpedo-
to-early mature green; mg, mature green; lf, leaf. Thick horizontal bars indicate medians, and the top and bottom
edges of boxes represent the 75th and 25th percentiles, respectively. Shaded horizontal line in the background
represents the median methylation value of floral buds. (C) Difference in CG methylation between mature green
(mg) and bent cotyledon (bc) embryos were calculated in 1 kb genomic bins, which were divided into percentiles
and sorted based on their distance to centromeres (1 and 100 being the tile closest and furthest from
centromeres, respectively). Red color line indicates the median and the top and bottom edges of the blue colored
boxes represent 75th and 25th percentiles, respectively. Vertical gray bars indicate 1.5X the interquartile range. (D
and E) Boxplots of CHG methylation on euchromatic (D) and heterochromatic (E) TEs during development (key as
in A). (F and G) Boxplots of CHG methylation differences between nrpd1a and WT (Col-0) tissues for euchromatic
(F) and heterochromatic (G) TEs. (H) Scatterplot showing Pearson’s correlation coefficients (R). Differences in
mCHH and mCHG between bent cotyledon (bc) and torpedo stage (tp) embryos are shown on x- and y-axes,
respectively. Histograms show the number of TEs in thousands (K).
The online version of this article includes the following figure supplement(s) for figure 2:
Figure supplement 1. Relationships between MET1 and 24-nt siRNAs.
Global CHG methylation of euchromatic and heterochromatic TEs was higher in embryos com-
pared to leaves (Figure 2D,E). Similar to previous observations for CHH methylation
(Papareddy et al., 2020), siRNA-deficient nrpd1a mutant tissues had reduced CHG methylation on
euchromatic or heterochromatic TEs in all or only embryonic samples, respectively (Figure 2F,G).
Intriguingly, increased CHH methylation on heterochromatic TEs was significantly correlated with
decreased CHG methylation during late stages of embryogenesis when cell division rates are
reduced (Figure 2H). Therefore, CMT3-dependent CHG and CMT2-dependent CHH methylation of
heterochromatic TEs are positively and negatively correlated with cell division rates, respectively.
Papareddy, Páldi, et al. eLife 2021;10:e69396. DOI: https://doi.org/10.7554/eLife.69396 5 of 25Research article Genetics and Genomics Plant Biology
Repression of CMT3 during embryogenesis regulates methylome
dynamics
CMT3 is recruited to loci by binding to H3K9me2 deposited by SUVH4/5/6 histone methyltransfer-
ases (Du et al., 2012; Jackson et al., 2002; Lindroth et al., 2001; Stroud et al., 2014). CMT3 and
KYP, which is the major SUVH4 H3K9 methyltransferase, were dynamically expressed according to
patterns characteristic of other cell-cycle regulated genes and CHG methylation dynamics
(Figure 1B,H, Figure 3A). More specifically, CMT3 and KYP were highly expressed in rapidly dividing
early embryos and had reduced expression in late embryos until the mature stage, where they were
barely detectable. Altogether, our results are consistent with the idea that the more rapid cell divi-
sions in early embryos demand higher levels of CMT3 and KYP to maintain mCHG through the cell
cycle. Moreover, IBM1, which encodes an H3K9me2 demethylase and prevents CMT3 recruitment to
gene bodies (Miura et al., 2009; Saze et al., 2008), is dynamically expressed during embryogenesis
in a pattern that strongly resembles CMT3 and KYP (Figure 3A). Therefore, co-expression of IBM1
with CMT3 and KYP likely helps limit ectopic H3K9me2 and methylated CHG on gene bodies during
Figure 3. Repression of CMT3 during embryogenesis regulates methylome dynamics. (A) Barplots illustrating transcript levels of CMT3 (top), KYP
(middle), and IBM1 (bottom) in flowers, embryos, and leaves. fb, floral buds; pg, preglobular; gl, globular; eh, early heart; lh, late heart; et, early
torpedo; lt, late torpedo; bc, bent cotyledon; mg, mature green; lf, leaf. (B) Line graphs showing the relative RNA abundance of miR823 (blue), CMT3
RNA (yellow), and miR823:CMT3 cleavage products (pink). (C) Log2-transformed relative CMT3 target transcript levels in bent cotyledon embryos (8
DAP; day after pollination) from WT plants (Col-0), or cmt3-11 plants expressing either miR823-cleavable CMT3 (cCMT3) or miR823-resistant CMT3
(rCMT3) versions. Each dot represents the mean of two technical replicates of embryos and bars represent mean values. Error bars in A-C represent
standard errors of the means of three biological replicates. Asterisks indicate whether the transcript levels observed in mir823 mutant, cCMT3 and
rCMT3 embryos were significantly different compared to WT (Two-tailed Student’s t tests; ****, ***, **, and * represent p values < 0.0001, < 0.001, <
0.01, and < 0.05, respectively). Color-coded according to the key. (D) Boxplots of CHG methylation on transposons with five informative cytosines
covered by four reads and classified as either euchromatic or heterochromatic in Papareddy et al., 2020. pValues < 0.0001 based on Mann-Whitney
U tests of methylation differences between WT and either mutant or transgenic bent cotyledon embryos are represented by ****. (E) Metaplots of
average CHG methylation percentages across genes bodies from transcription start sites (TSS) to transcription end sites (TES), 1.5 kb upstream and 1.5
kb downstream of genes in bent cotyledon embryos. Color-coded according to the key. (F and G) Boxplots of CHG methylation on transposons (F) and
metaplots of CHG methylation on genes (G) in three-week old plants as described in D and E, respectively.
The online version of this article includes the following figure supplement(s) for figure 3:
Figure supplement 1. mir823 mutants and effects of miR823-directed repression of CMT3.
Papareddy, Páldi, et al. eLife 2021;10:e69396. DOI: https://doi.org/10.7554/eLife.69396 6 of 25Research article Genetics and Genomics Plant Biology
embryogenesis as has been demonstrated during post-embryonic development (Inagaki et al.,
2017).
We previously found that miR823-directed cleavage of CMT3 transcripts is highly enriched in
embryos directly after morphogenesis (Plotnikova et al., 2019). In contrast to CMT3 transcript
dynamics, miR823 accumulates during embryogenesis, and miR823:CMT3 cleavage products were
enriched and significantly detected specifically at late heart and early torpedo stages precisely when
CMT3 transcript levels were sharply decreasing (Figure 3B). Based on these observations, we
hypothesized that miR823-mediated repression of CMT3 contributes to the reduced CHG methyla-
tion levels observed during late embryogenesis.
To test if miR823-directed repression of CMT3 transcripts reduces CHG methylation levels during
embryogenesis, we generated deletions in the region of the MIR823 locus encoding the mature
miRNA (Figure 3—figure supplement 1A) and examined CMT3 transcript and CHG methylation lev-
els. Both independently generated mir823-1 and mir823-2 mutants were confirmed as nulls (Fig-
ure 3—figure supplement 1B) and had significantly increased CMT3 levels relative to wild type
(WT) in embryos at the bent cotyledon stage when CMT3 levels are normally reduced (Figure 3C).
Consistent with miR823-directed cleavage of CMT3 being highly enriched in embryos, we did not
observe increased CMT3 transcripts in either leaves or floral buds of mir823 mutants (Figure 3—fig-
ure supplement 1D). Moreover, CHG, but not CG or CHH, methylation was increased on TEs in
bent cotyledon embryos of both mir823-1 and mir823-2 mutants relative to WT (Figure 3D, Fig-
ure 3—figure supplement 1E).
As an independent approach, we used site-directed mutagenesis to introduce synonymous muta-
tions in the miR823 target site within CMT3 transgene constructs that included 1.41 kb upstream
and 0.73 kb downstream intergenic regions, and associated cis-regulatory elements (Figure 3—fig-
ure supplement 1C; see Materials and methods). As controls, we also generated CMT3 constructs
without mutations, and introduced these miR823-cleavable CMT3 (cCMT3), as well as the miR823-
resistant (rCMT3), constructs into cmt3-11 mutant plants (Henderson and Jacobsen, 2008). CMT3
transcript levels were increased in rCMT3 relative to cCMT3 lines at the bent cotyledon stage
(Figure 3C), but not in leaves or floral buds (Figure 3—figure supplement 1D), which further indi-
cates that miR823-directed cleavage and repression of CMT3 is highly enriched in embryos transi-
tioning between morphogenesis and maturation. CMT3 levels were also increased in cCMT3 and
rCMT3 lines compared to Col-0 in embryos, leaves, and floral buds (Figure 3C, Figure 3—figure
supplement 1D) suggesting that miR823 is not sufficient to repress transgenic CMT3 to the same
extent as endogenous CMT3 transcripts. Although we cannot rule out that this is due to missing cis-
regulatory repressive elements in the transgenes, increased gene dosage and positional effects of
the transgenes seems more likely. Upstream and downstream intergenic regions were included in
the CMT3 constructs (Figure 3—figure supplement 1G). Moreover, although relative transgene
copy numbers were not significantly different across the independently generated cCMT3 and
rCMT3 transgenic lines, they were higher than endogenous CMT3 in WT (Figure 4—figure supple-
ment 1G,H). Nevertheless, it is clear that CMT3 levels are finely tuned during embryogenesis.
Together with the analysis of mir823 mutants and miR823-mediated CMT3 transcript cleavage prod-
ucts (Plotnikova et al., 2019), these results strongly indicate that miR823 cleaves and represses
CMT3 levels during mid-embryogenesis. Consistent with what we observed in mir823 mutants,
increased CMT3 transcript levels in cCMT3 and rCMT3 embryos resulted in CHG hypermethylation
of TEs (Figure 3D) but did not globally influence CG or CHH methylation (Figure 4—figure supple-
ment 1E,F). Remarkably, increased CMT3 transcript levels in mir823 mutants, cCMT3 and most strik-
ingly rCMT3 embryos were associated with ectopic CHG methylation on protein-coding gene
bodies and flanking regions in bent cotyledon embryos (Figure 3E). Therefore, both TEs and genes
are hypermethylated when CMT3 levels are not properly downregulated upon the morphogenesis-
to-maturation transition during embryogenesis.
To test whether miR823-directed repression of CMT3 and prevention of CHG methylation of
genes that we observed in embryos persists after embryogenesis, we next profiled methylomes of
cCMT3 and rCMT3 plants 3 weeks after germination. We chose to focus on rCMT3 plants because
of the large amount of hypermethylation observed in these lines during embryogenesis, and used
cCMT3 plants as controls. Although TEs had increased CHG methylation levels in both cCMT3 lines
relative to WT, protein-coding genes were not affected (Figure 3F,G). In stark contrast, TEs and
genes were hypermethylated in both rCMT3 lines compared to cCMT3 or WT plants, and only
Papareddy, Páldi, et al. eLife 2021;10:e69396. DOI: https://doi.org/10.7554/eLife.69396 7 of 25Research article Genetics and Genomics Plant Biology
slightly reduced relative to the levels observed in rCMT3 bent cotyledon embryos (Figure 3F,G).
Together with miR823-independent processes (e.g. IBM1 removal of H3K9me2), miR823-directed
repression of CMT3 is therefore required to prevent the hypermethylation of protein-coding genes
that can be maintained weeks after the completion of embryogenesis.
Chromatin features associated with CMT3-induced gene methylation
To yield insights into how genes are hypermethylated upon the derepression of CMT3, we deter-
mined whether certain genomic features were associated with CMT3-induced genic methylation.
Toward this end, we first selected 22,637 nuclear-encoded protein-coding genes that had 5 meth-
ylC-seq reads overlapping CHG sites in rCMT3 line #3 and that were expressed (i.e. 1 TPM in any
tissue based on Hofmann et al., 2019). We chose rCMT3 line #3 because it had the strongest
genome-wide CHG hypermethylation and focussed on expressed genes to exclude those that may
have TE-like features, which could confound analysis. We then used k-means clustering of the differ-
ences between rCMT3 line #3 and WT bent cotyledon embryos to partition this set of genes into
four clusters (Figure 4—figure supplement 1A). These clusters were comprised of 1439–7882 genes
(6.4–34.8% of total) and ranged from groups of genes that had no methylation changes (cluster 1) to
those that were strongly hypermethylated with 3’ biases (cluster 4) in rCMT3 compared to WT
embryos (Figure 4A,B, Figure 4—figure supplement 1B,C). The same patterns were observed
across these clusters in embryos from an independently generated rCMT3 transgenic (line #1), which
indicates that CMT3-induced hypermethylation is not stochastic (Figure 4—figure supplement 1B,
C).
TE-like methylated (teM) genes generally have non-CG methylation on their gene bodies without
strong 3’ biases (Kawakatsu et al., 2016; Bewick et al., 2016). To check whether rCMT3-induced
genic CHG methylation is affected by teMs, we intersected our gene clusters with previously defined
teMs (Bewick et al., 2016) and found that only 272 of 22,637 (0.012%) expressed genes overlapped
teMs (Figure 4—figure supplement 1D). Hypermethylated clusters (clusters 3 and 4) contained
more teMs compared to unmethylated or lowly methylated gene clusters (Figure 4—figure supple-
ment 1E). However, rCMT3 embryos still had genic CHG hypermethylation and 3’ biases after
excluding teM genes, whereas, WT embryos remained devoid of CHG methylation (Figure 4—figure
supplement 1F,G). Therefore, our analysis is not confounded by either TEs or teM genes. As
expected, CMT3-induced hypermethylation predominantly occurred in the CMT3-preferred CWG
context (Gouil and Baulcombe, 2016; Li et al., 2018) although hypermethylation was also found in
CCG and slightly, but significantly in non-CHG contexts, including CG characteristic of gbM similar
to previous observations (Figure 4—figure supplement 1H; Wendte et al., 2019).
Consistent with methyltransferases preferring nucleosome-rich DNA as substrates
(Chodavarapu et al., 2010; Du et al., 2012), CMT3-induced hypermethylation was proportional to
patterns of nucleosome occupancy and biased towards the 3’ ends of gene bodies, which was highly
similar to CG methylation (Figure 4C, Figure 4—figure supplement 1I). Nucleosome spacing is pro-
moted by linker histone 1 (H1) (Choi et al., 2020; Fan et al., 2003) and CMT3-induced CHG hyper-
methylation was proportional to H1 levels across gene bodies (Figure 4—figure supplement 1J).
Because nucleosome occupancy was not as readily distinguishable between clusters of affected
genes (i.e. clusters 2–4) (Figure 4—figure supplement 1I,J), we hypothesized that histone variants
conferring differential nucleosome stabilities and chromatin accessibility may influence ectopic
CMT3-induced hypermethylation (Osakabe et al., 2018). Indeed, CHG hypermethylation across the
four groups was positively correlated with levels of the stable histone variants H2A, H2A.X and most
notably H2A.W that was recently shown to be required for CHG methylation (Figure 4E,F, Fig-
ure 4—figure supplement 1K; Bourguet et al., 2021; Yelagandula et al., 2014). CMT3-induced
CHG hypermethylation was also tightly associated with transcriptionally repressive H3K9me2 marks,
which are required for interdependent feedback loops with CMT3 (Figure 4G). It was inversely
related to H2A.Z (Figure 4H) and marks indicative of active transcription including H3K4me3 and
H3K9ac (Figure 4I, Figure 4—figure supplement 1L). Further suggesting that deregulated CMT3
prefers features typically associated with inaccessible chromatin, genes with CHG hypermethylation
had reduced chromatin accessibility (Figure 4—figure supplement 1M) and were generally closer
to heterochromatic centromeres (Figure 4—figure supplement 1N). Moreover, the most CMT3-
induced hypermethylated genes (i.e. cluster 4) were also substantially hypermethylated in ddm1
mutants (Figure 4J) that have increased heterochromatic accessibility (Figure 4K) and decreased
Papareddy, Páldi, et al. eLife 2021;10:e69396. DOI: https://doi.org/10.7554/eLife.69396 8 of 25Research article Genetics and Genomics Plant Biology
Figure 4. Chromatin features associated with CMT3-induced gene methylation. (A) Proportion of genes in each
cluster partitioned using k-means clustering algorithm based on differences in mCHG between rCMT3 (line #3)
and WT embryos. Unaffected genes (yellow), low mCHG gain genes (red), moderate mCHG gain genes (blue), and
high mCHG gain genes (gray). Green inner circle represents all expressed genes. (B–D) Metaplots showing mCHG
on gene clusters in bent cotyledon embryos from rCMT3 line #3 (L #3) (B), mCG on gene clusters in WT bent
cotyledon embryos (C) and mCHG in rCMT3 (L #3) 3-week-old plants (3WK) (D). Shaded ribbons in metaplots
represent standard deviations. (E–I) Metaplots showing normalized reads per genomic content (RPGC) average
values of histone variant H2A (E), H2A.W (F) (Yelagandula et al., 2014), H3K9me2 (G) (Stroud et al., 2014), H2A.Z
(H) (Yelagandula et al., 2014), and H3K4me2 (I) (Maher, 2020). p Values < 0.0001 obtained by Mann-Whitney U
test based on differences between genes in cluster 1 or four compared to all genes is represented by ****. (J)
Metaplots showing mCHG on gene clusters in seventh generation ddm1 mutants (Stroud et al., 2013). (K)
Normalized ATAC-seq reads (Zhong et al., 2021) representing accessibility of heterochromatic TEs (Het.TEs) in
WT and ddm1 mutants as defined in Papareddy et al., 2020.
The online version of this article includes the following figure supplement(s) for figure 4:
Figure supplement 1. Partitioning of CMT3-induced hypermethylated genes and associated chromatin features.
Papareddy, Páldi, et al. eLife 2021;10:e69396. DOI: https://doi.org/10.7554/eLife.69396 9 of 25Research article Genetics and Genomics Plant Biology
stability (Mathieu et al., 2003; Soppe et al., 2002; Zhong et al., 2021). Although CMT3-induced
CHG hypermethylation was strongly associated with CG gene-body methylation (gbM), both the
independence of developmental mCHG DMRs (Figure 1E,F) and the gain of mCHG being associ-
ated with proportional loss of mCG over genes in ddm1 mutants (Figure 4—figure supplement
1O; Ito et al., 2015; Stroud et al., 2013; Zemach et al., 2013) indicate that mCG is not strictly
required for ectopic CHG hypermethylation of genes. Instead, the associations between chromatin
features of genes and their propensity for CMT3-induced hypermethylation altogether suggest that
excessive CMT3 is ectopically recruited to genic chromatin characterized by nucleosome stability
and inaccessibility.
Impact of CMT3-induced hypermethylation on gene expression
Because CHG methylation of TEs contributes to their repression (Stroud et al., 2014), we tested
whether CMT3-induced ectopic CHG hypermethylation of protein-coding genes also represses their
expression levels. Namely, we performed mRNA-seq on three biological replicates of WT and
rCMT3 (line #s 1 and 3) bent cotyledon embryos. Principal component analysis revealed that WT and
rCMT3 biological replicates clustered according to genotype and in similar positions along the domi-
nant principal component axis corresponding to developmental time (Figure 5A). This indicates that
our mRNA-seq datasets captured gene expression variation inherent to WT and rCMT3 genotypes,
as well as that our staging was accurate. Differences in global transcript levels were not observed
across the four clusters with increasing levels of CMT3-induced CHG methylation suggesting that
ectopic CHG methylation alone was not sufficient to globally repress gene expression (Figure 5B,
Figure 5—figure supplement 1A). We then identified 916 genes that were differentially expressed
between rCMT3 and WT embryos (i.e. 2-fold differences and adj. p values 0.01; see
Materials and methods) (Figure 5—figure supplement 1B,C and Supplementary file 3). Differen-
tially expressed genes (DEGs), defined by comparing either rCMT3 line #1 or rCMT3 line #3 with
WT, were commonly detected in both independently generated lines with 87.5% of genes overlap-
ping (Figure 5—figure supplement 1C). In both rCMT3 lines, DEGs were less hypermethylated
compared to all expressed genes, which indicates that the vast majority of changes in gene expres-
sion observed upon up-regulation of CMT3 were not directly due to their hypermethylation (Fig-
ure 5—figure supplement 1D). We then examined whether hypermethylation affects a subset of
genes by computing DMRs in rCMT3 compared to WT bent cotyledon embryos and identified 4603
(97% of total) and 127 (3% of total) CHG hypermethylated and hypomethylated DMRs, respectively
(Supplementary file 4; see Materials and methods). Further suggesting that CHG hypermethylation
has minimal direct consequences on the expression of most genes under the conditions examined,
we found that only a small but significant number of the down-regulated genes (including 1.5 kb
regions flanking their transcriptional units) overlapped DMRs (21 of 542, 3.8% of total; Fisher’s exact
test, p value = 1.29e-05) (Figure 5—figure supplement 1E). Consistent with CMT3-induced hyper-
methylation repressing their expression, the DMRs overlapping these 21 down-regulated genes
were significantly CHG hypermethylated compared to genomic bins (Figure 5C). Moreover, the
stronger-expressing rCMT3 line #3 had significantly higher CHG methylation compared to rCMT3
line #1 (Figure 5C). This further supports that increased CMT3 levels lead to more ectopic CHG
methylation (Inagaki et al., 2010; Inagaki et al., 2017). However, the transcript levels of these 21
genes were only moderately reduced in rCMT3 line #3 compared to rCMT3 line #1, suggesting non-
linear relationships between gene hypermethylation and transcript levels (Figure 5—figure supple-
ment 1F). Strikingly, transcripts corresponding to these 21 CMT3-induced hypermethylated and
down-regulated genes were rapidly increasing when embryos were transitioning to the maturation
phase (Figure 5D). Moreover, 10 of these 21 genes (Fisher’s exact test, P value = 1.49e-13), were
among a group of 381 genes previously identified to also be rapidly activated at these time points
(Figure 5—figure supplement 1G; Hofmann et al., 2019). Nearly half of these 381 genes (n = 183,
48%) were also among the 563 significantly down-regulated genes in rCMT3 embryos compared to
WT. Altogether, our expression and methylation analyses suggest that when CMT3 is not properly
repressed it can induce ectopic hypermethylation of genes. Furthermore, we suggest that CMT3-
induced hypermethylation of gene promoters or bodies can reduce the steady state levels of tran-
scripts from genes that are in the process of switching from silent to active transcriptional states.
However, additional experiments are required to directly test whether gene-body CHG methylation
can repress gene expression.
Papareddy, Páldi, et al. eLife 2021;10:e69396. DOI: https://doi.org/10.7554/eLife.69396 10 of 25Research article Genetics and Genomics Plant Biology
WT (Col-0)
rCMT3 (L #1)
rCMT3 (L #3)
WT (Col-0)
rCMT3 (L #1)
rCMT3 (L #3)
DMR
Figure 5. Impact of CMT3-induced hypermethylation on gene expression. (A) Principal component analysis of
mRNA-seq from three biological replicates of rCMT3 and WT (Col-0) bent cotyledon embryos generated in this
study along with floral buds, embryos, leaves, from Hofmann et al., 2019 and color-coded according to the key.
(B) Violin plot showing transcript fold changes in rCMT3 (line #3) compared to WT (Col-0) bent cotyledon embryos
per cluster as defined in Figure 4A. (C) Boxplot showing difference in methylation comparing rCMT3 to WT in
down-regulated genes (DRG) intersecting with DMRs and similarly sized genomic bins of 213 bp as controls. p
Values < 0.001 and < 0.0001 based on Mann-Whitney U tests are represented by *** and ****, respectively. (D)
Boxplot (top) and heatmap (bottom) of transcript levels of DRGs intersecting DMRs during embryogenesis. p
Values < 0.001 based on differences in transcript levels between mature green (mg) and all other stages of
embryogenesis based on Mann-Whitney U test are represented by ***. (E) Integrative genome viewer (IGV)
screenshot of representative downregulated genes associated with DMRs.
The online version of this article includes the following figure supplement(s) for figure 5:
Figure supplement 1. Additional information regarding the influence of CMT3-induced hypermethylation on
gene expression.
Discussion
DNA methylation is faithfully propagated across cell cycles by methyltransferases to ensure robust
silencing of TEs (Borges et al., 2021; Law and Jacobsen, 2010; Mathieu et al., 2007; Ning et al.,
2020; Probst et al., 2009; Saze et al., 2003). However, it is not well understood how DNA
Papareddy, Páldi, et al. eLife 2021;10:e69396. DOI: https://doi.org/10.7554/eLife.69396 11 of 25Research article Genetics and Genomics Plant Biology
methyltransferases are regulated following periods of rapid division to prevent off-targeting of
genes and their consequential repression. Cell division rates are highly dynamic during Arabidopsis
embryogenesis. We found that the expression of MET1 and CMT3 methyltransferases and corre-
sponding CG and CHG methylation are intricately linked to mitotic indices through distinct mecha-
nisms (Figure 1). Moreover, miR823-mediated cleavage and repression of CMT3 following the
proliferative early phase of embryogenesis helps prevent excess CMT3 from ectopically methylating
protein-coding genes that can persist for weeks afterwards (Figure 3). CMT3-induced hypermethyla-
tion of genes was highly associated with features conferring nucleosome stability (Figure 4) and
resulted in the repression of genes that are transcriptionally activated (Figure 5). Repression of
CMT3 following a period when it is needed in high quantity to keep pace with TE methylation there-
fore prevents CMT3 from ectopically targeting protein-coding genes for methylation. This resulting
epigenetic collateral damage on protein-coding genes appears to negatively affect gene expression.
Our results are consistent with the model that CMT3-induced epimutations give rise to CG gene-
body methylation (gbM) that can be maintained by MET1 across many generations (Wendte et al.,
2019).
Complex mechanisms are required to specifically silence mutagenic TEs rather than endogenous
genes (Antunez-Sanchez et al., 2020; Deng et al., 2016; Lee et al., 2021; Lister et al., 2008;
Papareddy et al., 2020; Saze and Kakutani, 2011; Williams et al., 2015; Zhang et al., 2020).
Mechanisms regulating epigenome homeostasis are of paramount importance during Arabidopsis
embryogenesis due to highly dynamic cell cycle and transcriptional activities, as well as the establish-
ment of cell lineages that will produce all future cell types including the gametes. MET1 and CMT3
methyltransferases are required for TE methylation (Kato et al., 2003; Stroud et al., 2014) and are
expressed at high levels during early embryogenesis likely because this is a period of rapid cell divi-
sion. CHG and CHH methylation exhibit opposite developmental dynamics depending on the tis-
sue’s mitotic index (Figure 1, Figure 2, Figure 6; Papareddy et al., 2020). When embryos are
transitioning to stages with reduced cell division, decreased CMT3-mediated CHG methylation is
correlated with increased CMT2-mediated CHH methylation (Figure 2H). Unlike CMT2, CMT3 can
also target protein-coding genes for CHG methylation (Stroud et al., 2014) and lead to the recruit-
ment of transcriptionally repressive H3K9me2 methyltransferases such as KYP (Du et al., 2014;
Jackson et al., 2002; Lindroth et al., 2001). Therefore, handing over TE silencing to CMT2-depen-
dent CHH methylation in cells with reduced division rates likely reduces ectopic methylation of pro-
tein-coding genes. In addition to what we observed during embryogenesis, varying degrees of
mitotic indices across development can readily explain the genome-wide patterns of non-CG methyl-
ation reported thus far (Borges et al., 2021; Calarco et al., 2012; Gutzat et al., 2020; Ji et al.,
2019; Kawakatsu et al., 2016, Kawakatsu et al., 2017; Lin et al., 2017; Narsai et al., 2017;
Papareddy and Nodine, 2021).
CMT3, KYP and their corresponding DNA and histone methylation marks form interdependent
feedback loops that perpetuate silencing through cell divisions (Du et al., 2015; Ning et al., 2020).
Consistent with the transcription-coupled H3K9me2 demethylase IBM1 breaking these loops and
preventing ectopic CHG hypermethylation of genes, we found that CMT3, KYP, and IBM1 were
highly expressed during early embryogenesis (Figure 3). After this rapidly dividing morphogenesis
phase, transcripts from CMT3, KYP, and IBM1 decrease, and miR823 directs the cleavage and
repression of excess CMT3 to help prevent hypermethylation of protein-coding genes (Figure 3).
Excess CMT3 induces CHG methylation on distinct regions of protein-coding genes that are charac-
teristic of stable nucleosomes including transcriptionally repressive H3K9me2 marks that bind to
CMT3. Although the distribution of CMT3-induced CHG hypermethylation is strikingly similar to CG
gene-body methylation of genes (Figure 4B,C), this appears to be due to common targeting mecha-
nisms by CMT3 and MET1 rather than a strict prerequisite of CG. In fact, mutants with reduced CG
methylation (Figure 4—figure supplement 1O; Jacobsen and Meyerowitz, 1997; Lister et al.,
2008; Saze and Kakutani, 2007; Stroud et al., 2013) or species largely devoid of genic CG methyl-
ation (Wendte et al., 2019) can still recruit CHG on genes. CMT3-induced CHG methylation of
genes that we observed in rCMT3 transgenic plants was similar to ectopic gain of genic mCHG in
ddm1 mutants (Figure 4). Notably, heterochromatin becomes destabilized in ddm1 mutants
(Figure 4K; Mathieu et al., 2003; Soppe et al., 2002) and CMT3 prefers features associated with
stable (Figure 4E,F, Figure 4—figure supplement 1K; Bourguet et al., 2021; Osakabe et al.,
2018; Yelagandula et al., 2014) over unstable nucleosomes such as H2A.Z with active marks
Papareddy, Páldi, et al. eLife 2021;10:e69396. DOI: https://doi.org/10.7554/eLife.69396 12 of 25Research article Genetics and Genomics Plant Biology
AA
..A
cell division rate
Figure 6. Models for CMT3 regulation during periods of fluctuating cell division rates and destabilized chromatin.
(A) Model of non-CG methylation dynamics during embryo development and corresponding regulatory
mechanisms. (B) Model for how CMT3 equilibrium is maintained to restrict its activity to heterochromatin. Density
of transposable elements (TEs) (top; red) and genes (middle; blue) on chromosome 1. Cartoon illustration of gene
cluster location (bottom) according to key in Figure 4A. Black dot represents the centromere. (i) In steady state,
stable nucleosomes along with H3K9me2 and DNA methylation provides positive reinforcement to sequester
CMT3 to constitutive heterochromatin. (ii) Loss of DDM1 results in destabilized and accessible heterochromatin
(Zhong et al., 2021), characterized by loss of H3K9me2 and stable nucleosomes (Osakabe et al., 2021).
Accessible chromatin or DNA without stable nucleosomes is no longer a preferable substrate for CMT3 and results
in CHG hypomethylation of TEs. CMT3 will now be readily available and redirected to genic regions where it
Figure 6 continued on next page
Papareddy, Páldi, et al. eLife 2021;10:e69396. DOI: https://doi.org/10.7554/eLife.69396 13 of 25Research article Genetics and Genomics Plant Biology
Figure 6 continued
induces ectopic CHG methylation in proportion to the levels of stable nucleosomes and chromatin marks. (iii)
Excess levels of CMT3 causes genome-wide CHG hypermethylation with a preference for stable nucleosomes
associated with repressive marks that tend to be in regions closer to centromeres compared to chromosomal
arms.
(Figure 4H,I, Figure 4—figure supplement 1L). Although destabilization of heterochromatin has
been inversely correlated with genic CHG methylation (Ito et al., 2015; Zhang et al., 2020), chro-
matin features underlying this mechanism are unclear. Therefore, we propose that destabilization of
heterochromatin in ddm1 mutants redirects CMT3 to genic regions with stable nucleosomes. There-
fore, factors such as DDM1 that stabilize heterochromatin may be yet another mechanism required
to regulate CMT3 activity in order to achieve proper epigenome homeostasis (Figure 6).
CMT3-induced CHG hypermethylation of genes did not globally affect steady state transcript lev-
els (Figure 5). However, we observed exceptional association between CHG hypermethylation and
repression of genes that switch from transcriptionally inactive to active states. Because IBM1-medi-
ated removal of H3K9me2 marks is coupled to transcription (Inagaki et al., 2017), it is possible that
CMT3-induced methylation can form feedback loops with H3K9me2 methyltransferases when genes
are transcriptionally inert. However, when genes are switched on, H3K9me2 could repress initial
rounds of transcription before it is removed by IBM1. Accordingly, it may be difficult to detect the
effects of ectopic CHG methylation on gene expression when quantifying transcripts at steady state
with standard mRNA-seq. It is possible that we observed a repressive effect of CHG hypermethyla-
tion on a subset of genes because we profiled a developmental stage in which hundreds of genes
become transcriptionally activated at the onset of embryo maturation. Nevertheless, we cannot
completely exclude that the repression of hypermethylated genes undergoing transcriptional activa-
tion is due to secondary effects of other genes influenced by CMT3-induced hypermethylation.
Importantly, CMT3-induced CHG hypermethylation due at least partially to loss of miR823 repres-
sion in embryos is largely maintained for weeks after detectable miRNA activity (Figure 3). There-
fore, epigenetic collateral damage occurring in embryos may also negatively impact gene
expression later in life. However, additional experiments are required to directly test the relationship
between CMT3-induced hypermethylation and gene expression.
Transcriptional (Ning et al., 2020), post-transcriptional (Figure 3), post-translational (Deng et al.,
2016), post-hoc (Saze et al., 2008) and perhaps substrate-related (Figure 4) mechanisms fine-tune
CMT3 activities to levels required to specifically silence mutagenic TEs but not genes. However,
errors in restricting CMT3 to heterochromatin are inevitable on an evolutionary timescale
(Zhang et al., 2020) and recent studies indicate that CMT3-induced methylation of genes precedes
gbM (Wendte et al., 2019). Because gbM can be stably maintained over many generations by
MET1 and its functional significance is debatable (Bewick et al., 2016; Bewick et al., 2019;
Choi et al., 2020; Coleman-Derr and Zilberman, 2012; Le et al., 2020; Picard and Gehring, 2017;
Shahzad et al., 2021; Takuno and Gaut, 2013; Wendte et al., 2019; Williams et al., 2021; Zilber-
man, 2017), it cannot be excluded that gbM is merely an evolutionary record of epigenetic collateral
damage events that occurred in the past (Bewick and Schmitz, 2017; Bewick et al., 2017). Our
results suggest that derepressed CMT3 and MET1 both prefer genic regions characterized by
increased nucleosome stability (Figure 4). Accordingly, CMT3-induced CHG hypermethylation tends
to occur away from transcription start and end sites of genes in a nearly identical pattern as
observed for gbM (Figure 4). We propose that CHG methylation is more tolerated in central/3’
biased regions because they are relatively inaccessible to trans-acting factors that regulate transcrip-
tion. Moreover, our results tentatively suggest that CMT3-induced hypermethylation can repress
genes that are transcriptionally activated (Figure 5). Perhaps genes that are consistently expressed
can accumulate CHG methylation without having a large effect on steady state transcript levels and
resulting fitness penalties, and thus be more likely to accumulate gbM over evolutionary time. In
other words, miR823-mediated repression is one of several ways to prevent CMT3 from ectopically
methylating protein-coding genes. However, CMT3 off-targeting on genes may still occur despite
these complex regulatory mechanisms and the resulting epigenetic collateral damage can be
recorded as heritable gbM. The characteristic features of gbM may not pertain to its current
Papareddy, Páldi, et al. eLife 2021;10:e69396. DOI: https://doi.org/10.7554/eLife.69396 14 of 25Research article Genetics and Genomics Plant Biology
functions, but rather the consequences of transient CHG methylation that occurred in the past and
were selected on during evolution.
Materials and methods
Key resources table
Reagent type
(species) or resource Designation Source or reference Identifiers Additional information
Gene CHROMOMETHYLASE 3 TAIR AT1G69770
(Arabidopsis thaliana) (CMT3)
Gene MICRORNA 823A TAIR AT3G13724
(Arabidopsis thaliana) (MIR823A)
Genetic reagent miR823-cleavable this paper pAlligatorR43/promoterCMT3::
(Arabidopsis thaliana) CMT3 (cCMT3) genomicCMT3
Genetic reagent miR823-resistant this paper pAlligatorR43/promoterCMT3::
(Arabidopsis thaliana) CMT3 (rCMT3) resistantCMT3
(generated from cCMT3 with
site-directed mutagenesis)
Recombinant pAlligatorR43 (plasmid) DOI:10.7554/eLife.04501 mCherry selection marker
DNA reagent
Recombinant pHSE401 (plasmid) Addgene #62201 CRISPR/Cas9 plasmid
DNA reagent
Recombinant pCBCD-T1T2 (plasmid) Addgene #50590 CRISPR/Cas9 plasmid
DNA reagent
Strain cmt3-11T NASC SALK_148381 T-DNA insertion
(Arabidopsis thaliana) mutant of CMT3
Strain mir823-1 this paper miR823 knockout mutant
(Arabidopsis thaliana)
Strain mir823-2 this paper miR823 knockout mutant
(Arabidopsis thaliana)
Commercial kit Q5 Site-Directed New England #E0554S
Mutagenesis Kit Biolabs
Commercial kit Fast SYBR Green Roche #06402712001
Master Mix
Commercial kit SuperScript III Thermo Fisher Scientific #18080093
Reverse
Transcriptase
Commercial kit TRIzol Invitrogen #15596026
Software Lightcycler 96 Roche Diagnostics Version 1.1.0.1320
Plant material and growth conditions
Arabidopsis thaliana accession Columbia-0 (Col-0) were grown in controlled growth chambers at 20–
22˚C under a 16 hr light/8 hr dark cycle with incandescent lights (130 to 150 mmol/m2/s).
Generation of transgenic lines
The control genomic CMT3 construct (miR823-cleavable; cCMT3) was generated by PCR amplifica-
tion of the CMT3 locus including 1408 bp upstream and 730 bp downstream of the TAIR10-anno-
tated transcription start and end sites, respectively. PCR primers included overhangs for subsequent
Gibson assembly into MultiSite-Gateway destination vector pAlligatorR43 (Kawashima et al., 2013).
The miR823-resistant CMT3 construct (rCMT3) was generated by PCR site-directed mutagenesis (Q5
Site-Directed Mutagenesis Kit, New England Biolabs) using the cCMT3 construct as a template to
introduce six silent mutations as shown in Figure 3—figure supplement 1C. Both cCMT3 and
rCMT3 construct sequences were analyzed for mutations using Sanger sequencing. All primers used
are listed in the Supplementary file 5. The constructs were transformed into cmt3-11T
(SALK_148381) using the Agrobacterium floral dip method (Clough and Bent, 1998), and
Papareddy, Páldi, et al. eLife 2021;10:e69396. DOI: https://doi.org/10.7554/eLife.69396 15 of 25Research article Genetics and Genomics Plant Biology
transformants were selected based on seed-coat RFP signal under fluorescent light (Zeiss SteREO
DiscoveryV.8). Multiple independent first-generation transgenic (T1) lines were identified for cCMT3
and rCMT3, and three and four were characterized in bent cotyledon embryos for
each, respectively.
Generation of CRISPR/Cas9 knockout mutants for MIR823
CRISPR/Cas9 knockout mutants in MIR823 were created by using a modified pHSE401 binary vector
(Addgene #62201) according to the protocol detailed by Xing et al., 2014. Primers containing the
sequences for the two guide RNAs targeting the MIR823 locus flanking the miR823 sequence (Fig-
ure 3—figure supplement 1A and Supplementary file 5) were amplified together with the pCBCD-
T1T2 plasmid (Addgene #50590), and the resulting PCR product was subsequently assembled into
the pHSE401 binary vector using GoldenGate cloning method (Xing et al., 2014). Plants were trans-
formed with the floral dip method as described above; and Cas9-positive seeds were selected based
on the presence of seed coat RFP signal. Deletion lines were identified with PCR using primers flank-
ing gRNA-targeted sites (Figure 3—figure supplement 1A and Supplementary file 5). Deletion
mutants were confirmed and mapped by Sanger sequencing.
qRT-PCR analysis
Leaves (two-week old rosettes), floral clusters (five weeks) and bent cotyledon embryos (eight DAP)
were homogenized in 500 ml TRIzol reagent (Invitrogen) and total RNA was isolated and purified
according to manufacturer’s recommendations. For mRNA, 200 ng of total RNA was used for cDNA
synthesis with SuperScript III Reverse Transcriptase (Thermo Fisher Scientific). The cDNA was diluted
two-fold for embryos or ten-fold for leaves and floral buds with nuclease-free water. Two mL of
diluted cDNA was used as a template for the qRT-PCR with Fast SYBR Green Master Mix (Roche) on
a LightCycler 96 instrument (Roche) with two technical replicates for each biorep. For miRNA823
quantification, corresponding stem-loop primers were added to the RT reaction (adapted from
Yang et al., 2014) and miR823 levels were measured using Fast SYBR Green Master Mix (Roche)
with miRNA823-specific forward primer and a stem-loop specific universal reverse primer. U6 snRNA
was used as the reference RNA (adapted from Shen et al., 2010). Primers used for qRT-PCR are
listed in Supplementary file 5.
Sample size estimation, embryo isolation, and nucleic acid extraction
Sample sizes were determined based on a combination of the required statistical power, ability to
acquire samples and cost of the experiments. Bent cotyledon embryos were dissected from seeds 8
days after pollination and also selected based on morphology to ensure accurate staging. Embryos
were serially washed 4 with nuclease-free water under an inverted microscope. Approximately 50
embryos per replicate were isolated and stored at 80˚C until further use. RNA was isolated as pre-
viously described (Lutzmayer et al., 2017; Plotnikova et al., 2019). Genomic DNA was extracted
from embryos and 3-week old plants using Quick-DNA Micro prep Kit (Zymo D3020) according to
the recommendations of the manufacturer.
DNA methylation profiling and analysis
MethylC-Seq libraries were generated as described previously (Papareddy et al., 2020) and
sequenced in single-read mode on an Illumina HiSeq 2500 or Nextseq 550 instrument. Adapters and
the first six bases corresponding to random hexamers used during the pre-amplification step were
trimmed from MethylC-seq reads using Trim Galore. Bisulfite-converted reads were aligned against
the TAIR10 genome (Lamesch et al., 2012) in non-directional mode using Bismark (bismark –non_-
directionalX-qX–score-min L,0,–0.4) (Krueger and Andrews, 2011). Methylpy software was
used to extract weighted methylation rates for each available cytosine from BAM files containing
only deduplicated and uniquely mapped reads (Schultz et al., 2015). Reads mapping to the unme-
thylated chloroplast genome were used to calculate bisulfite conversion rates. FASTQ files obtained
from publicly available methylomes generated from sperm (Ibarra et al., 2012), early torpedo
(Pignatta et al., 2015), mid-torpedo to early maturation (Hsieh et al., 2009), mature green embryos
(Bouyer et al., 2017) and DNA methylation mutant leaves (Stroud et al., 2013) were also processed
in a similar manner except that alignments were performed in directional mode and only 50 end
Papareddy, Páldi, et al. eLife 2021;10:e69396. DOI: https://doi.org/10.7554/eLife.69396 16 of 25You can also read